Inspiration
Moving or relocating is a lifechanging milestone, and weather and climate play a big role in people's decisions. Overall climate, frequency of natural disasters, and other geographical features affect housing preferences, so we decided to create a fun and interactive way to allow people to learn what best suits them based on their income, location, and demographic. After extracting and analyzing data, we wanted to gamify our users' experiences by creating an interactive quiz and assigned each user a unique creature that best matches their descriptions and provides them advice on next steps to take.
What It Does
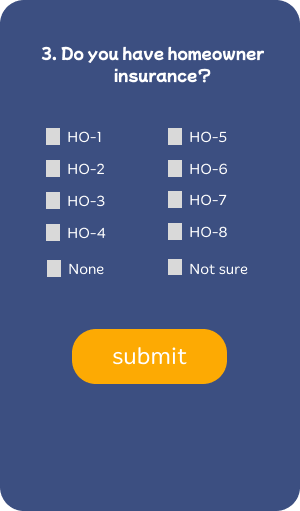
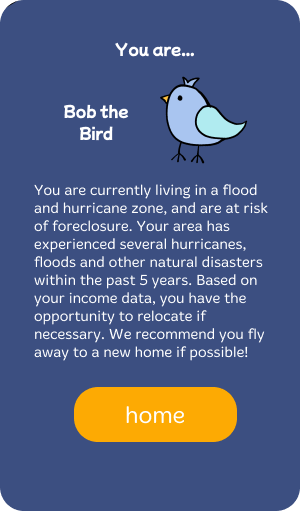
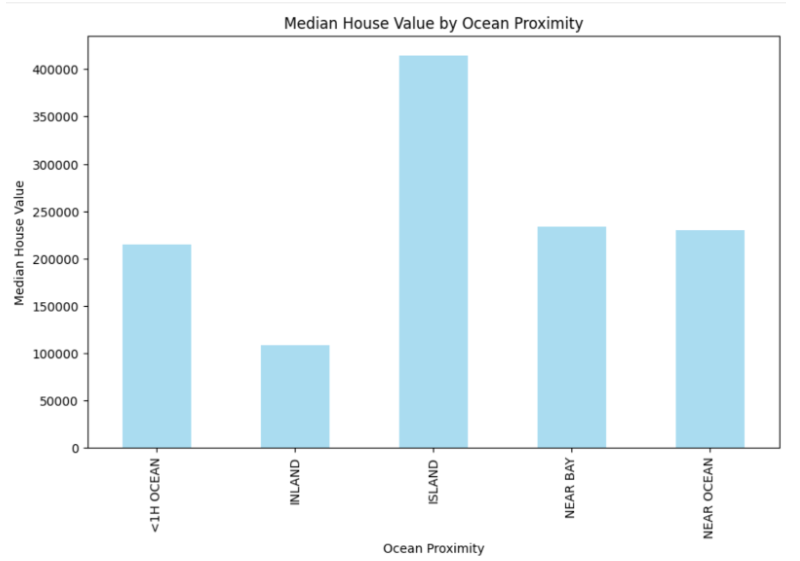
This app uses visualizations from analysis of various datasets relating to weather and climate and their impacts on housing, such as foreclosures, housing costs, and more. The quiz takes in information about the users' income level, financial situation, current home location, and desired home location to assess which creature (ex. Bob the Bird) best suits them.
How We Built It
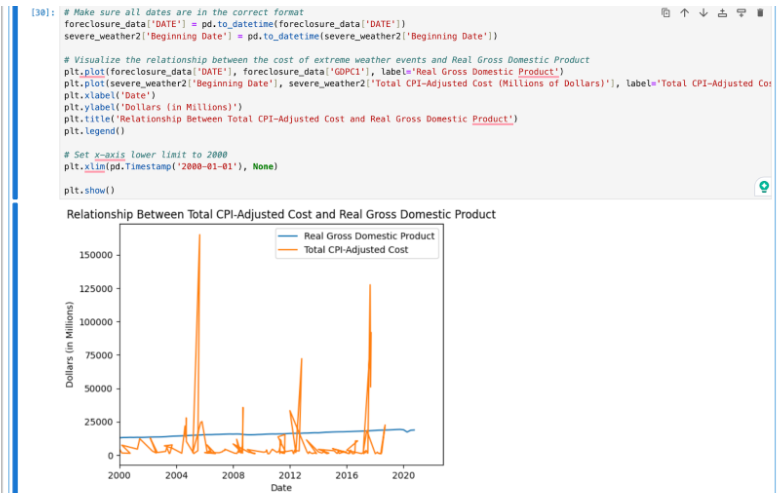
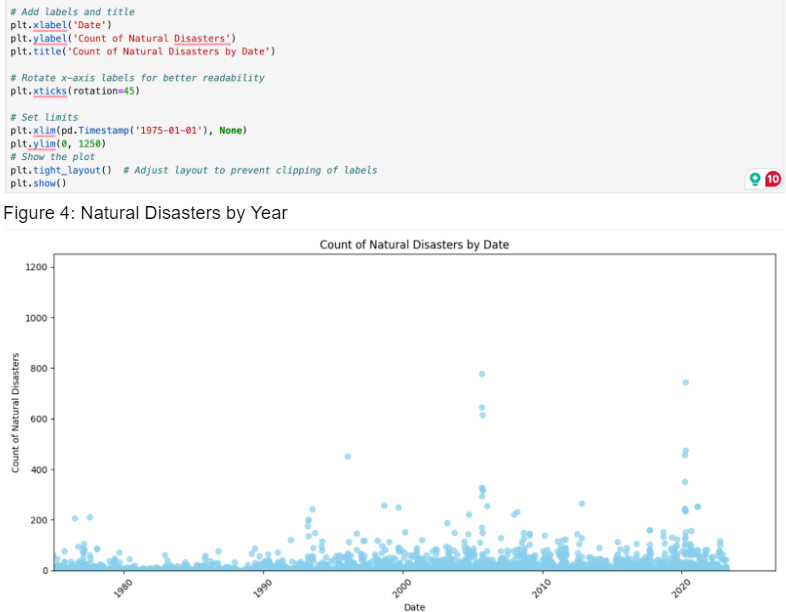
We used Jupyter to extract and visualize the data from our selected datasets. We used the Python pandas library to analyze and manipulate data. Based on our findings, we began to develop a prototype in Figma of a potential solution to customers to provide them with personalized housing and financial advice.
Challenges We Ran Into
We had to learn pandas and Jupyter from scratch, and it was rather difficult to find datasets that matched what we were looking to analyze. Also, it took a while to formulate and settle on the final project idea.
Accomplishments That We're Proud Of
We were proud that we were able to create something and brainstorm a solution to our findings. We thought all hope was lost when we did not have an idea, but we are glad we toughed it out in the end.
What We Learned
We learned that there is so much about computer science that there is to learn and be fascinated about, and this project inspired us to look more into data science and its applications in the real world. It was a lot of fun to learn how to visualize data on Jupyter with Pandas and find datasets matching the questions we wanted to answer.
What's Next for Forecasts by the Campfire
We plan to implement the application by creating a lightweight app using Python Flask. We also hope to gather more data from a wider, more diverse set of data to be able to make inferences beyond the scope of the United States of America.


Log in or sign up for Devpost to join the conversation.