-
-

logo of my project
-
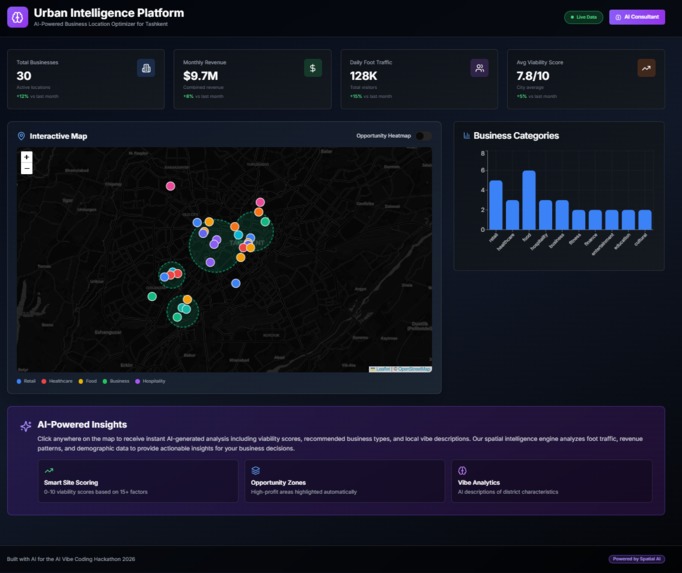
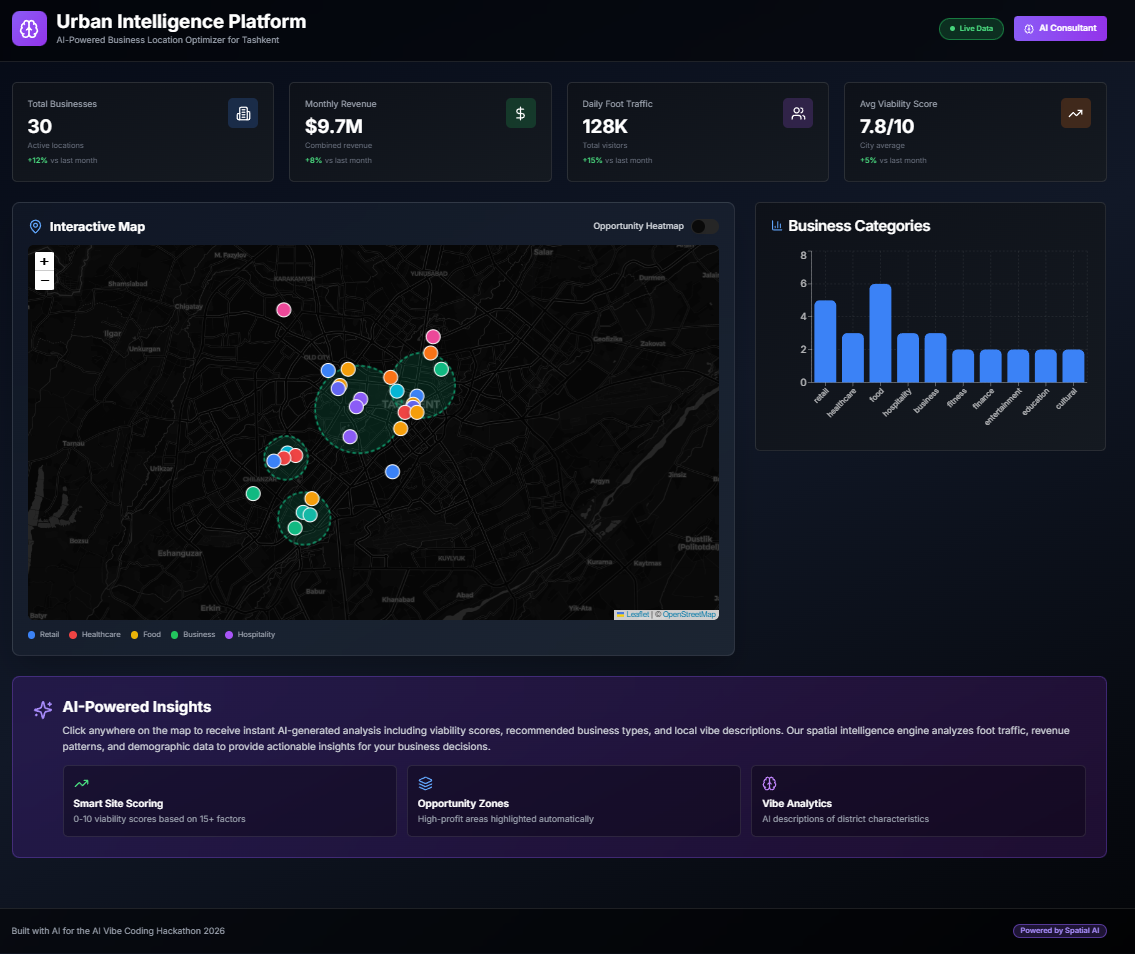
AI-Powered Urban Intelligence Dashboard for Smart City Analytics
-
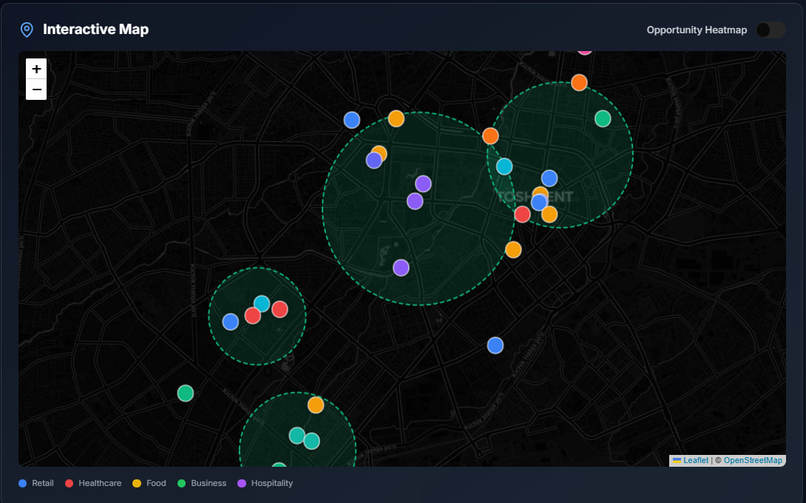
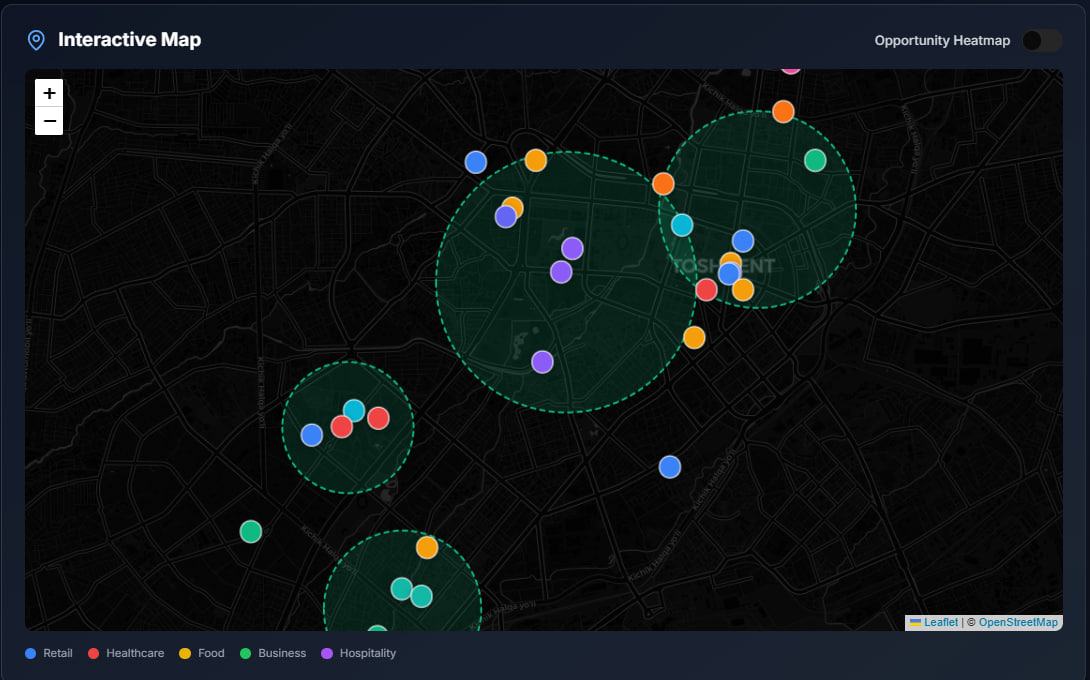
Spatial Intelligence: Dynamic Catchment Areas & Business Density Mapping.
-

AI-Powered Opportunity Heatmap: Automatically identifying high-potential gaps for new business locations
-

Smart City Command Center: Bridging the gap between big data and local business success.
-
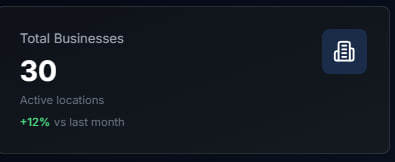
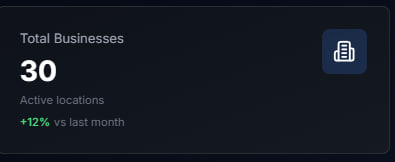
Real-time Growth Metrics: Tracking active locations and business expansion trends.
-
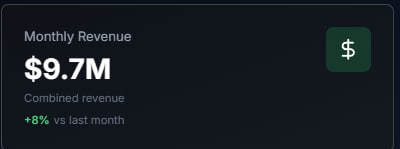
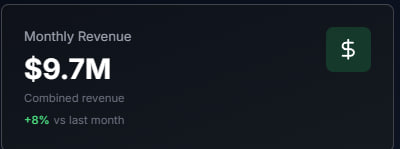
Financial Performance Tracking: Monitoring combined monthly revenue and growth trends across all urban assets.
-
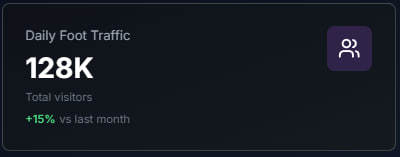
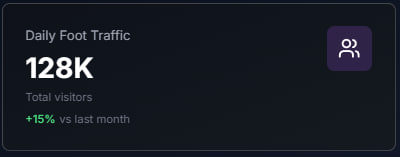
Daily Foot Traffic Analysis: Real-time monitoring of visitor density and monthly footfall trends.
-
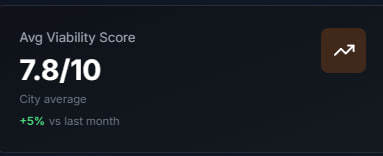
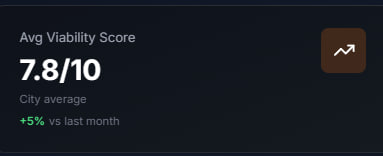
AI Viability Scoring: A data-driven success index for urban business health and location potential.
-
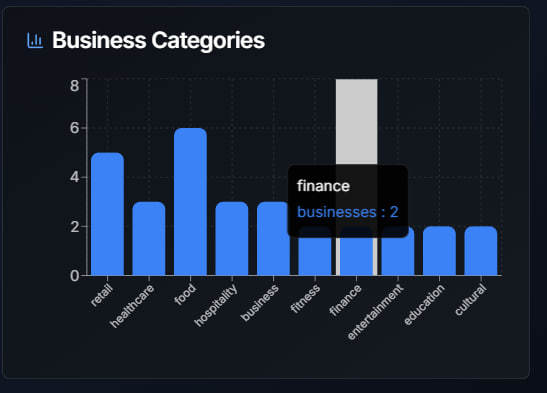
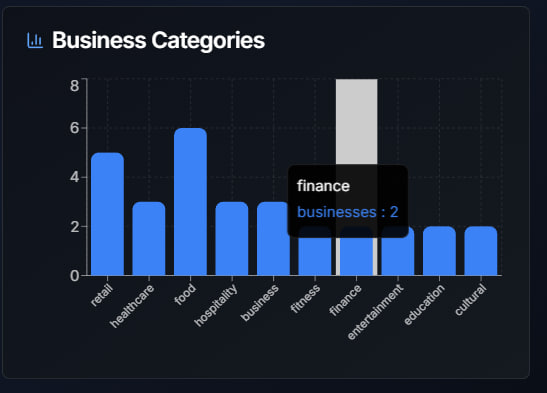
Categorical Market Distribution: Visualizing industry diversity to identify underserved urban sectors
-

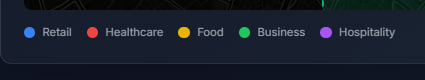
Multi-Sector Classification: Integrated tracking across Retail, Healthcare, Food, Business, and Hospitality.
-
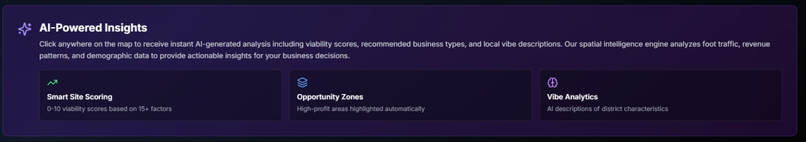
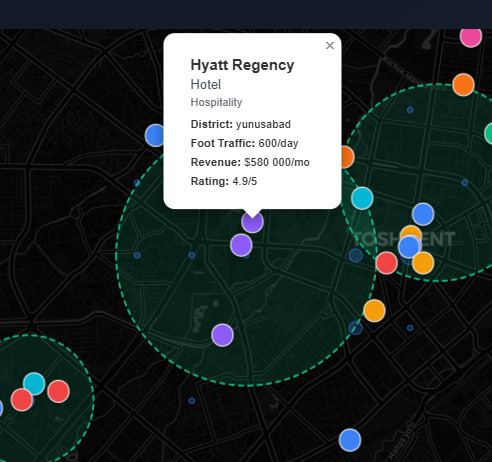
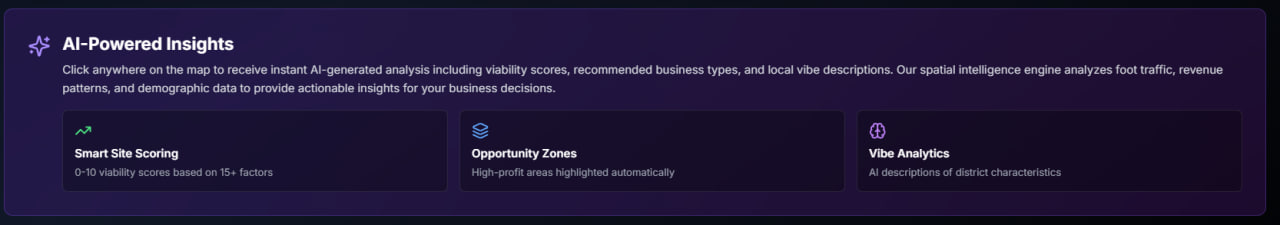
AI Intelligence Engine: Automating location analysis with Smart Site Scoring, Opportunity Zone detection, and District Vibe Analytics

💡 Inspiration
In an era of data overload, we noticed that decision-makers are often "data-rich but insight-poor." We were inspired to create a tool that provides a "Nav Drishti" (New Vision) for urban and business management, turning chaotic data streams into a clear, actionable command center.
🚀 What it does
BusinessRadar is an AI-powered operational intelligence platform. It centralizes global metrics—from revenue and logistics to energy consumption—into a high-performance dashboard. It doesn't just show what is happening; it uses predictive patterns to help leaders stay ahead of risks.
🛠️ How we built it
We used a cutting-edge web stack for maximum speed:
- React & Vite for a lightning-fast frontend.
- Tailwind CSS for a professional, responsive "Command Center" interface.
- Lucide React for intuitive iconography.
- The architecture is modular, allowing for real-time data streaming and scalability.
🧠 Challenges we faced
The biggest challenge was designing an interface that could display vast amounts of information without overwhelming the user. We solved this through careful UI/UX hierarchy and data visualization patterns.
📈 Accomplishments that we're proud of
We successfully built a fully functional, aesthetically pleasing dashboard that feels like a premium enterprise product, all within the hackathon timeframe.
🎓 What we learned
We deep-dived into real-time data visualization and learned how to optimize React components for high-density data displays.
🔮 What's next for BusinessRadar
We plan to integrate real-time AI agents that can automatically suggest operational fixes and add support for direct IoT sensor integration for smart city monitoring.
Built With
- css
- icons
- javascript
- lucide
- react
- tailwind
- vite

Log in or sign up for Devpost to join the conversation.