-
-
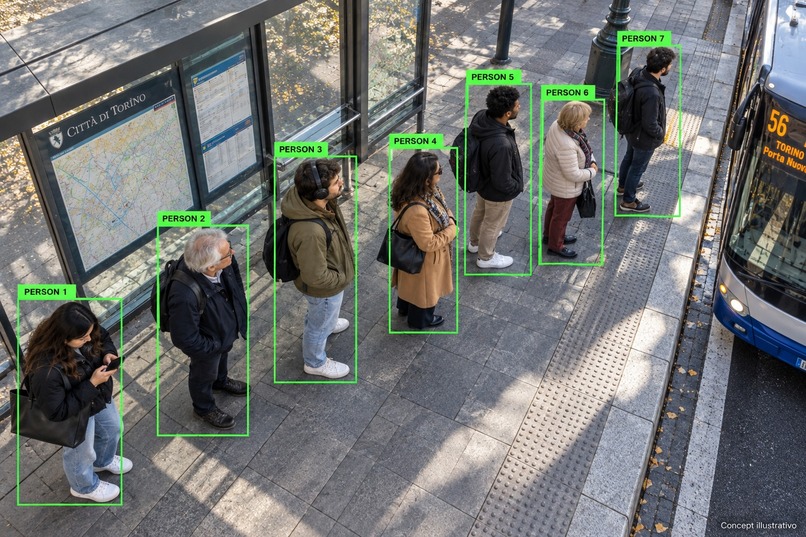
smart bus stop
-
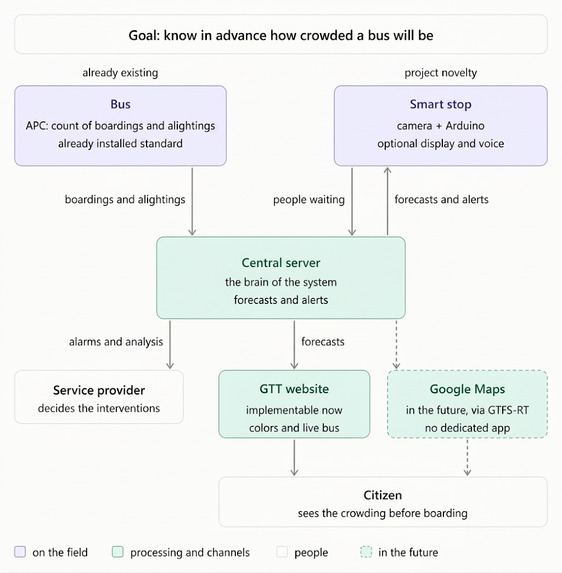
info1
-
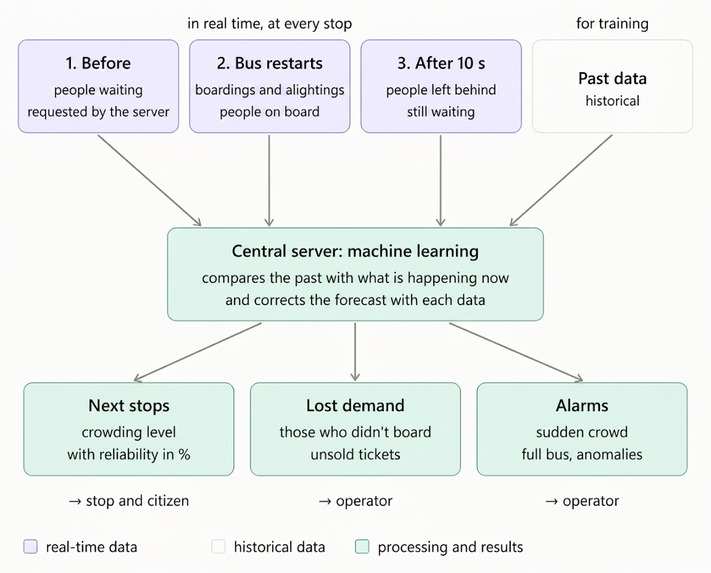
info2
-
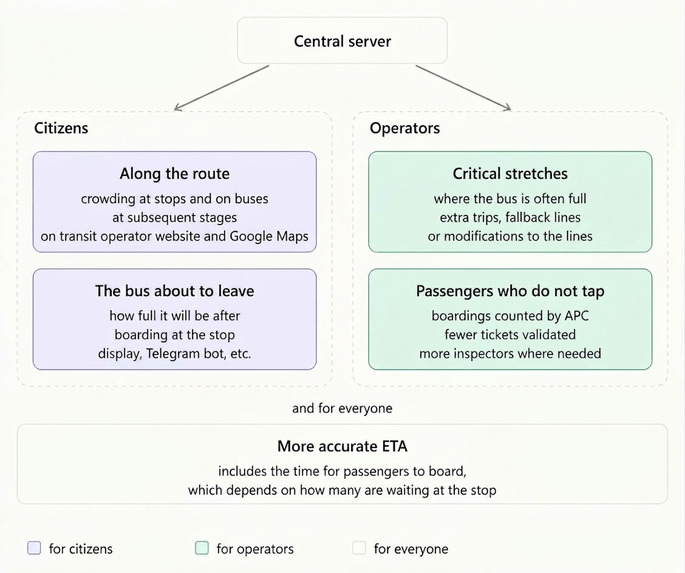
info3
-
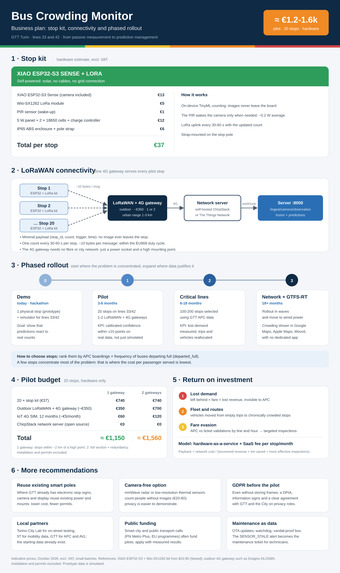
business plan
-
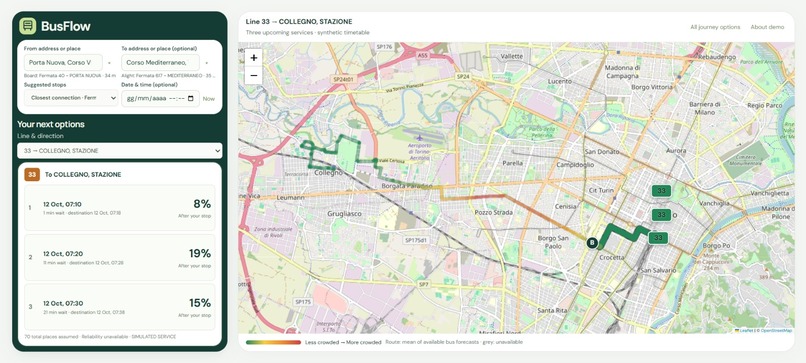
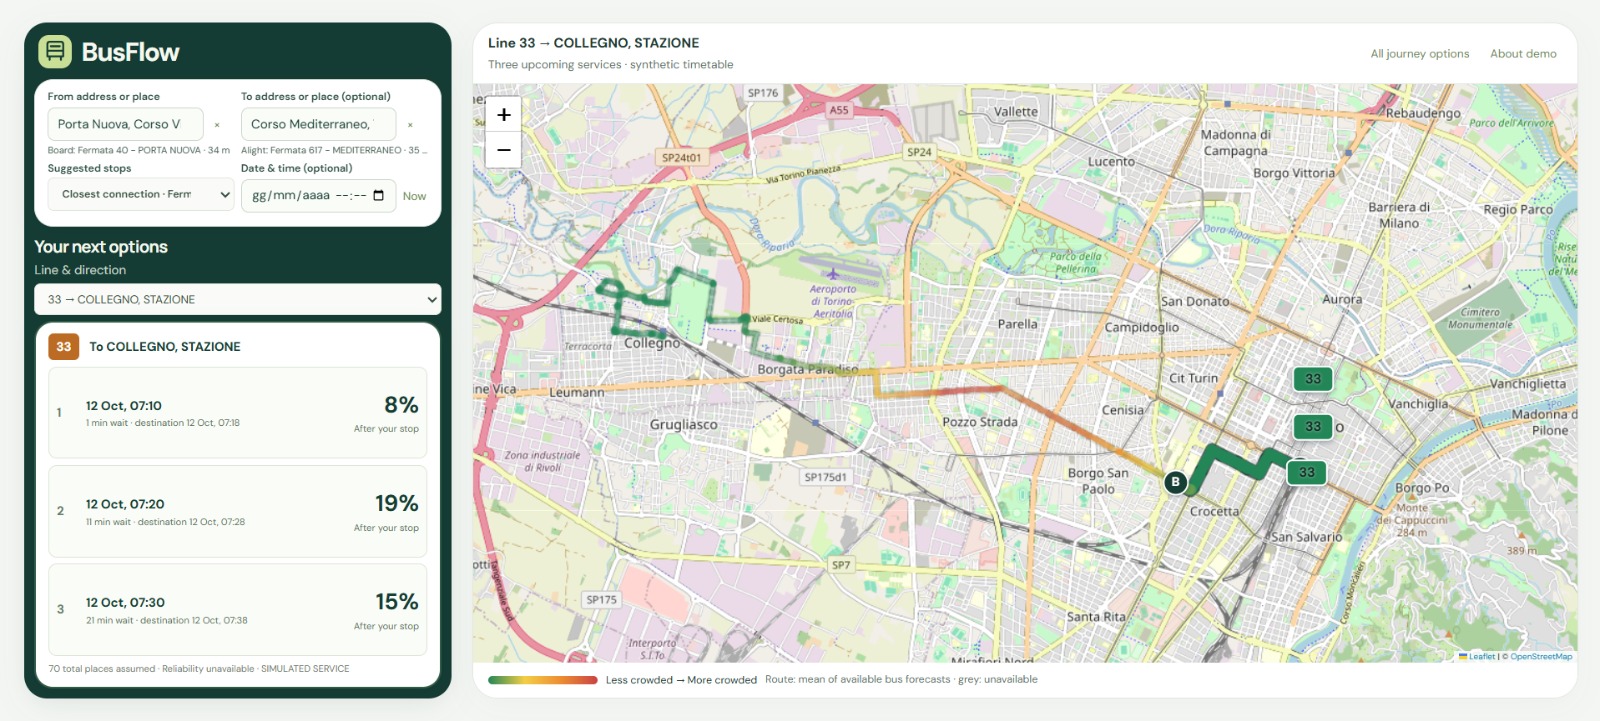
web-app interface. Less crowd is green, more crowd is red
-
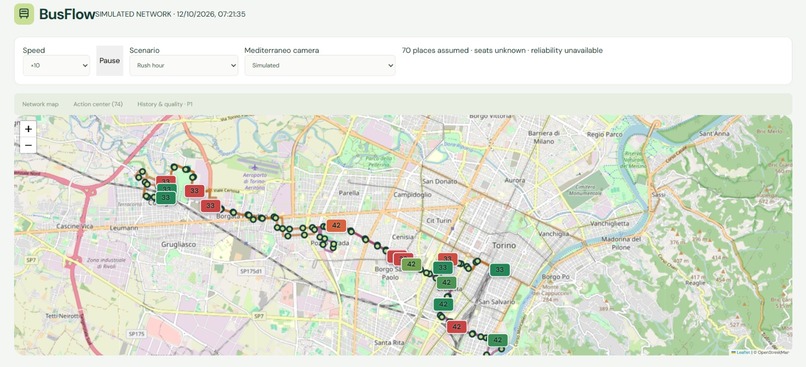
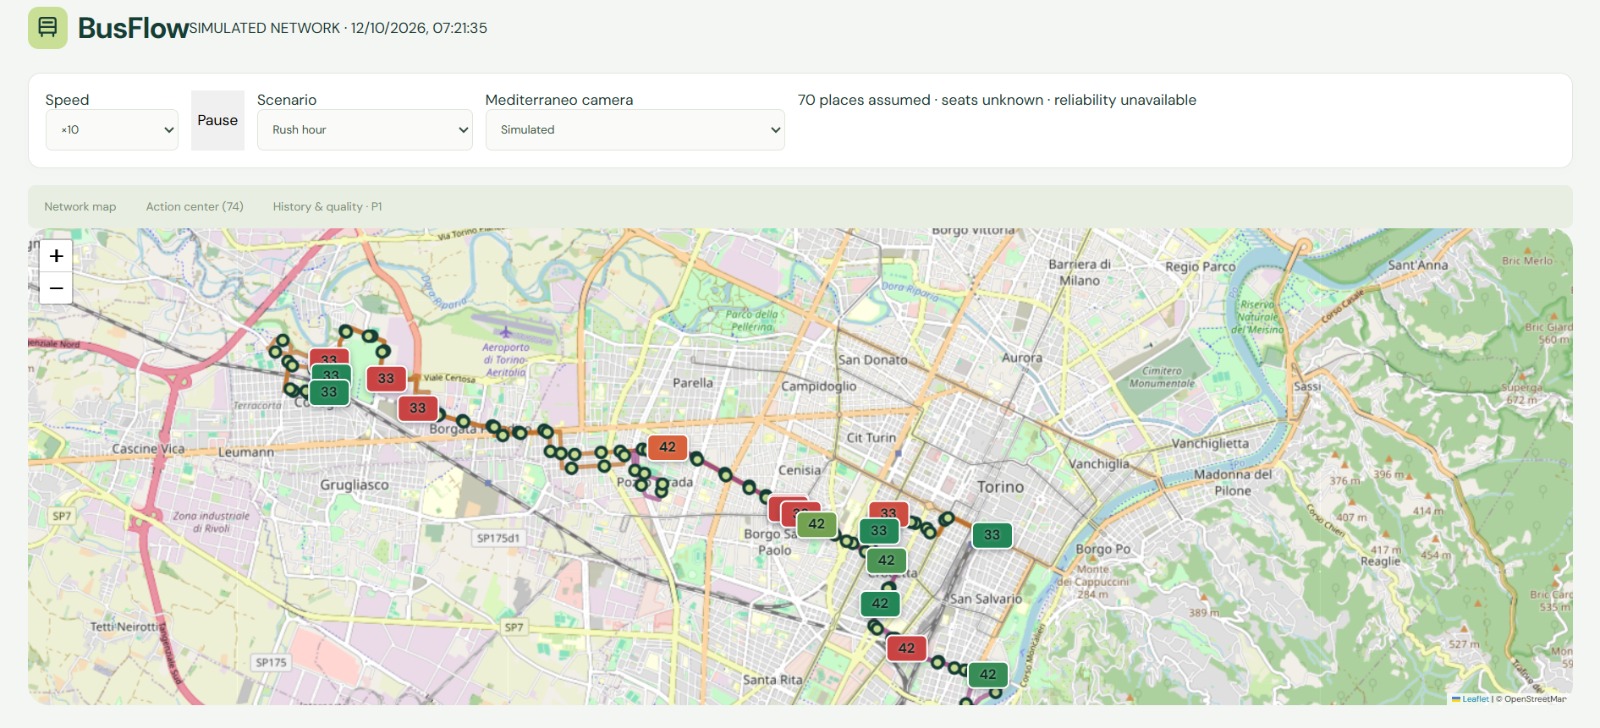
web app and simulator
Inspiration
A bus can report how many people boarded, but not how many were unable to get on.
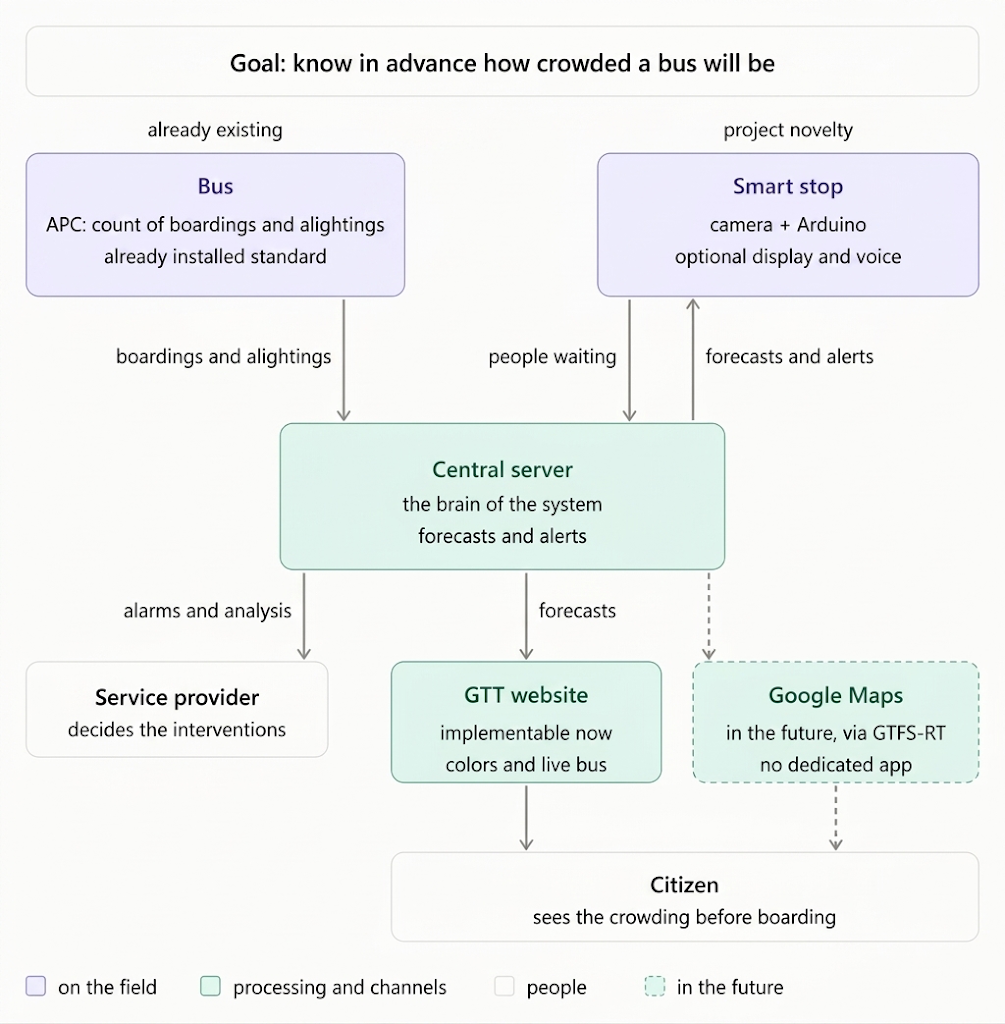
That blind spot inspired Bus Crowding Monitor. Onboard passenger counters describe what happens inside the vehicle; smart bus stops add the missing picture of demand outside it. Together, they can help transport operators anticipate overcrowding and understand where service falls short.
We focused our prototype on Turin’s GTT lines 33 and 42.
What it does
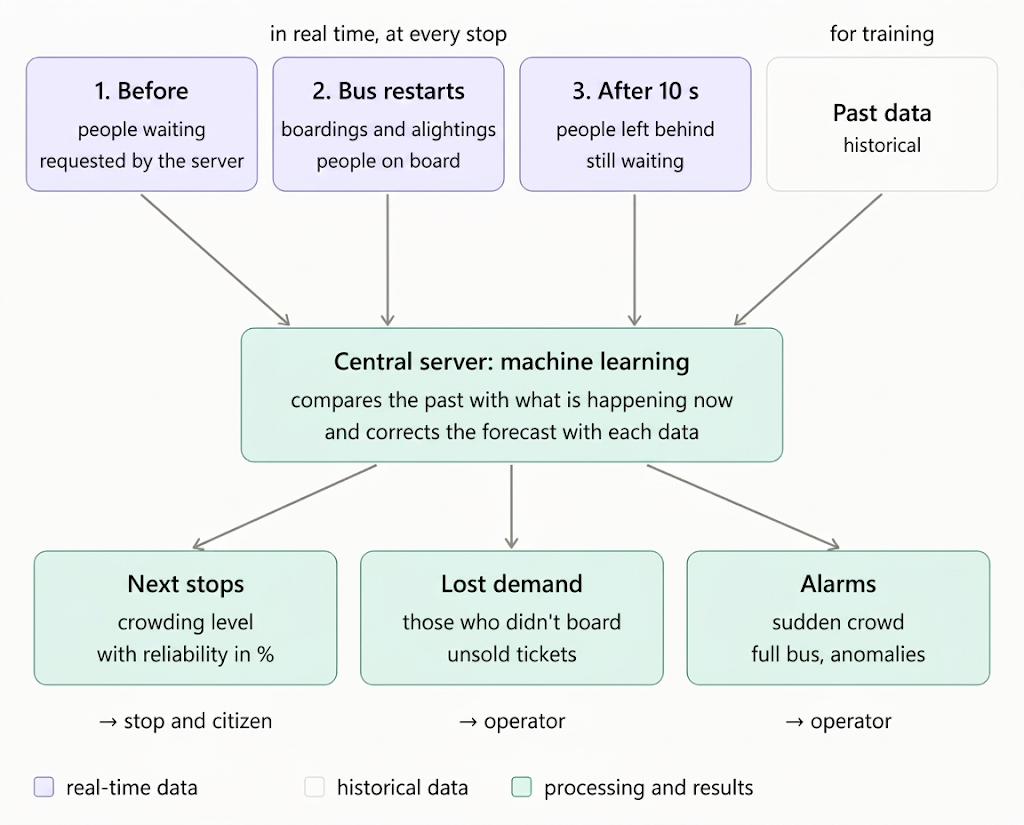
Bus Crowding Monitor combines onboard passenger counts, stop observations and historical patterns to estimate crowding on upcoming buses and along their routes.
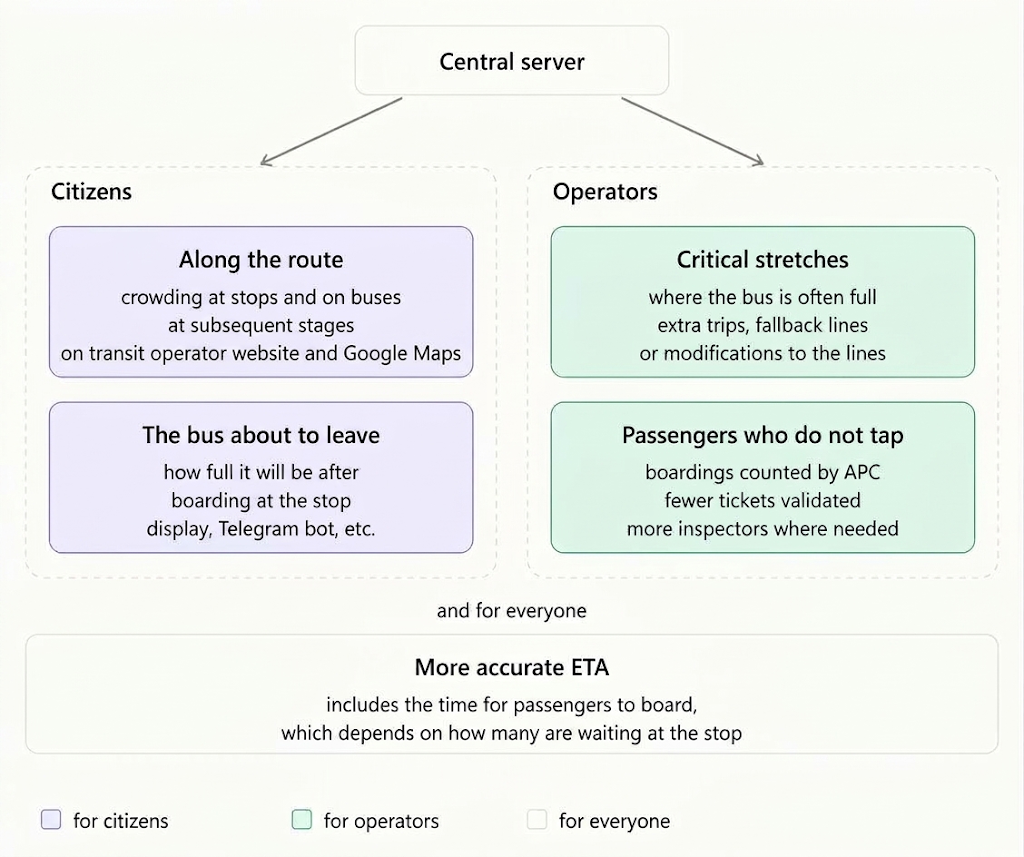
The operator interface brings buses, stops and crowding information onto a map, helping users identify critical situations. The passenger interface explores how the same information can support journey planning.
A key goal is to estimate unserved demand: people who remain at a stop after a crowded bus departs. These observations can help operators identify recurring capacity shortages and make better-informed service decisions.
How we built it
We developed the frontend with React, TypeScript, Vite and Leaflet. The backend uses Python, FastAPI, Pydantic and SQLite through SQLAlchemy.
The prototype uses a controlled simulation of buses, passenger arrivals and sensor observations. This lets us explore normal service, rush-hour demand and overcrowding without requiring access to a live fleet.
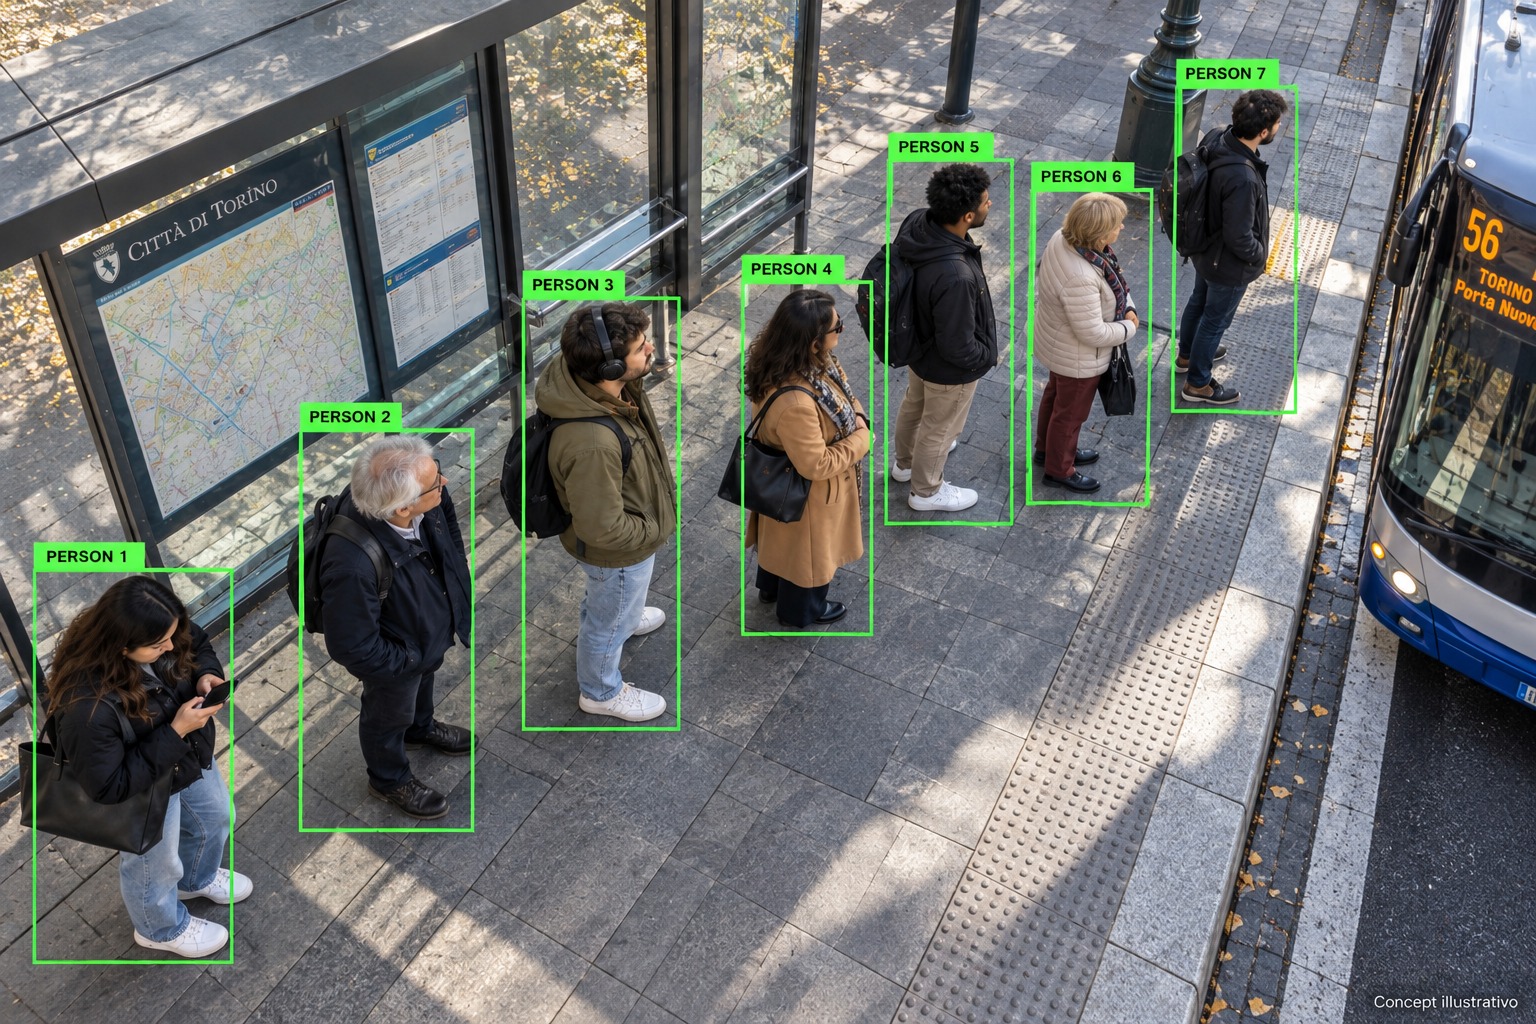
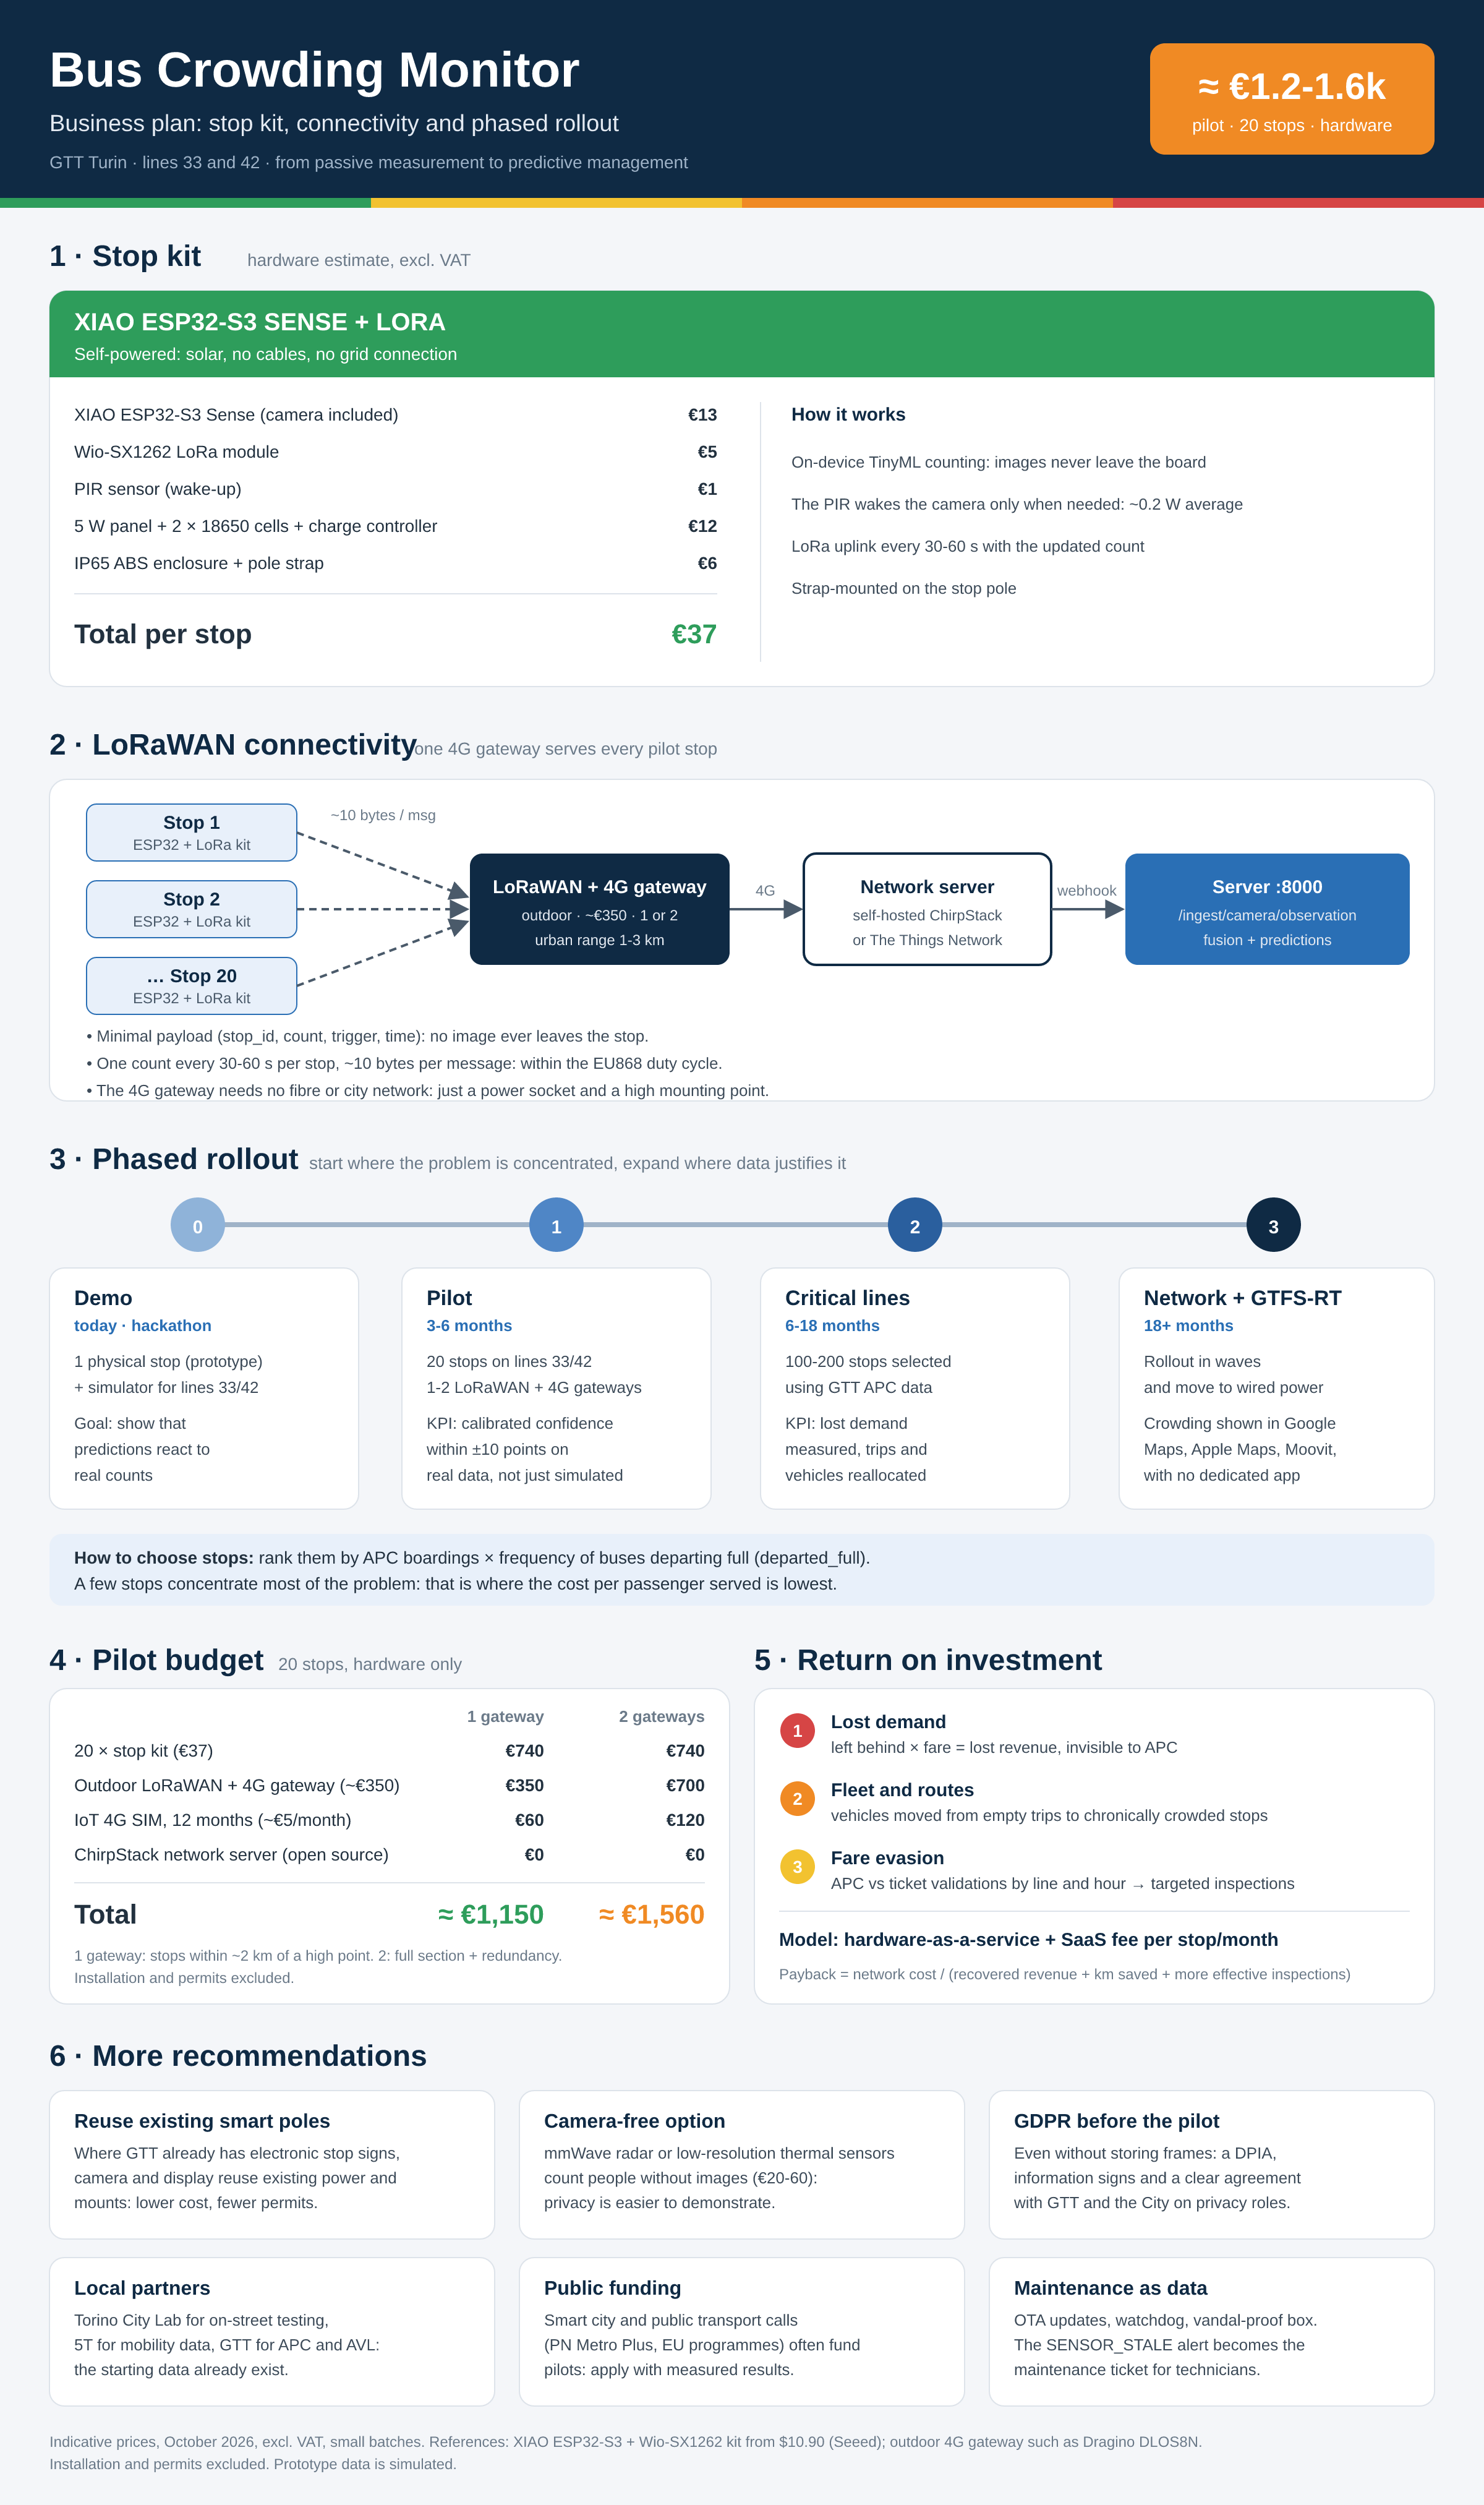
The hardware integration is designed around an Arduino UNO Q smart stop, providing a path for replacing a simulated camera observation with a physical people count. The intended approach processes images locally and sends numerical counts rather than video.
Challenges we faced
Counting people at a stop is not the same as knowing how many will board the next bus. Some people are passing by, and passengers at shared stops may be waiting for different lines.
Another challenge is uncertainty. Sensor readings can be noisy or outdated, and historical averages cannot fully describe a sudden crowd. We designed the system to distinguish observations from predictions and to treat missing information as unavailable rather than as zero.
We also needed a convincing demonstration within the hackathon’s constraints. Simulation made different demand conditions reproducible while keeping synthetic data explicitly labelled.
Accomplishments that we're proud of
We brought passenger needs and operator decisions into the same project, with a shared approach to crowding information.
Our main contribution is the connection between onboard occupancy and demand at stops. It shifts the focus from simply counting passengers to understanding who may be left behind and where additional capacity could help.
What we learned
Crowding is a problem of both supply and demand. Knowing how full a bus is becomes much more useful when combined with information about the people waiting downstream.
We also learned that presenting uncertainty clearly is as important as producing a prediction. A useful system must communicate what it knows, where the information comes from and when it needs an update.
What's next
Our next step is to validate the physical counting system and crowding predictions with real observations, then measure and calibrate prediction reliability.
Future development could include broader route coverage, historical analytics for service planning and integration with existing passenger information platforms through GTFS-Realtime.
The current prototype demonstrates the approach using simulated data; it does not claim validated real-world prediction accuracy.
Built With
- arduino
- fastapi
- leaflet.js
- numpy
- pydantic
- python
- react
- sqlalchemy
- sqlite
- typescript
- uno
- vite

Log in or sign up for Devpost to join the conversation.