Our project’s focus shifted greatly over the course of the weekend! We began with two disparate ideas. The first involved the possibility of creating something to allow bus users to find more robust information than simple bus arrival time at their stop. Some of that information could be how crowded the bus is, or more importantly for cyclists, how full the bike racks are on the bus.
Another idea involved discovering details about the fuel economy of the bus fleet. This idea progressed over the course of the day, and we envisioned it as a product that could be useful mainly for transportation planners, but also available for members of the public who are curious about the environmental impact of their transportation choices. We learned that the buses currently can record the instant miles per gallon used over the course of the day, but this information is not being downloaded in a digital format. Engineers keep some of this information in hard copy, but the information needs to be saved to a database that will allow further analysis. For example, current VTA reports estimate that diesel costs were over $14,000,000 last year. There is great potential for cost savings if the fuel usage is analyzed more closely.
What we finally determined would be our “product” is an analysis of what’s available in the current data published in real-time by AmigoCloud, 511, and TransLoc, as well as static data from VTA. Our goal was to agglomerate this information into a feed that would be easy for others to use in their products. We also hope that this will encourage VTA to look at the data they release and make sure it’s formatted into simple yet usable forms.
Target audience: producers of other apps—out hope is that we’re making the available data easier for others to use.
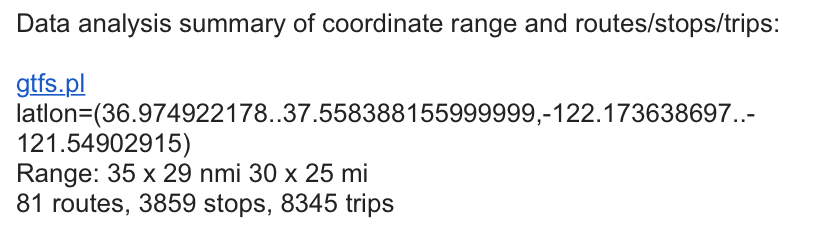
Data and APIs use: AmigoCloud has realtime lat/lon and speed and unknown ID for certain number of buses. Unsure which lines/buses these are—ID number is for radio on the bus. 511 has train lines 901 and 902 (only) and only predicted arrival times—no location. TransLoc has realtime speed for light rail (locations) as well as predicted arrival times. VTA’s GTFS has trip IDs, route IDs—pulling out that data to give to other teams. TransLoc and AmigoCloud data comes in every few seconds. 511 is older location tracking equipment—90 second updates.
Data we will generate: Using the data and APIs listed above, we hope to determine at which stops buses are located, and with that, we can determine which lines they’re on. We also are seeking to reprocessing/reformatting data for others to use.
How our submission will improve transportation and engage people: We believe that our work helps to show that creating more robust data feeds for the public could lead to increased opportunity for others to develop unique ways to analyze and utilize this data.
How would our submission evolve in the future, what would we need to get there:
- ridership statistics per stop/per route. Arrival time, boardings, alightings. This would allow us to compute a histogram of arrivals/ridership and calculate summary statistics for arrivals. This could allow correlation of traffic congestion with schedule delays for better prediction.
- one unified API – would be good to know the bike rack occupancy information. It’s a determining factor for cyclists. Would like the real time statistics for ridership/crowding.
- fuel consumption (data isn’t available publicly, but is saved by maintenance teams) make route-by-route observations.

Log in or sign up for Devpost to join the conversation.