-
Home page
-
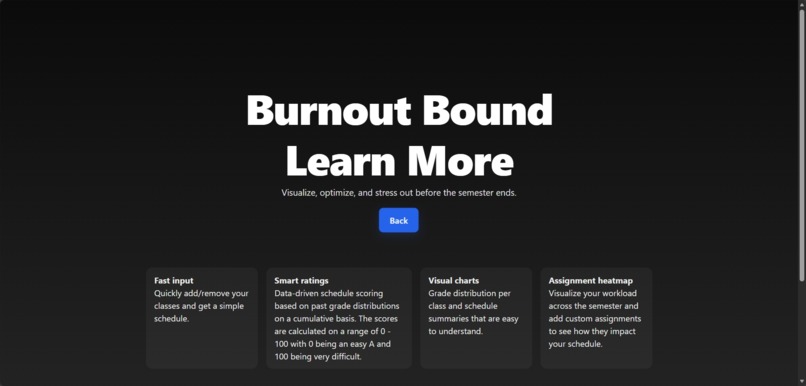
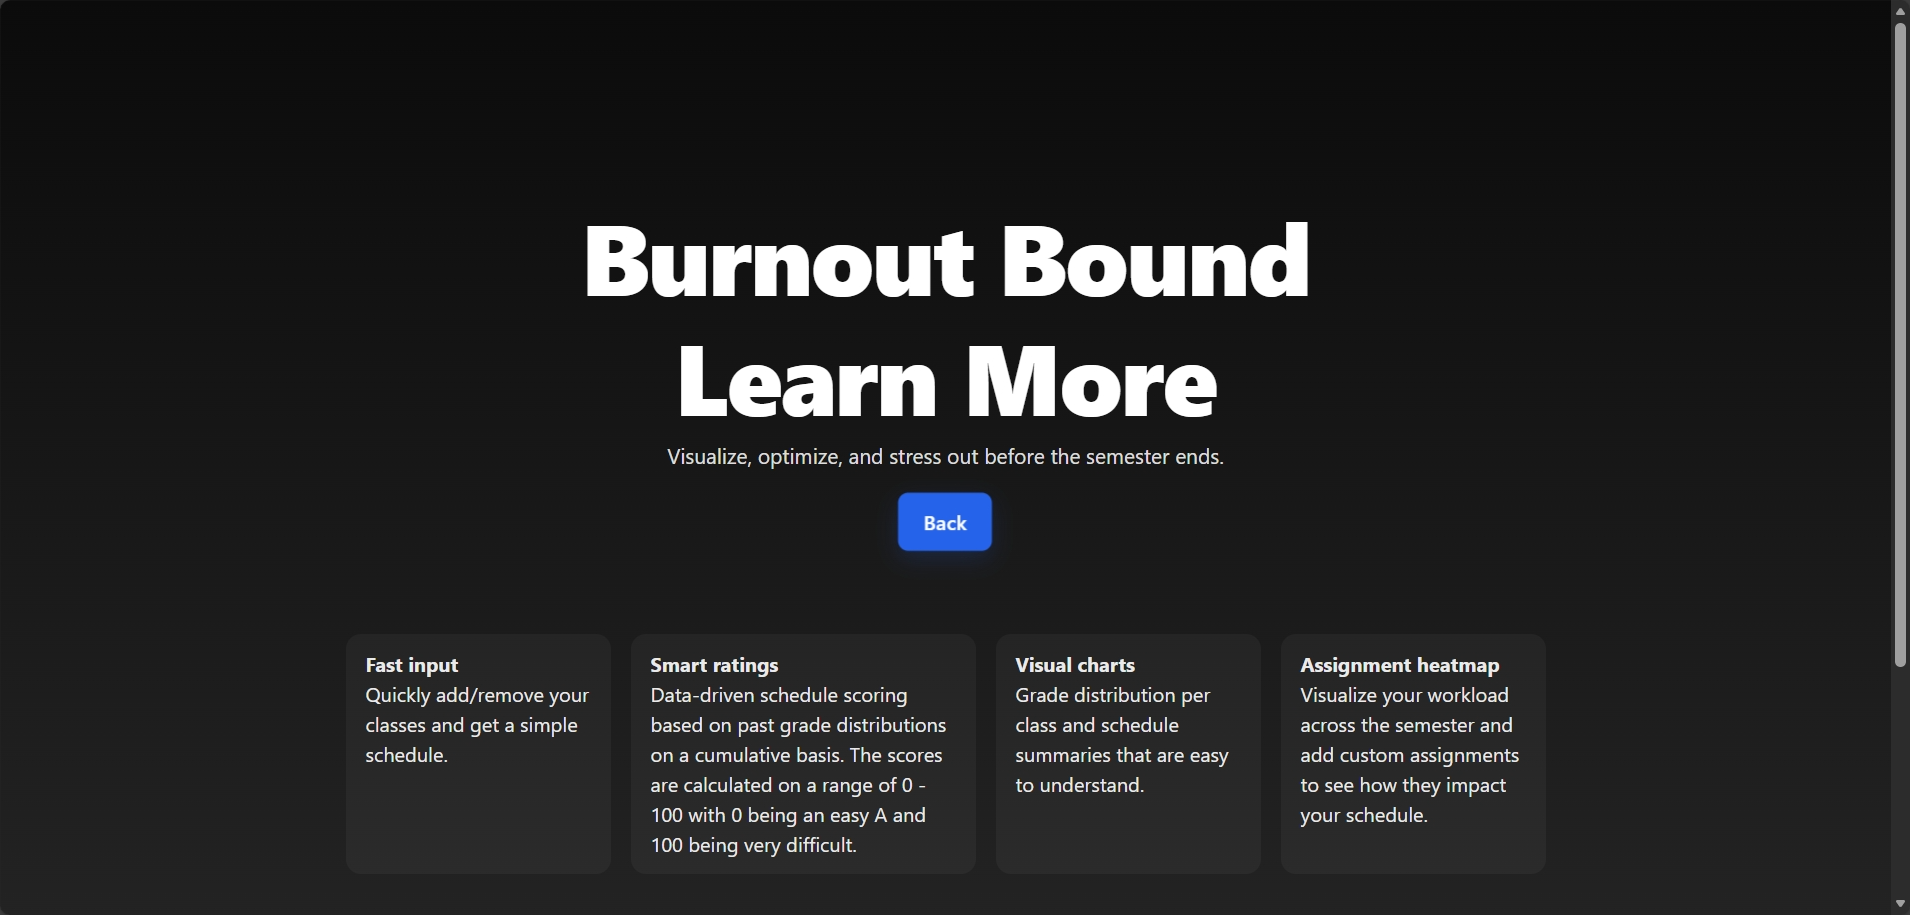
Learn more page
-

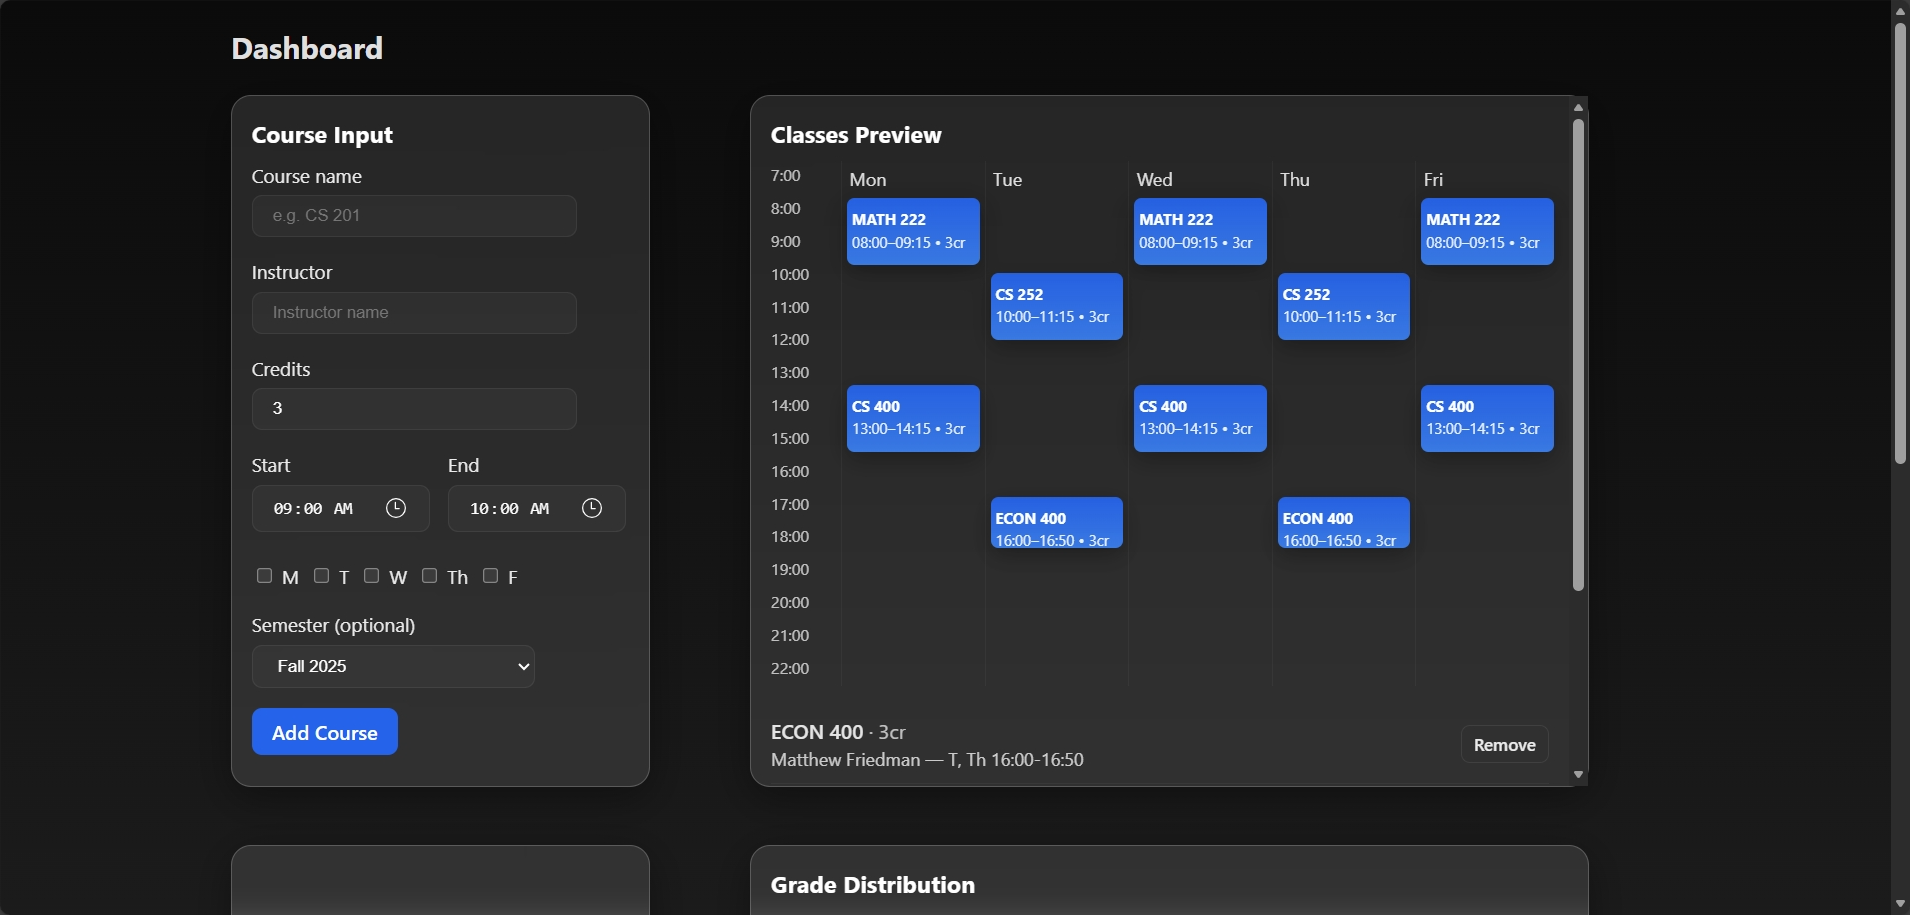
Typical schedule in the schedule previewer
-

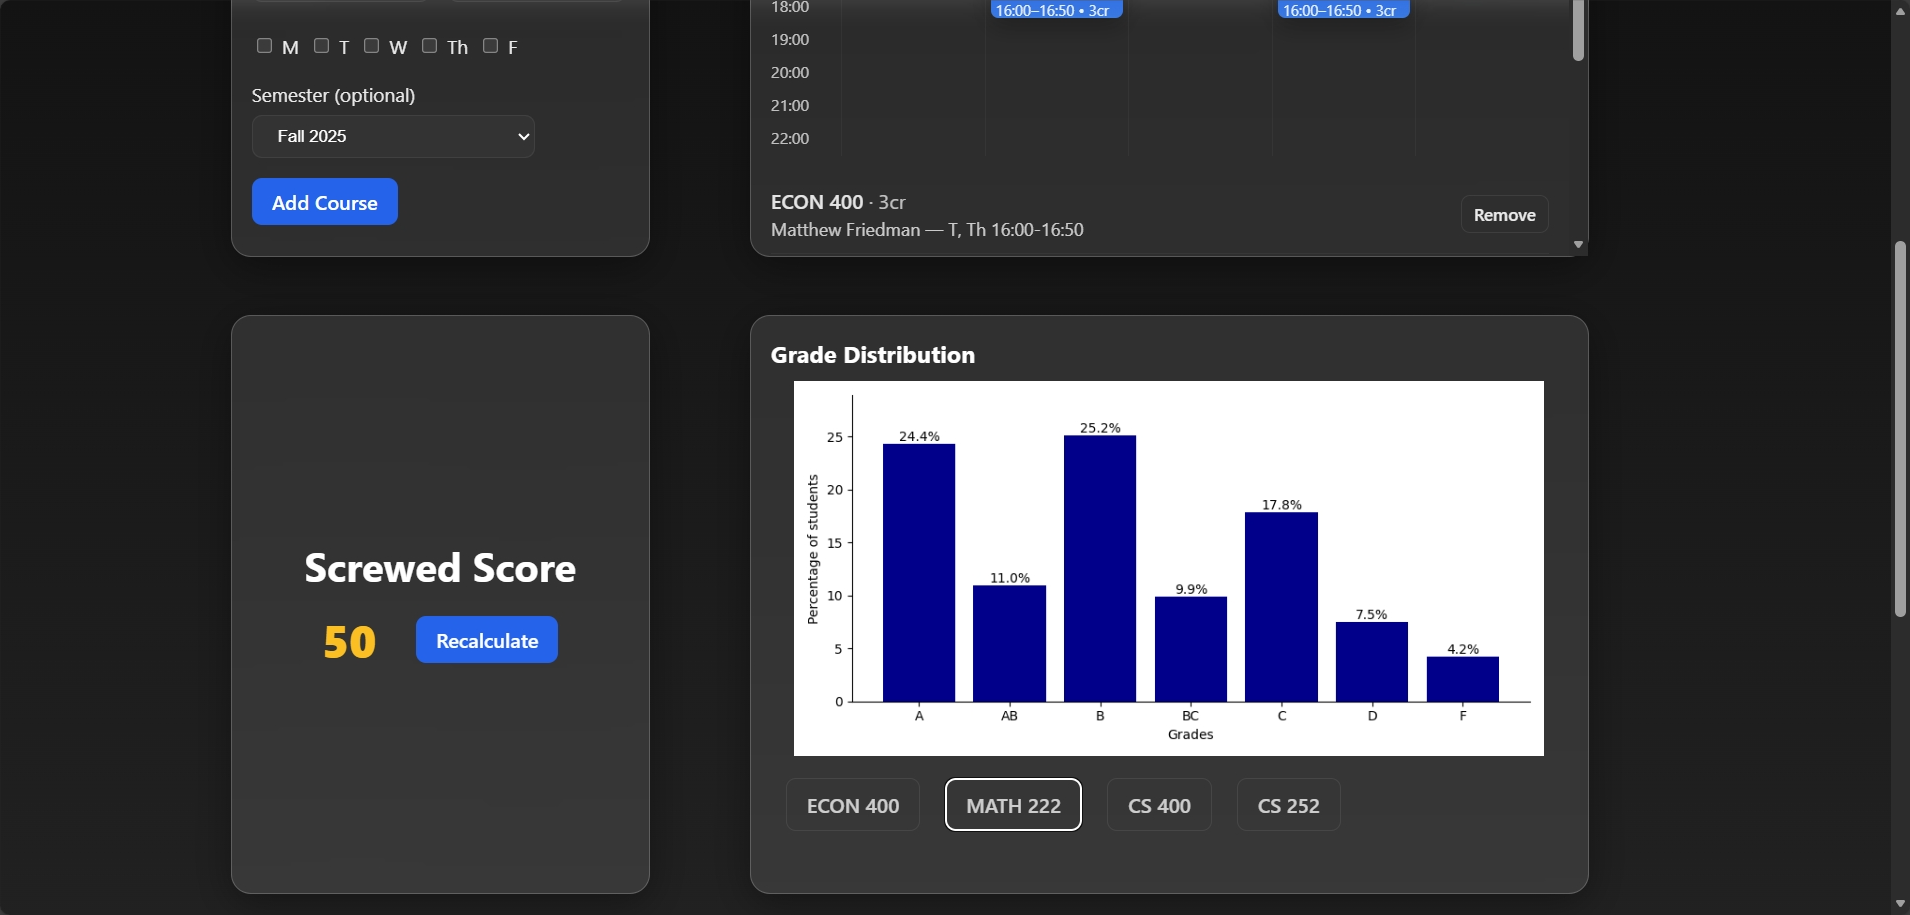
Typical schedule score and grade distribution graphs
-

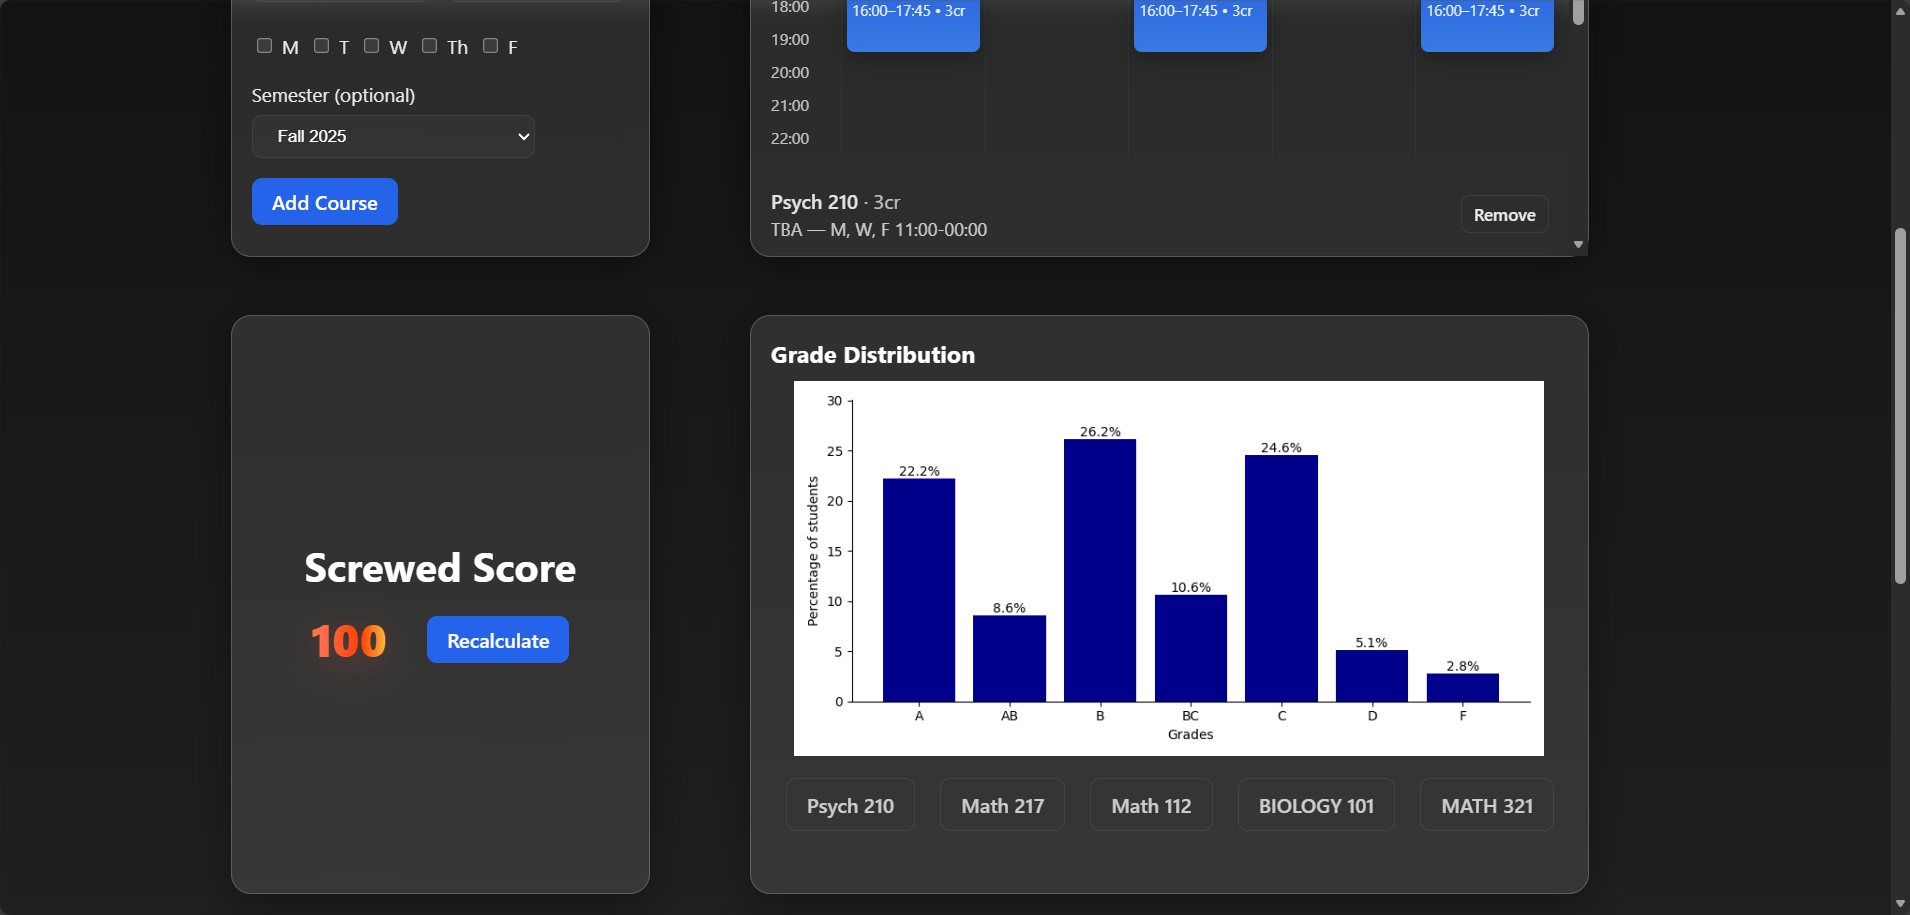
Worst possible Screwed Score
-

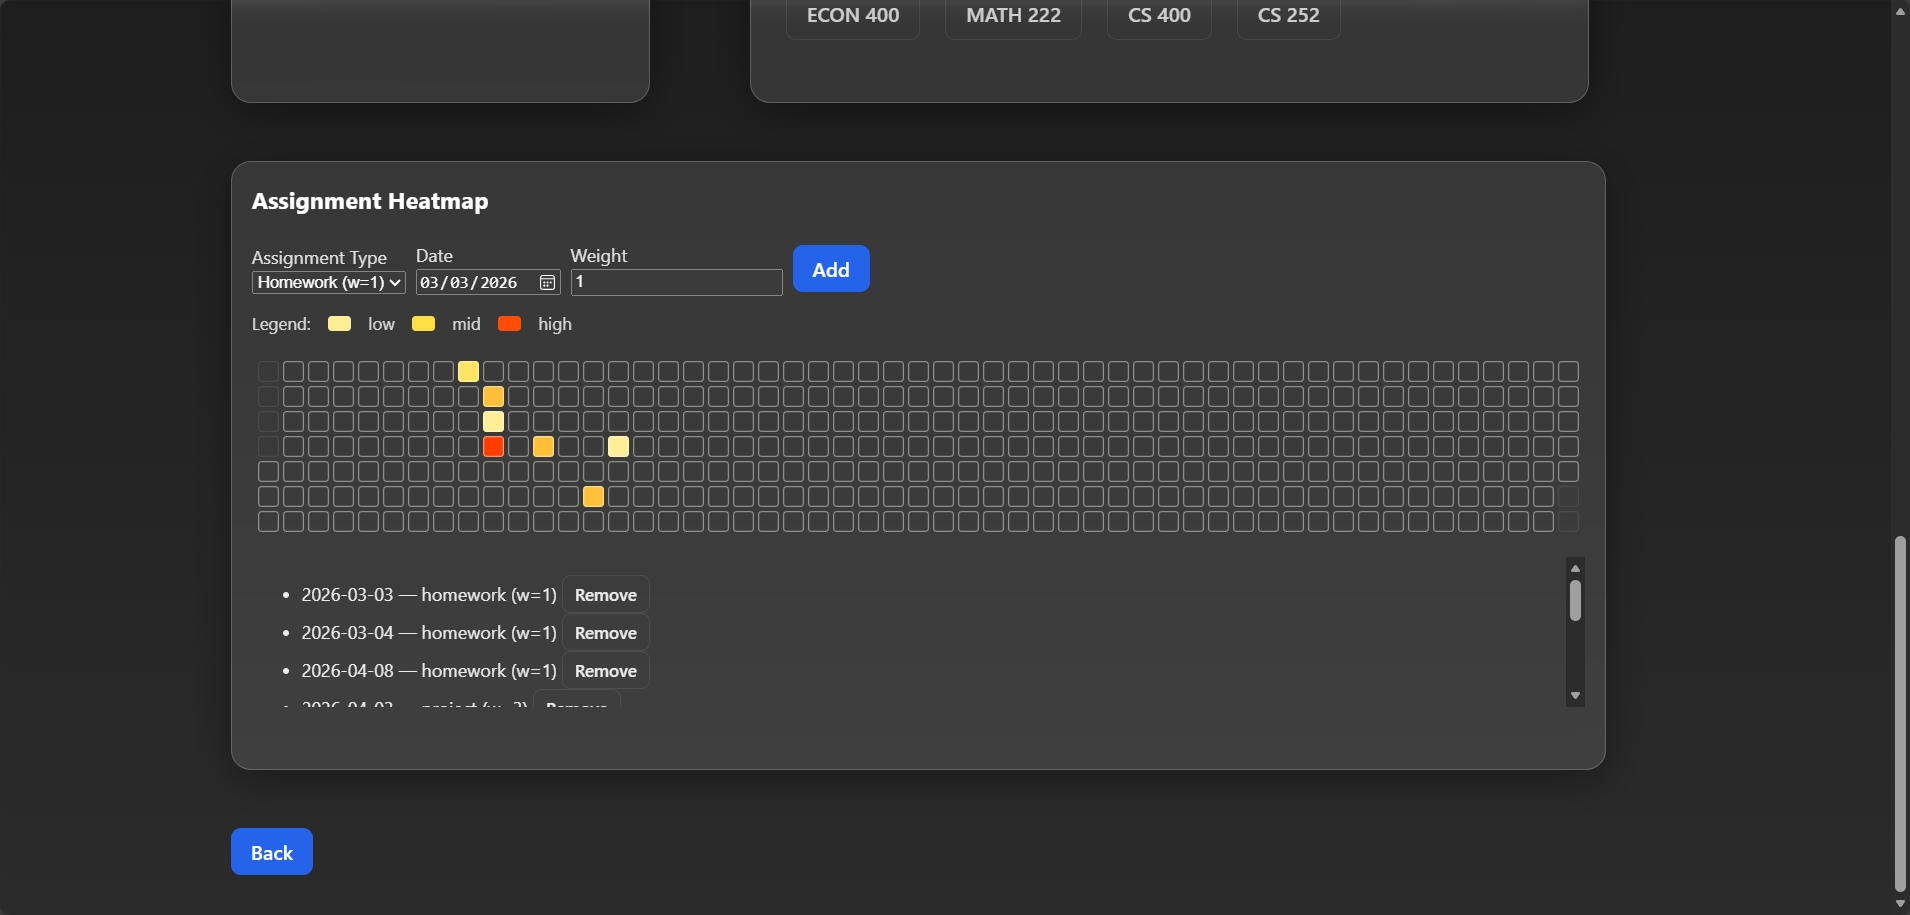
Assignment heatmap example

Burnout Bound helps students visualize their schedules and assignments during the semester. Burnout Bound also gives students a tool to evaluate potential stress points in a semester and potential stressful class schedules based on our state-of-the-art Screwed Score.
Inspiration
- We realized that class enrollment is a very stressful time of the semester, and students often enroll without taking into account class balance and mental health consequences
- We wanted to help students manage their classes in a unique and fun way
- We decided to help students by creating an all-in-one platform for evaluating schedule difficulty using our Screwed Score
- We wanted to increase student awareness of online tools used for class enrollment an provide a one-stop-shop for managing stress levels during the school year
What it does
Burnout Bound allows users to input their class schedule and see a quick visual of their classes. We then take the user's input and call the Madgrades API to retrieve grade distribution data for their classes. We then take that data and create grade distribution graphs locally and individually for each class and allow the user to toggle between them. We also calculate our Screwed Score that measures the difficulty and time commitment of the class schedule by weighing the classes average gpa by its number of credits and then factoring by the average number of credits taken by a UW-Madison student in one semester. Lastly, we also provide an assignment/exam heatmap that allows users to input their assignments and their due dates and generates a heatmap showing them potential very stressful days in their semester.
How we built it
- First we get input for the user's classes, which involves the class name, instructor name, number of credits, class days, class times, and optionally the semester.
- Next we take all the input data and call the Madgrades API to aggregate all the class data in order to get the cumulative grade distributions for each of the user's classes.
- We output the user's classes onto a simple calendar for visualization. The user is able to remove any added classes as well (any removed classes will not be taken into account when calculating the Screwed Score).
- Once the user hits the Recalculate button, we take the data obtained from Madgrades and compute a Screwed Score for the user based on their current classes on a scale of 0 - 100 (0 is an easy A and 100 is very difficult). This score is calculated using each class's difficulty (grade distribution) weighted by its number of credits. We then take the sum of the weighted class difficulties and divide it by the average amount of credits taken by a student each semester at UW-Madison.
- We then print the graphs of each class's cumulative grade distribution and allow the user to toggle between which one is shown. We calculate the distributions locally as we drop all incomplete grades.
- Lastly, we provide an interactive heatmap where users can enter assignments and identify stressful points in the semester. This is done through assigning different weights for different assignments and uses a color gradient from tan to red to reflect difficult days with many assignments due.
Tech Stack
Backend
- Flask API to locally run our server
- Used Madgrades API to retrieve grade distribution data
- Used pandas, numpy, matplotlib, and seaborn for server-side graph generation
- Runs in a Python virtual environment
- The heatmap and schedule preview are client-side components, and assignment data is stored locally
- We used GitHub Copilot in VSCode to help generate framework code and stylesheets recommendations
Frontend
- React (JSX) + Vite
- Used Tailwind and custom CSS styles
- Ran locally using npm/Node as a Vite dev server
Challenges we ran into
- Frontend and backend integration
- How to effectively make API calls
- Refining the Screwed Score calculation
- How to render graphs to the user
Accomplishments that we're proud of
- We were able to work together as a team and successfully integrate the frontend and backend
- We successfully implemented a project from concept to implementation in 24 hours
- We made something cool and fun that is also helpful for students
What we learned
- How to work as a team on both frontend, backend, and integration
- How to use API calls effectively
- How to build a professional looking GUI
- How to use React + Vite locally to render UI's and how to run local python servers to call methods
- How to properly use Git for version control and workflows
- Designing a rating function that effectively all possible input values based on many different data points
What's next for Burnout Bound
- We want to add more functionalites to the user inputs to help users more easily enter their class information
- We want to automate assignment/exam entry for our heatmap by parsing syllabi for assignments and due dates
- We want to include more graph customization like distribution graphs for specific instructors or certain semesters
- We could refine our function to calculate our Screwed Score to include professor ratings, degree requirements, how spread out classes are, and traveling distances between classes
- We also want to add something to help with stress during the semester like a time management system through our app
- Since the app is being hosted locally right now, we want to fully launch it as a web app to everyone in the future


Log in or sign up for Devpost to join the conversation.