-
-
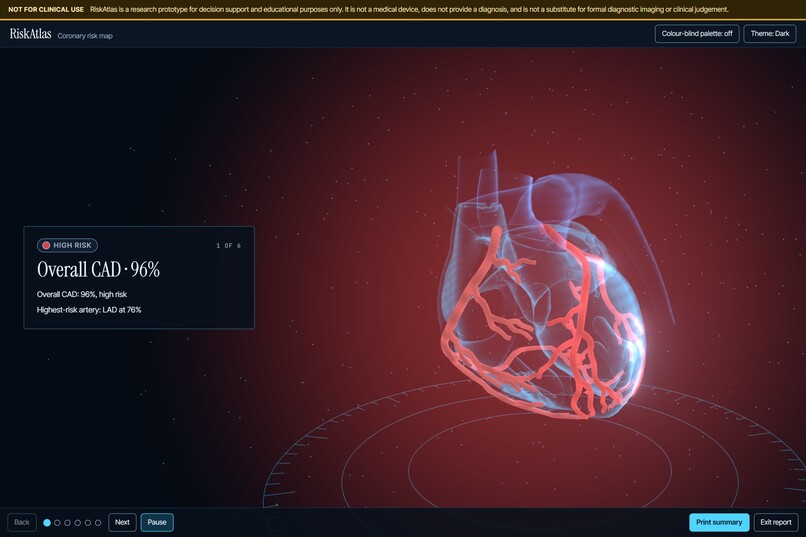
Guided report
-
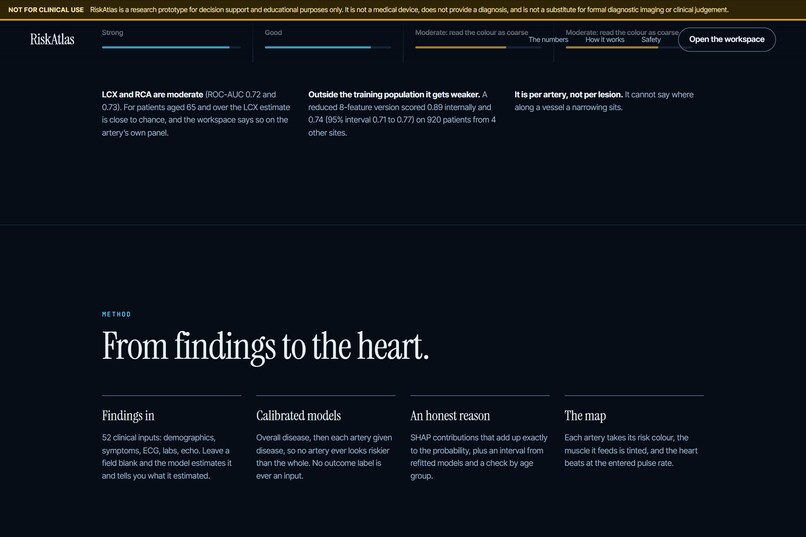
How it works
-
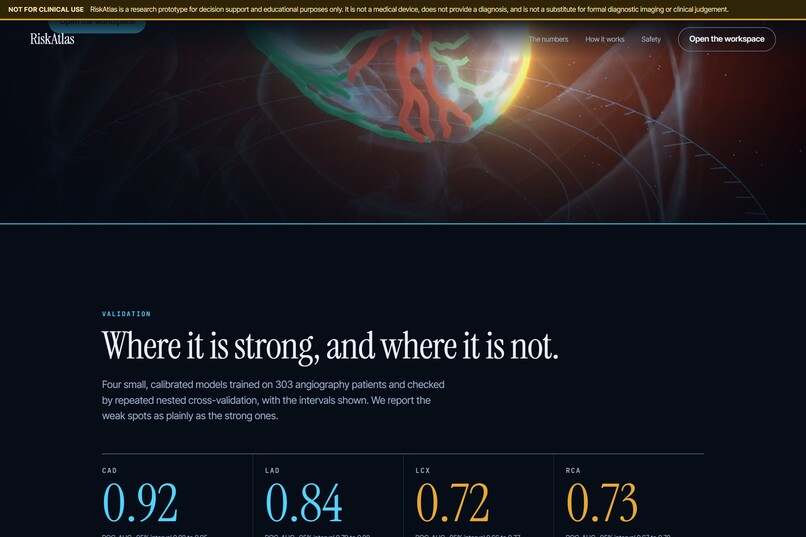
Validation results
-
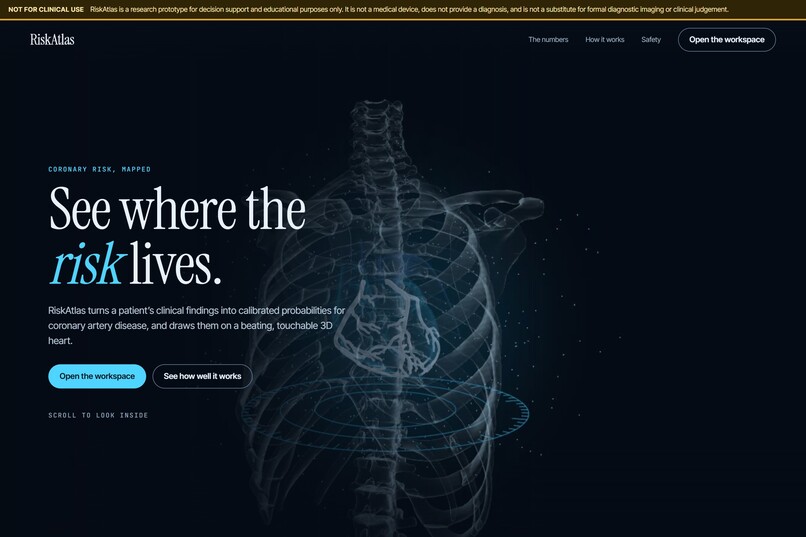
Landing page
-
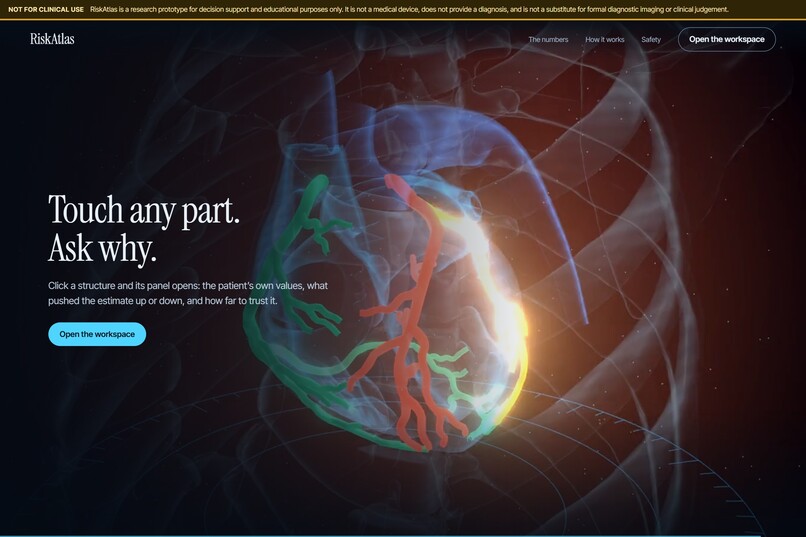
Three arteries
-
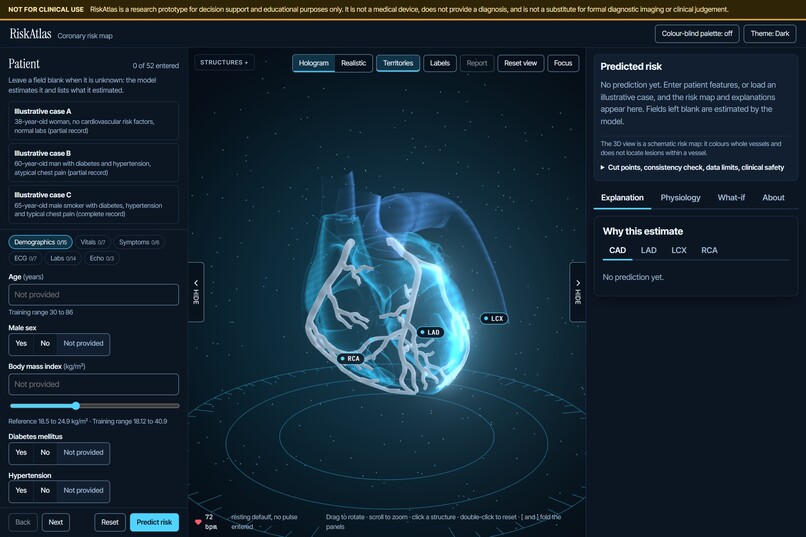
Empty workspace
-
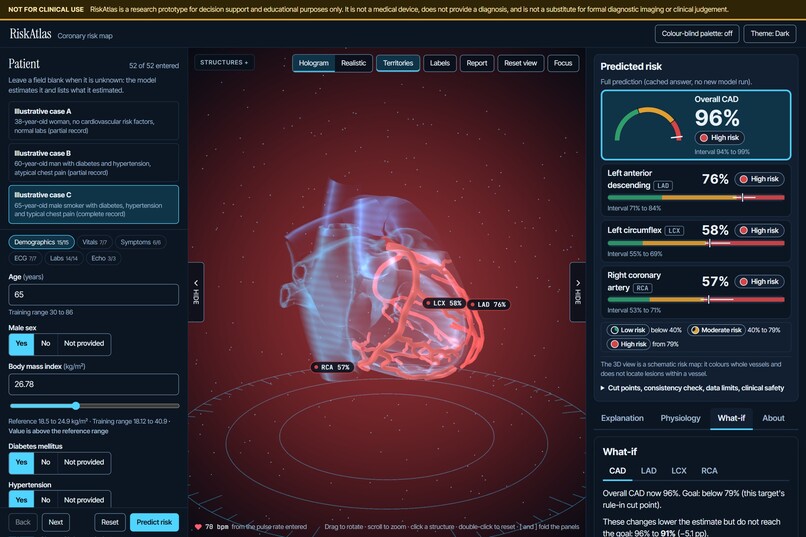
What-if sliders
-
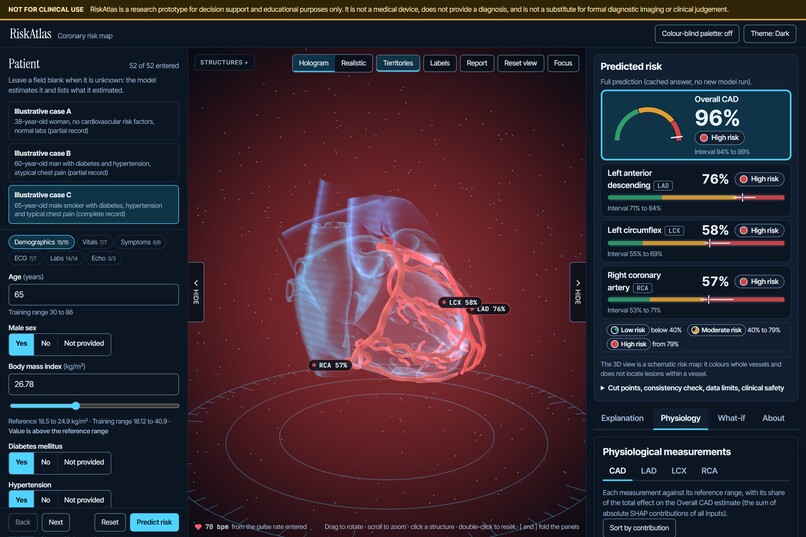
Physiology panel
-
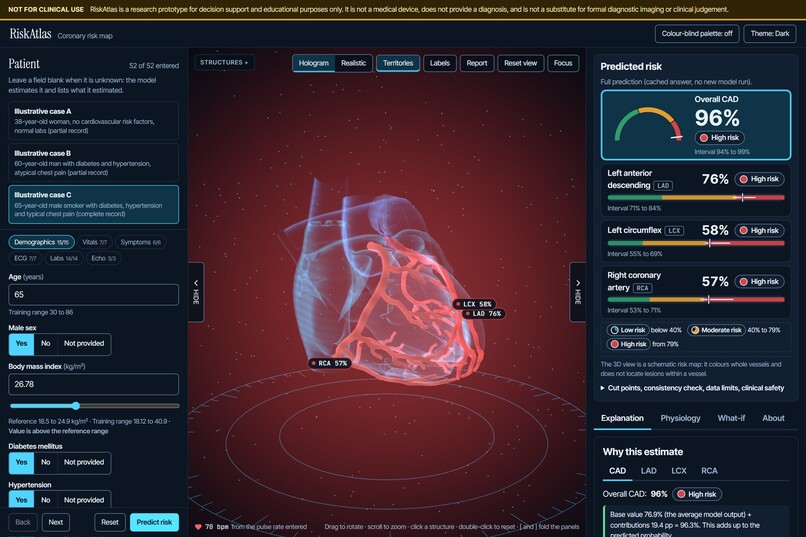
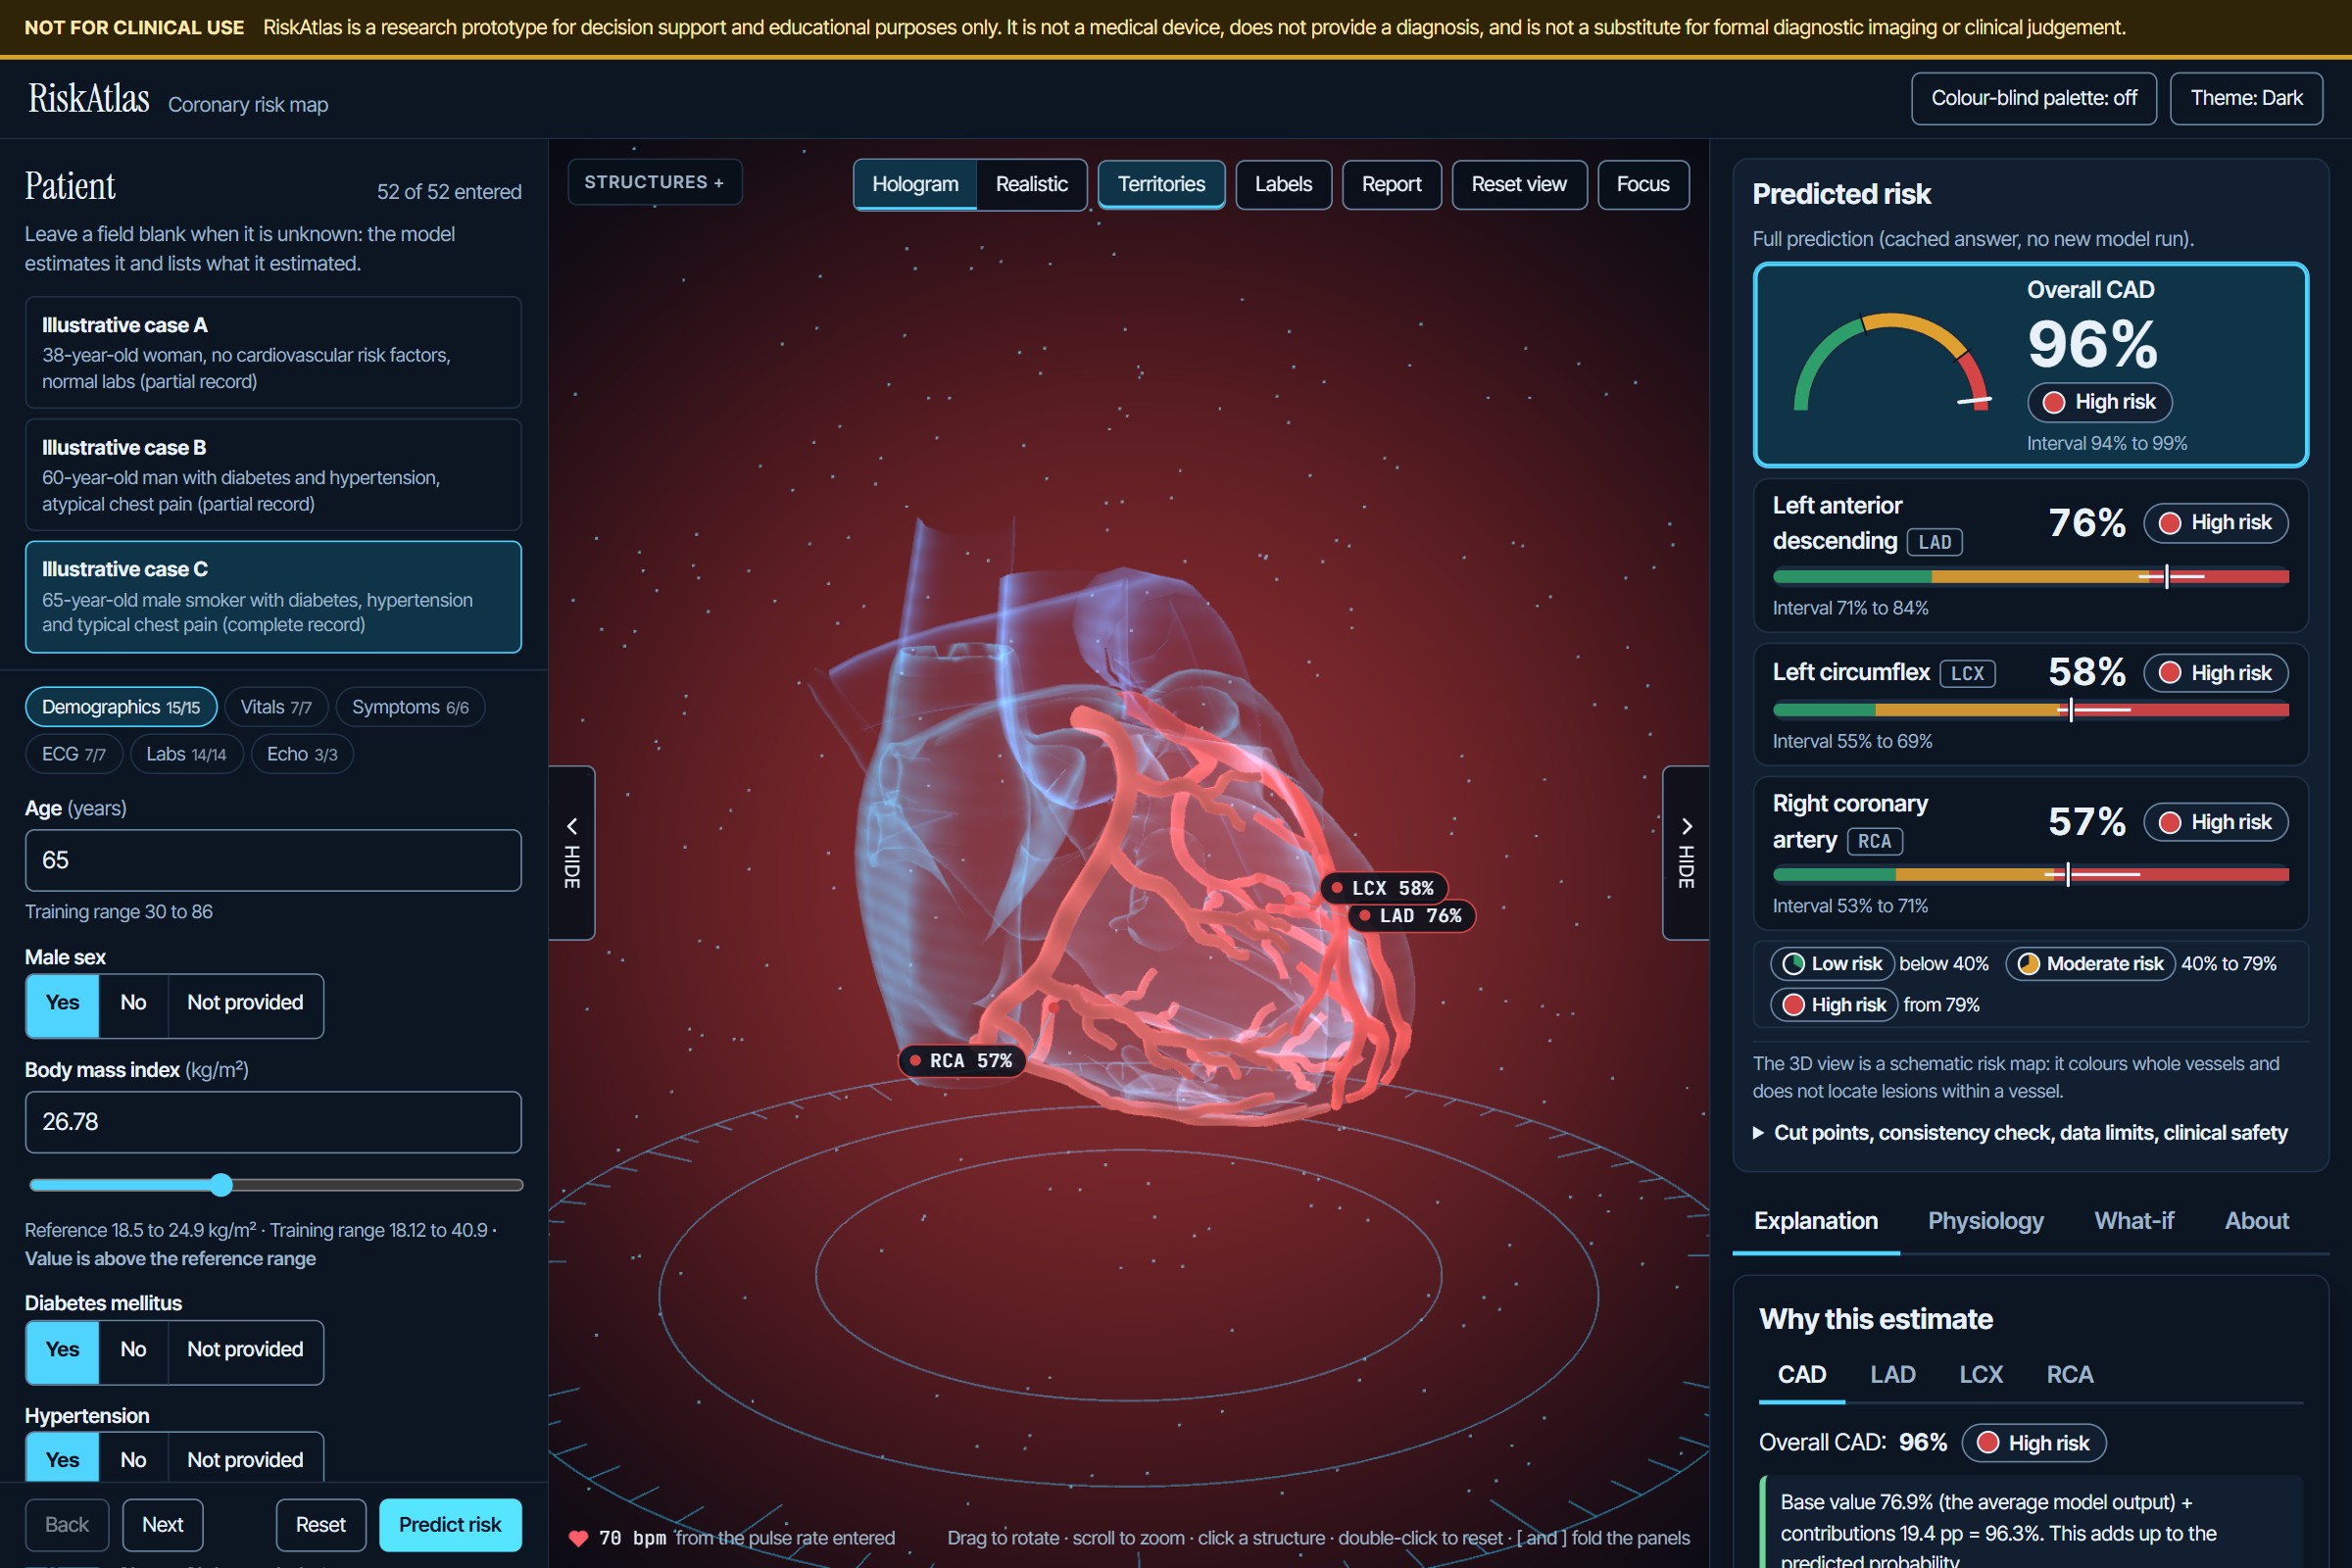
High-risk patient
-
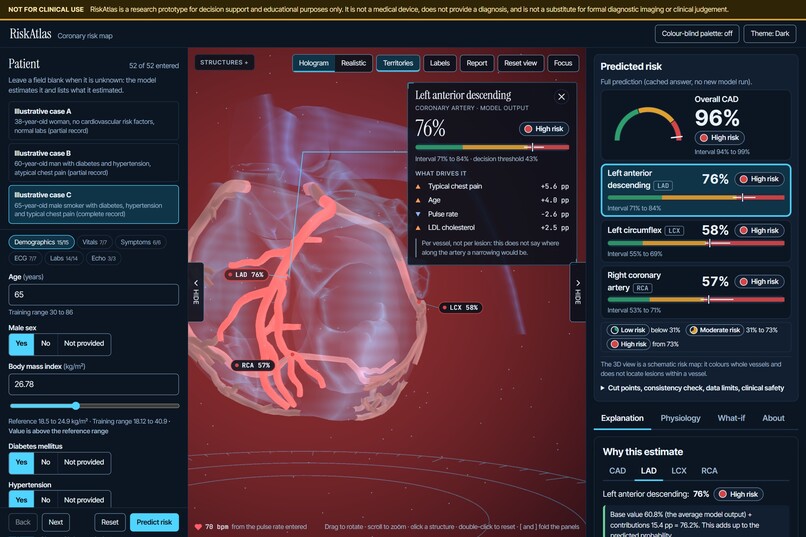
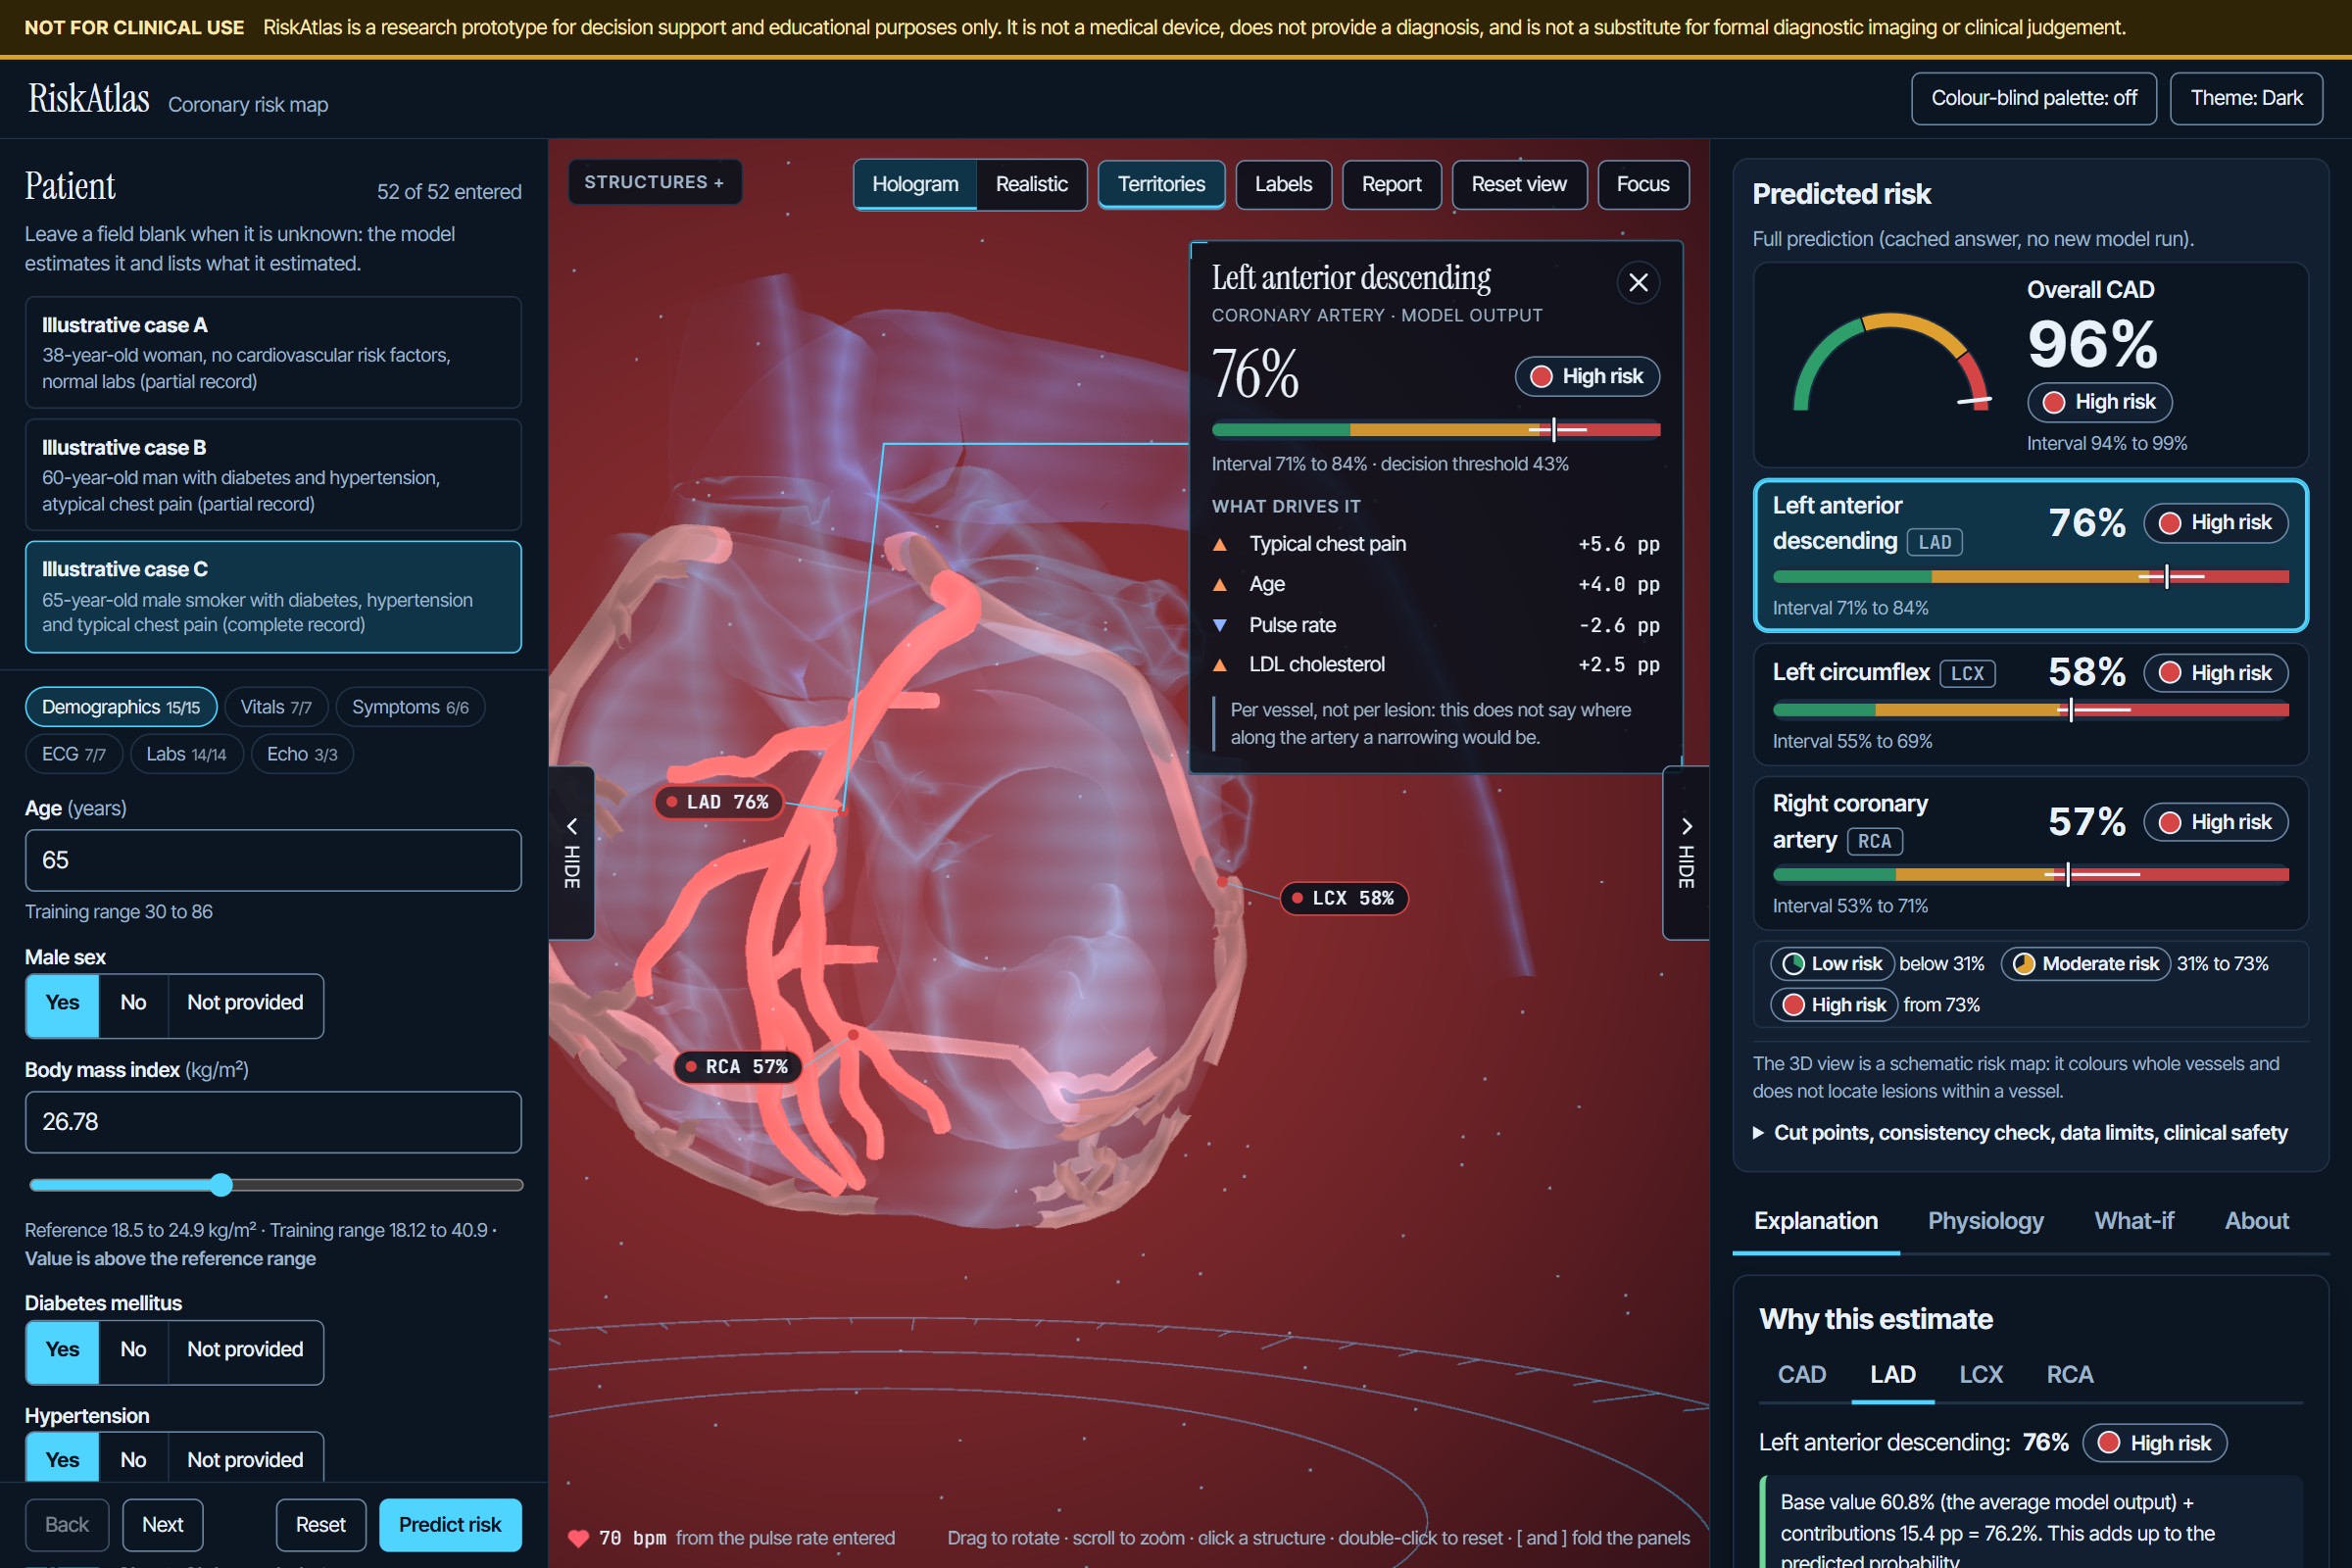
Artery selected
-
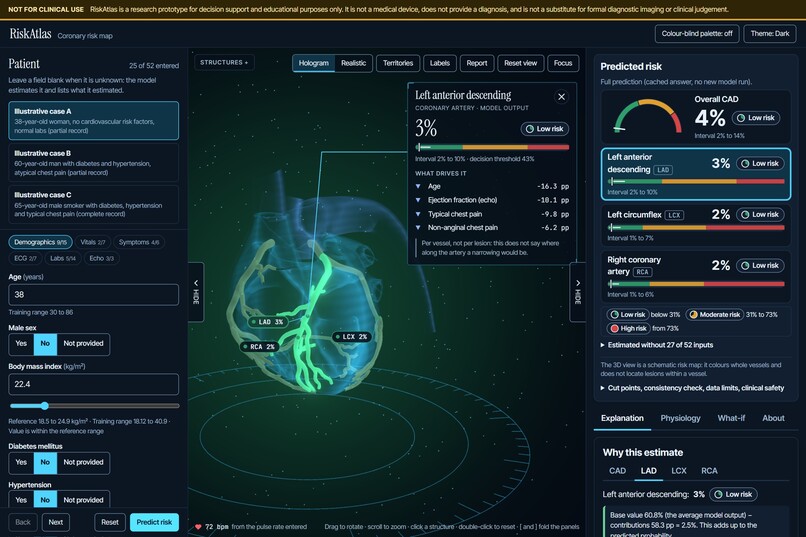
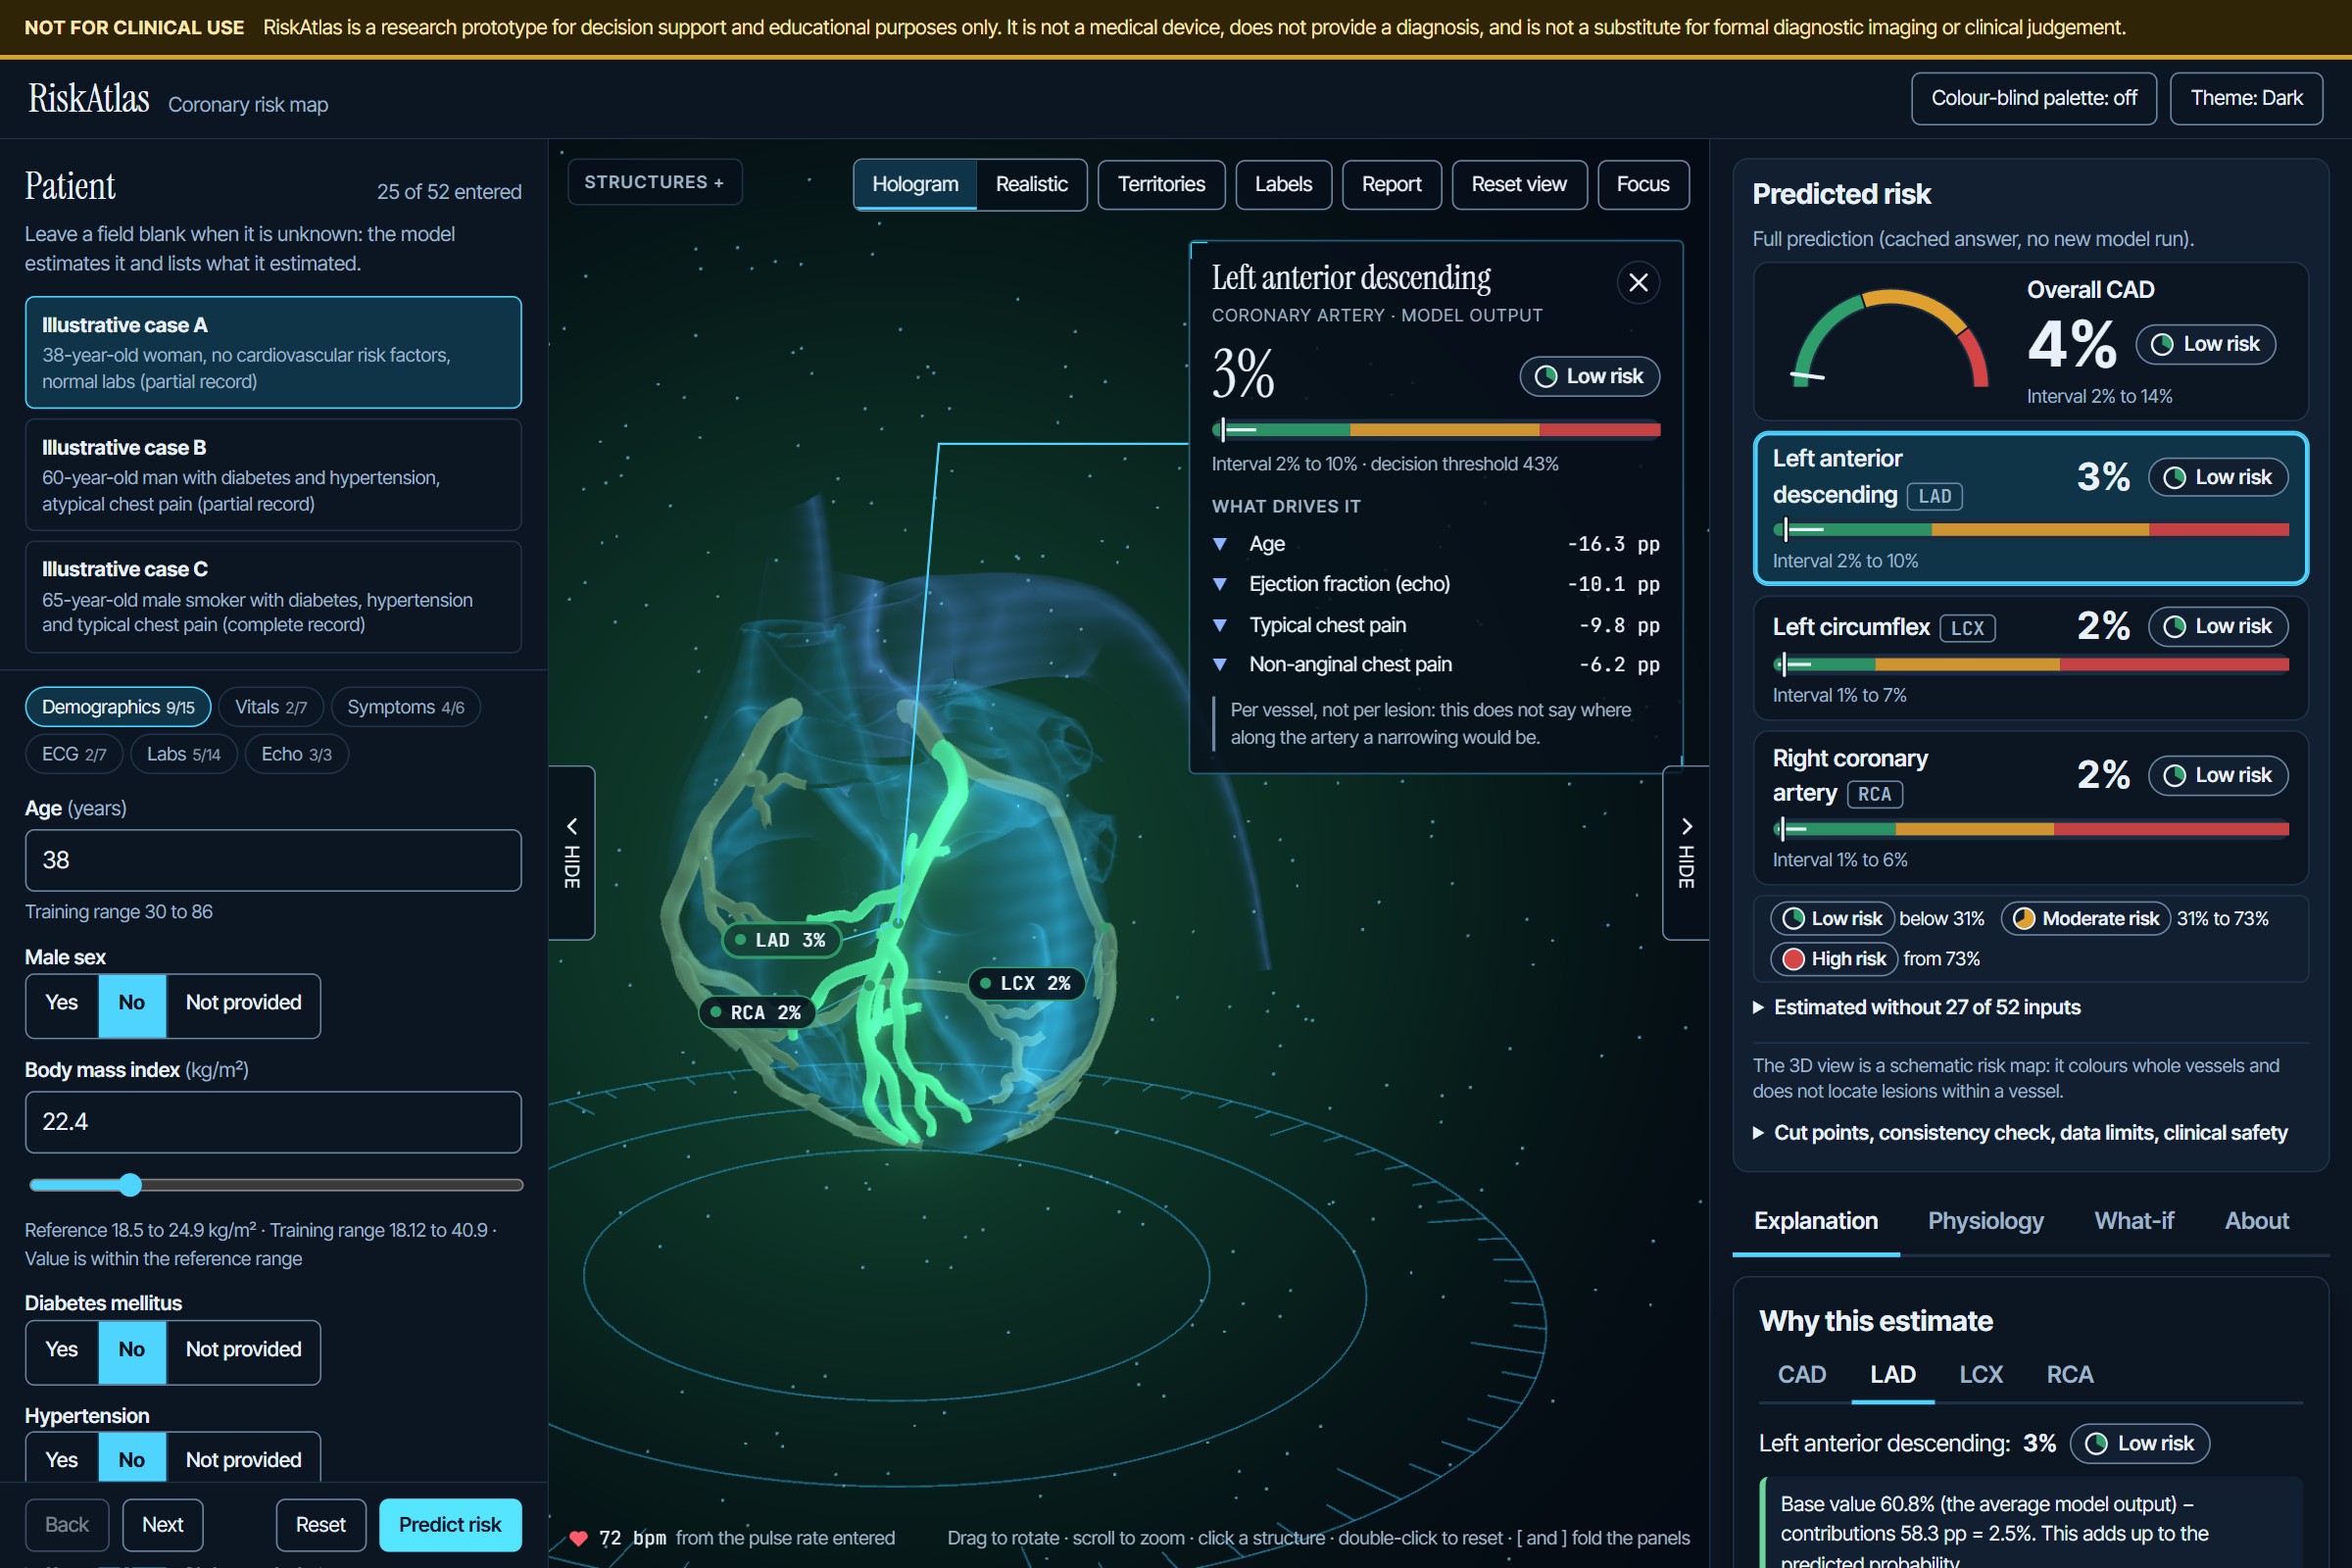
Low-risk patient
-
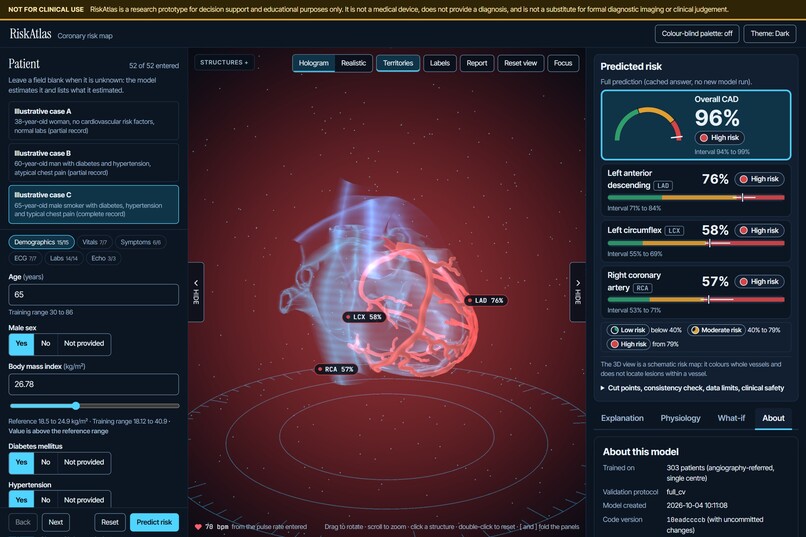
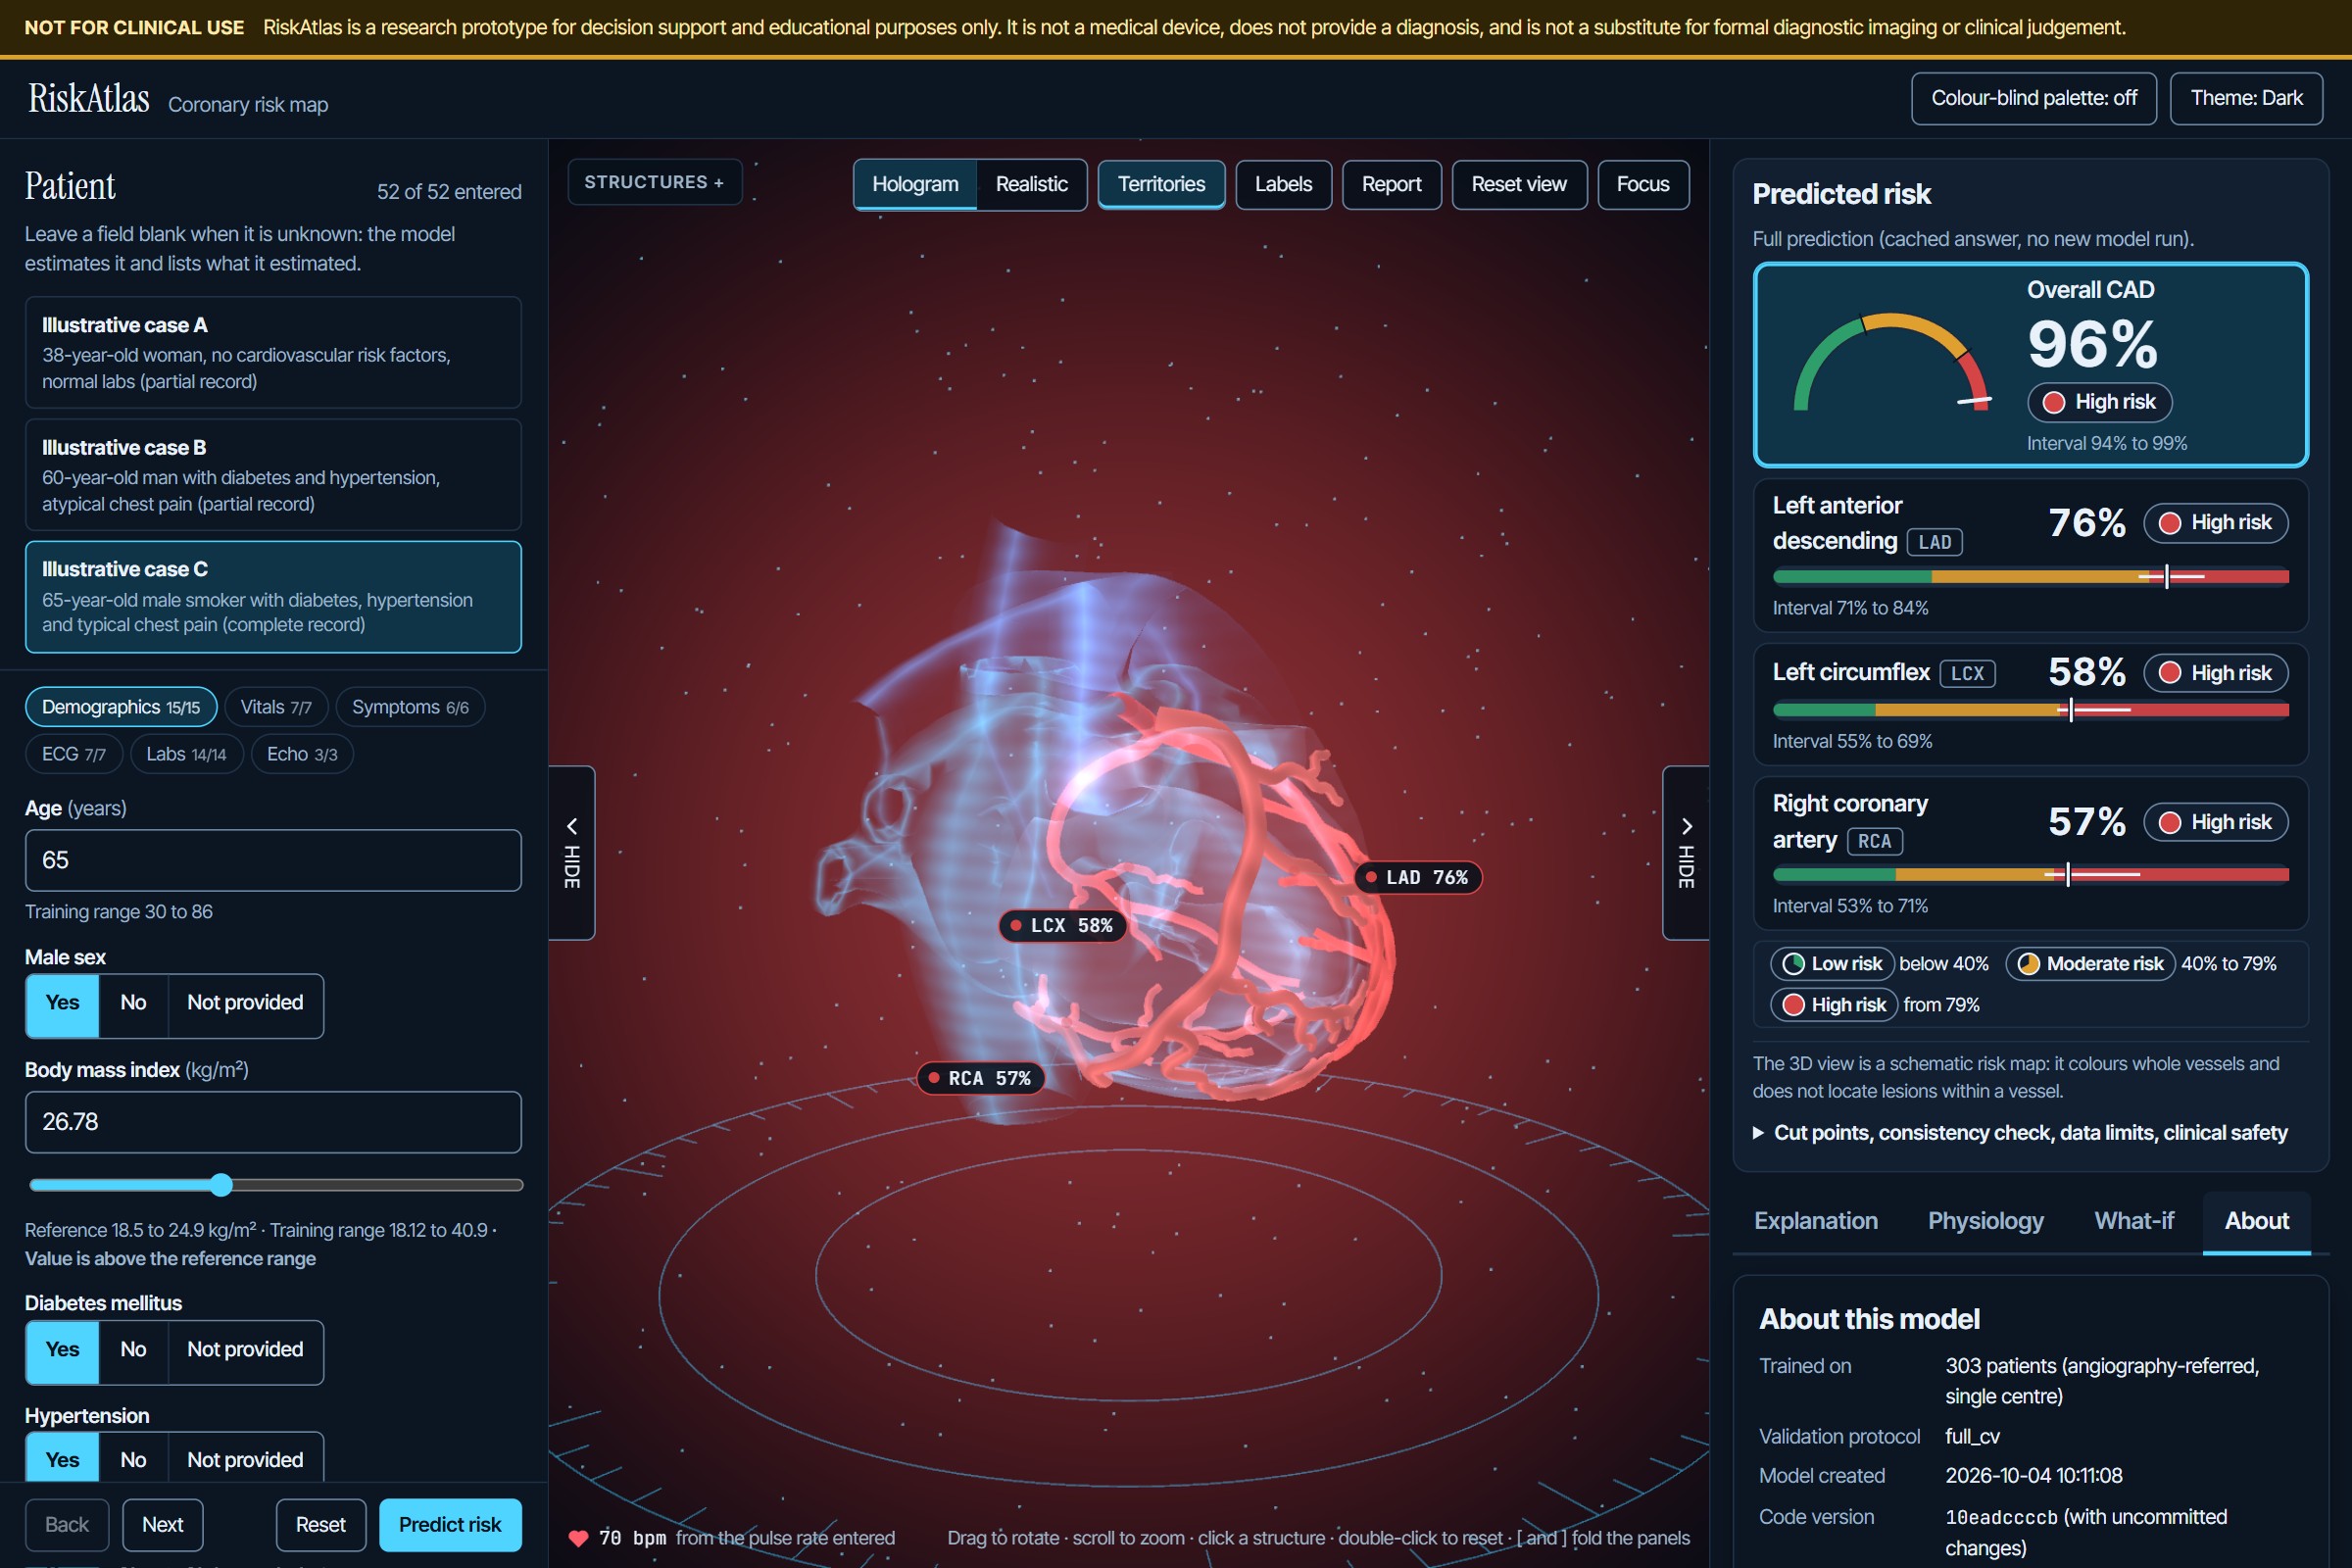
About panel
Inspiration
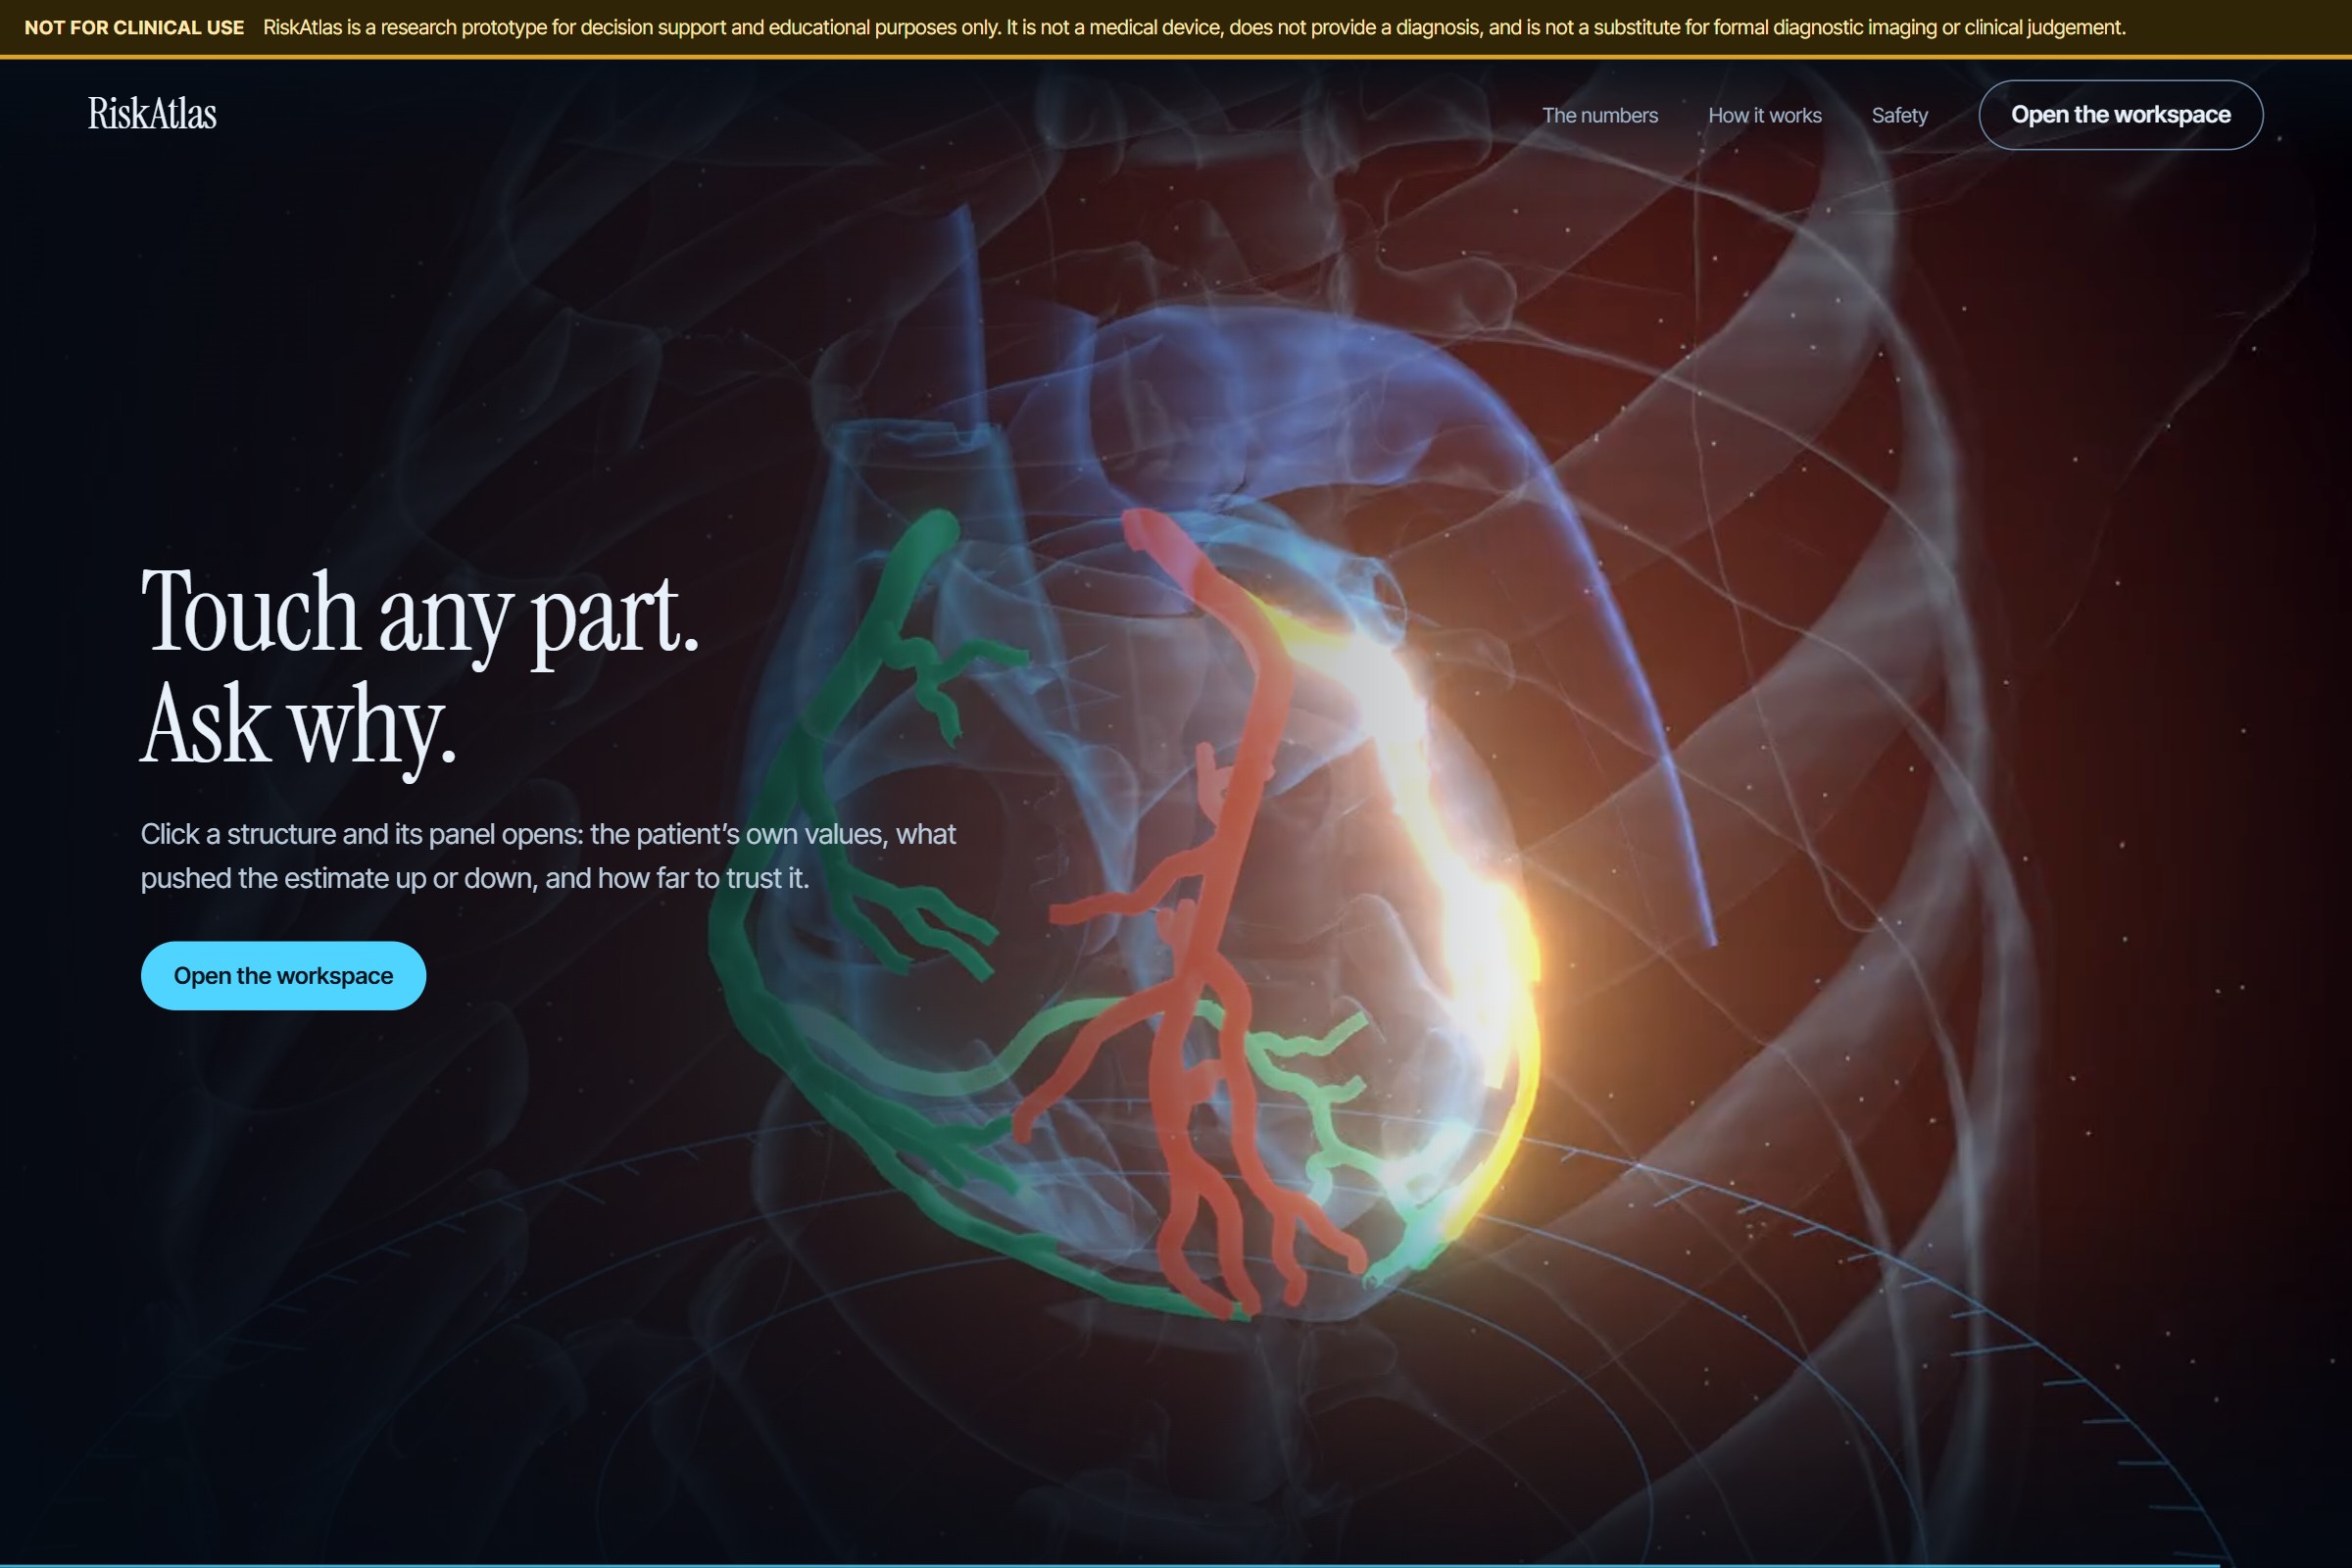
Cardiovascular disease is the world's leading cause of death, yet risk models usually end at a single number: "72% chance of coronary artery disease." A number like that doesn't tell a patient, or a busy clinician, where the problem is likely to be, how sure the model is, or why it thinks so.
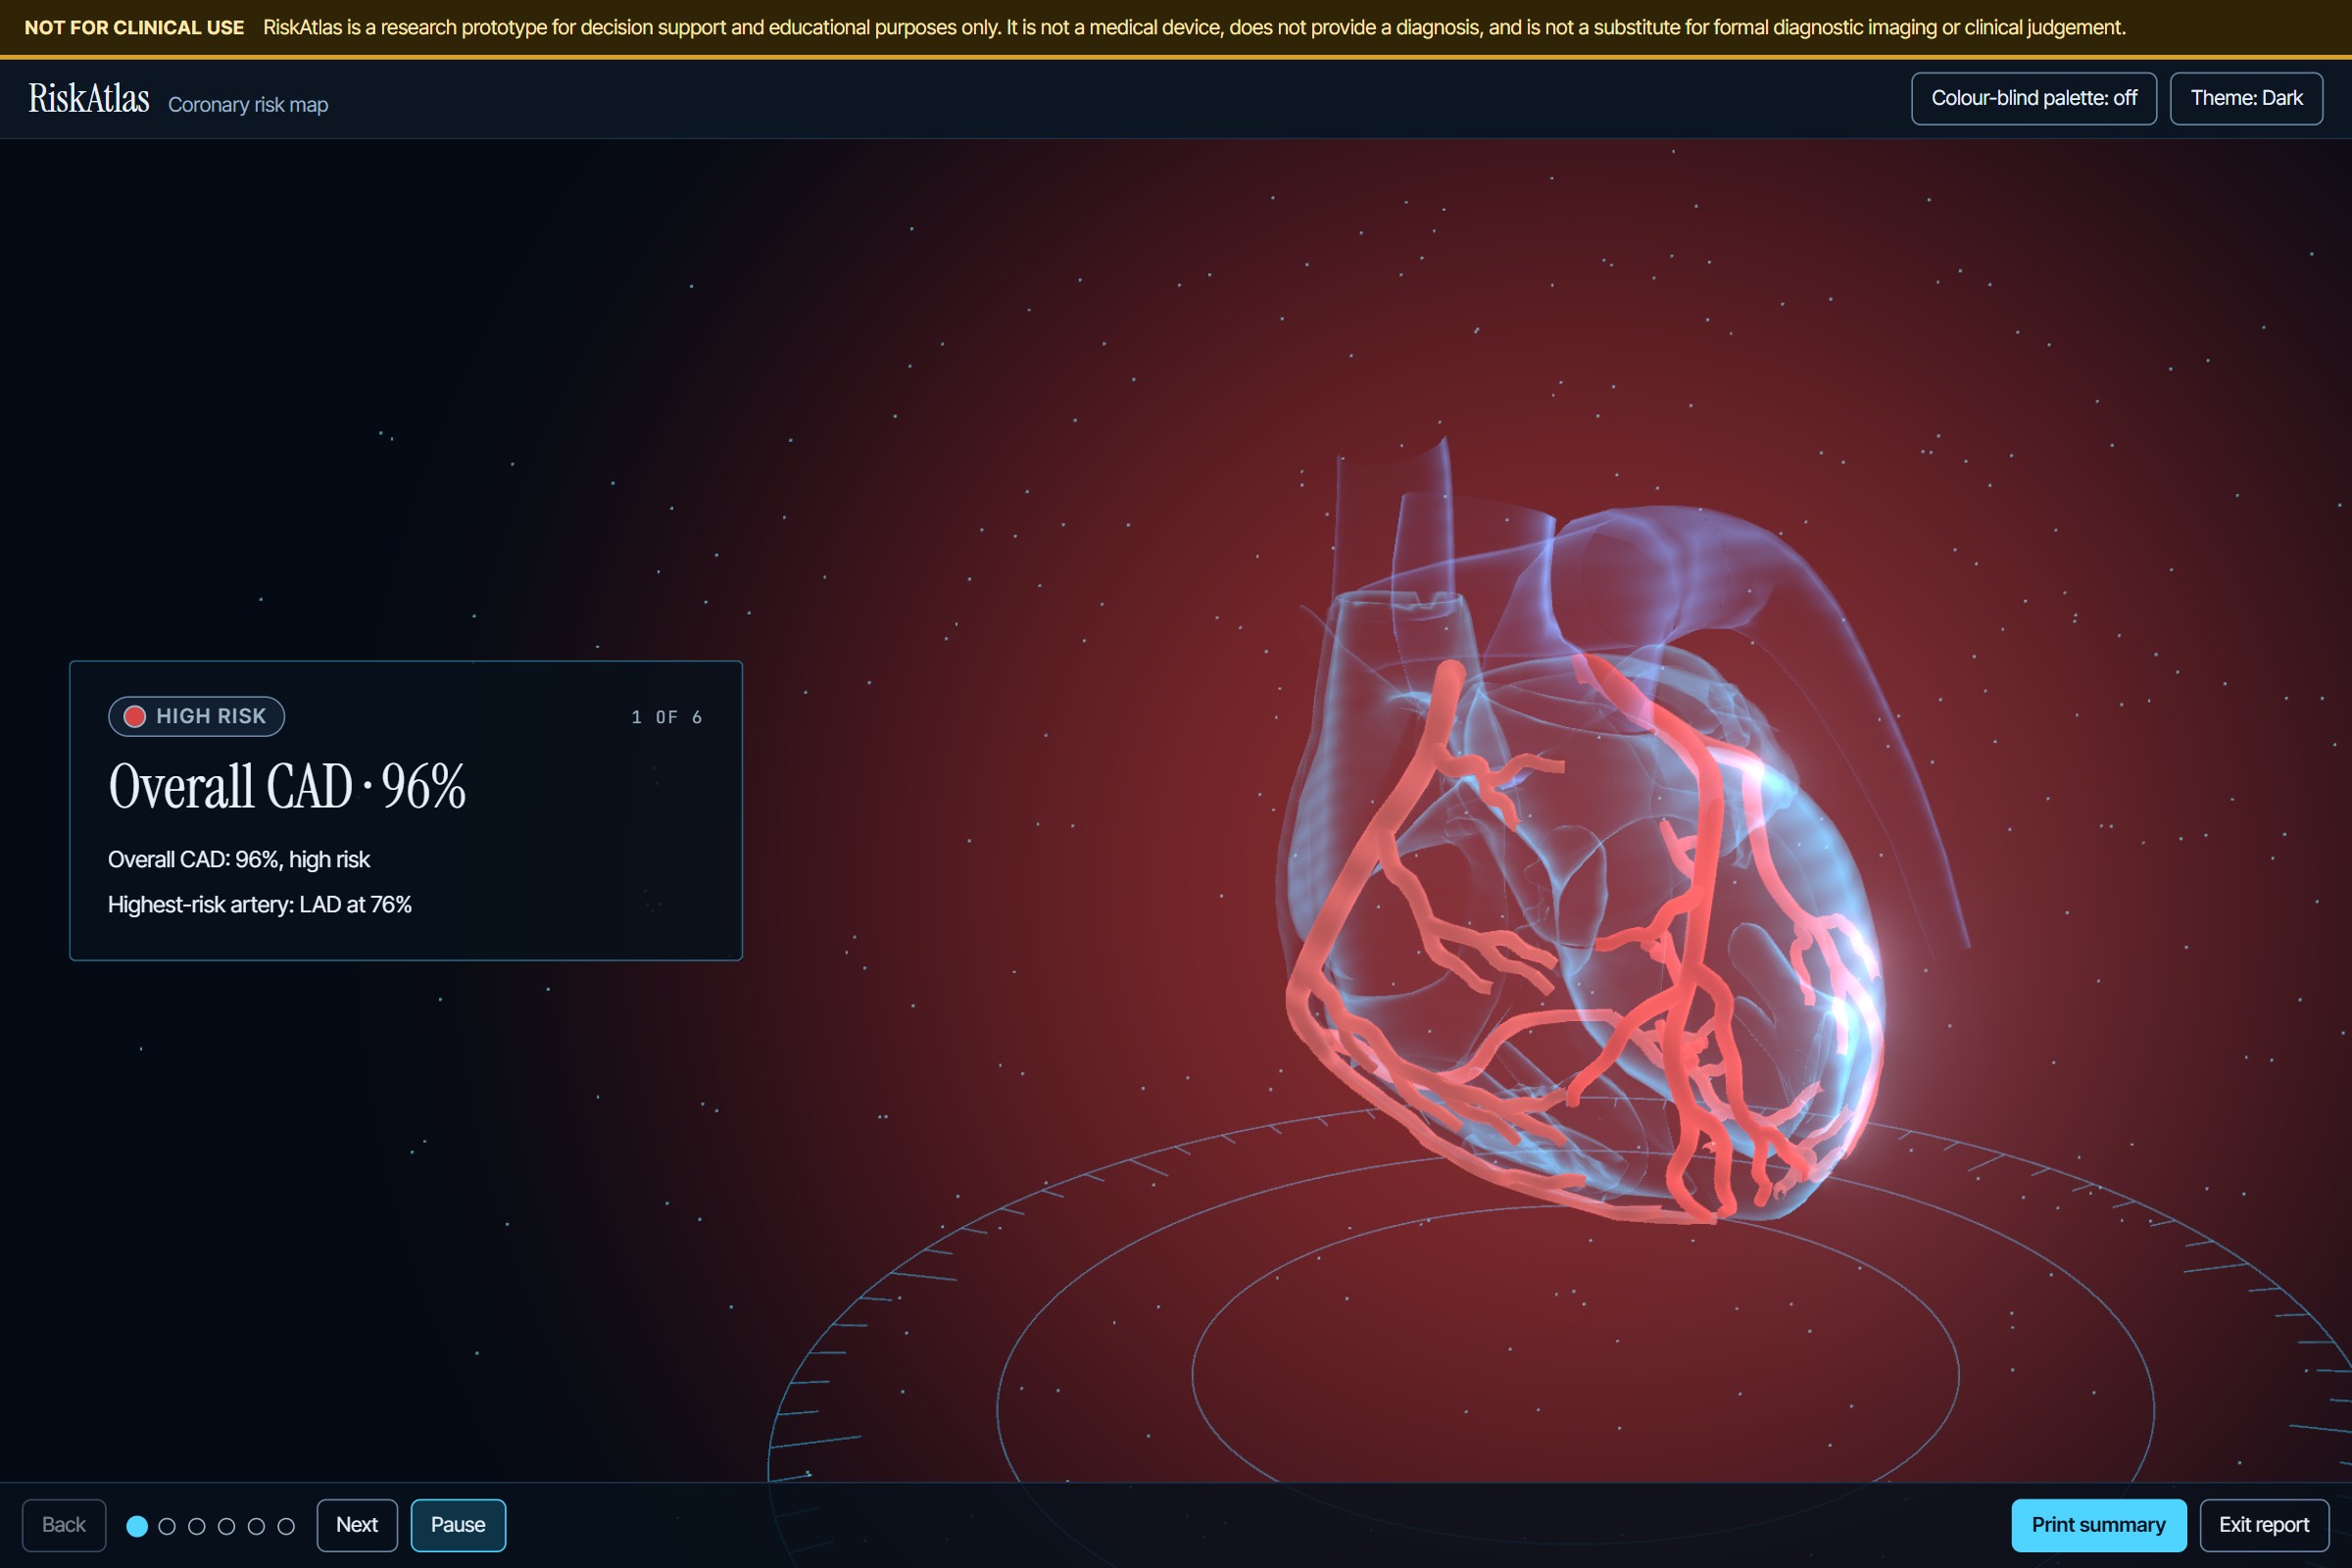
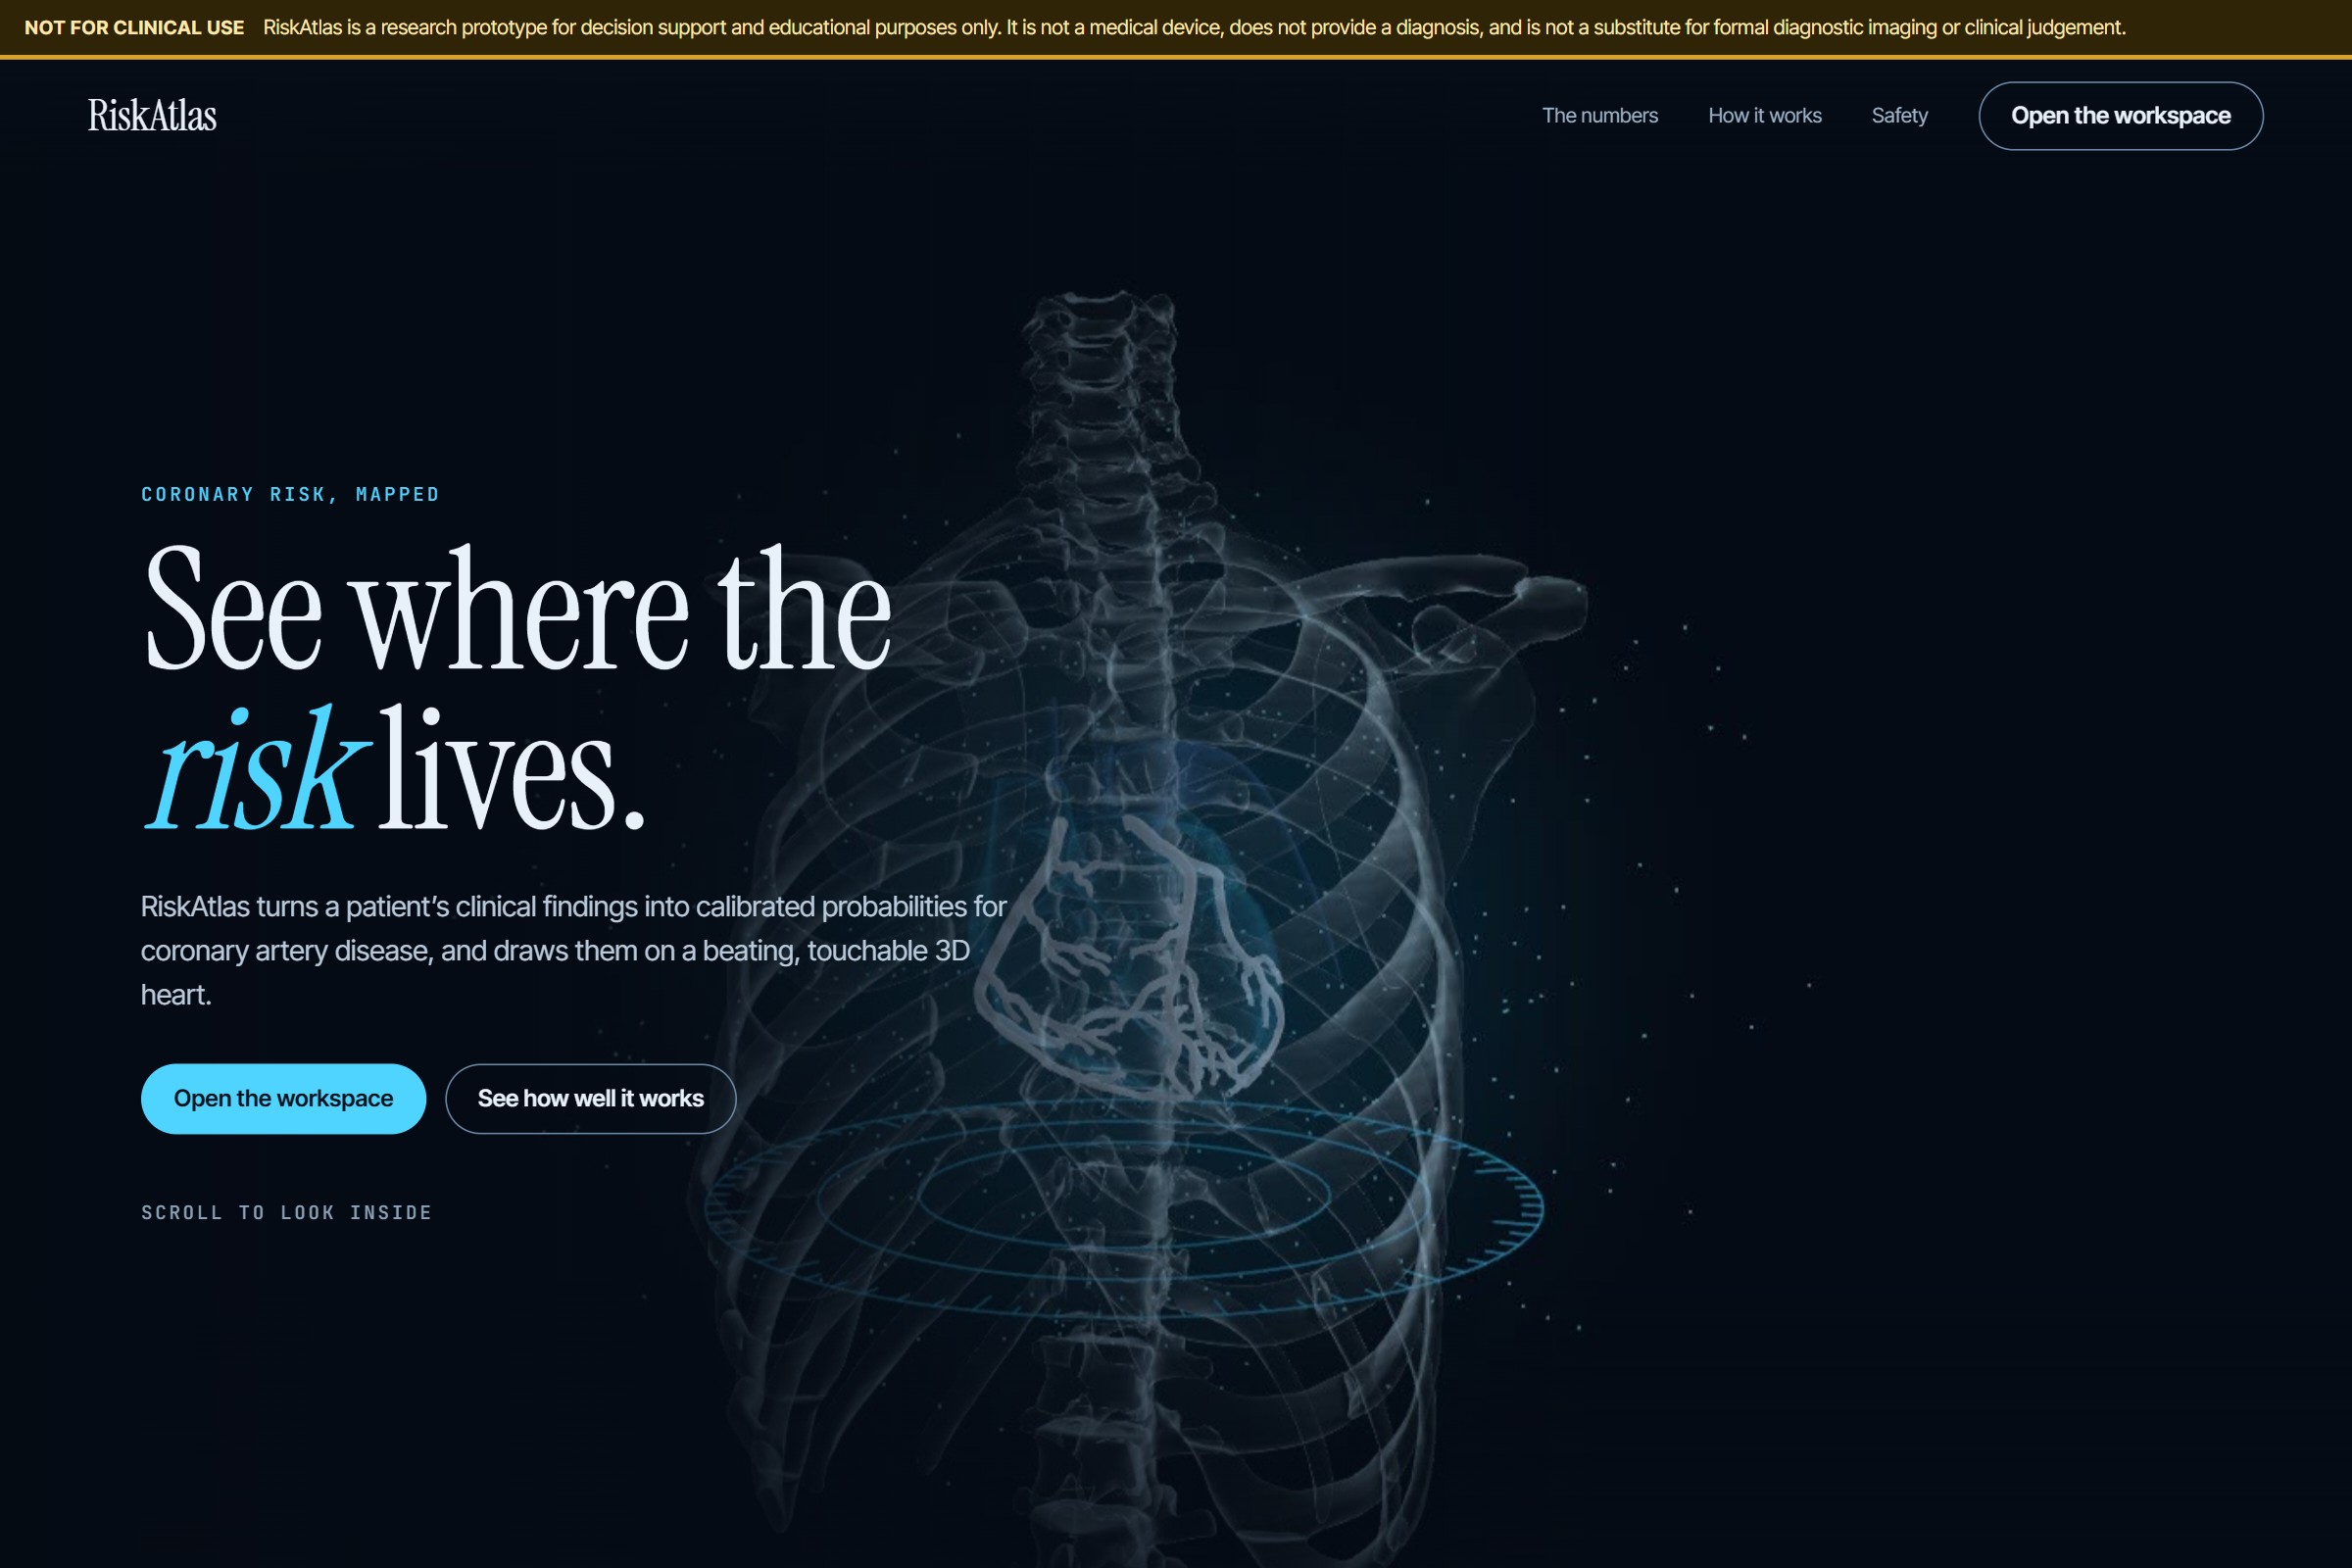
We wanted to turn routine clinical data into something you can see: a 3D heart whose coronary arteries light up by predicted risk, with every prediction explained and every number honestly validated.
What it does
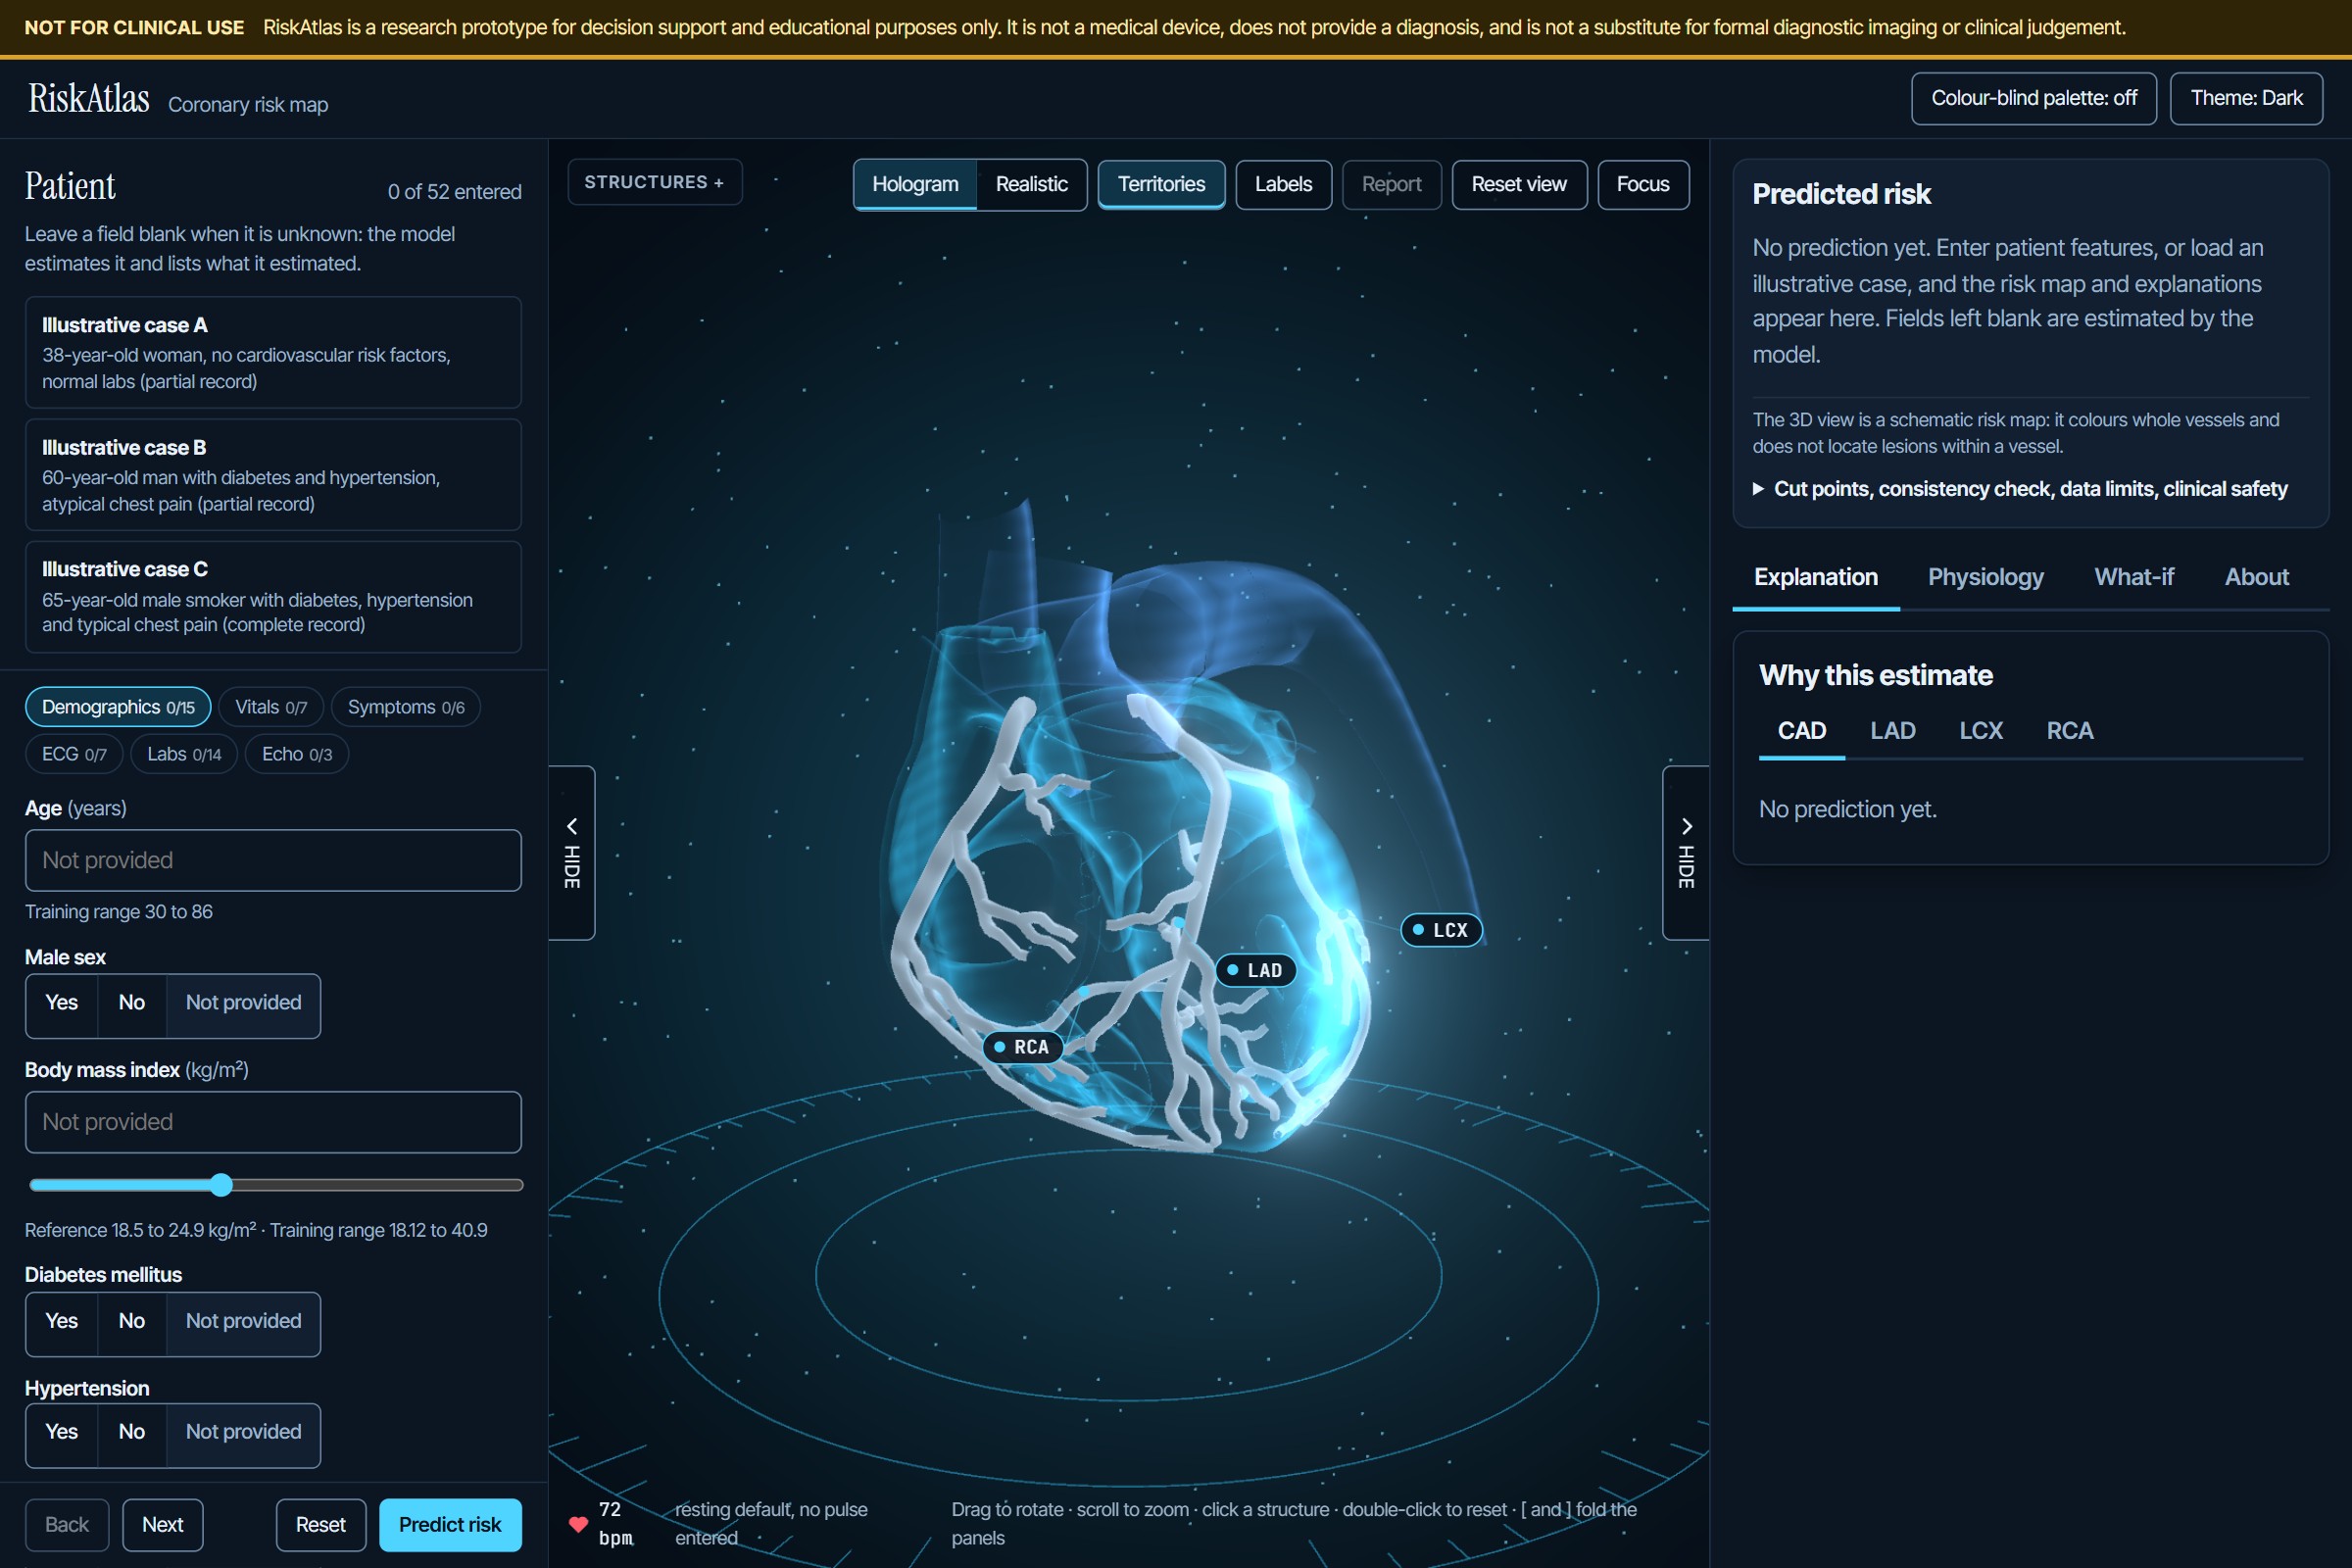
RiskAtlas takes a patient's demographic, examination, ECG, lab and echocardiography values and predicts:
- overall coronary artery disease (CAD), and
- stenosis in each of the three major arteries: LAD, LCX and RCA.
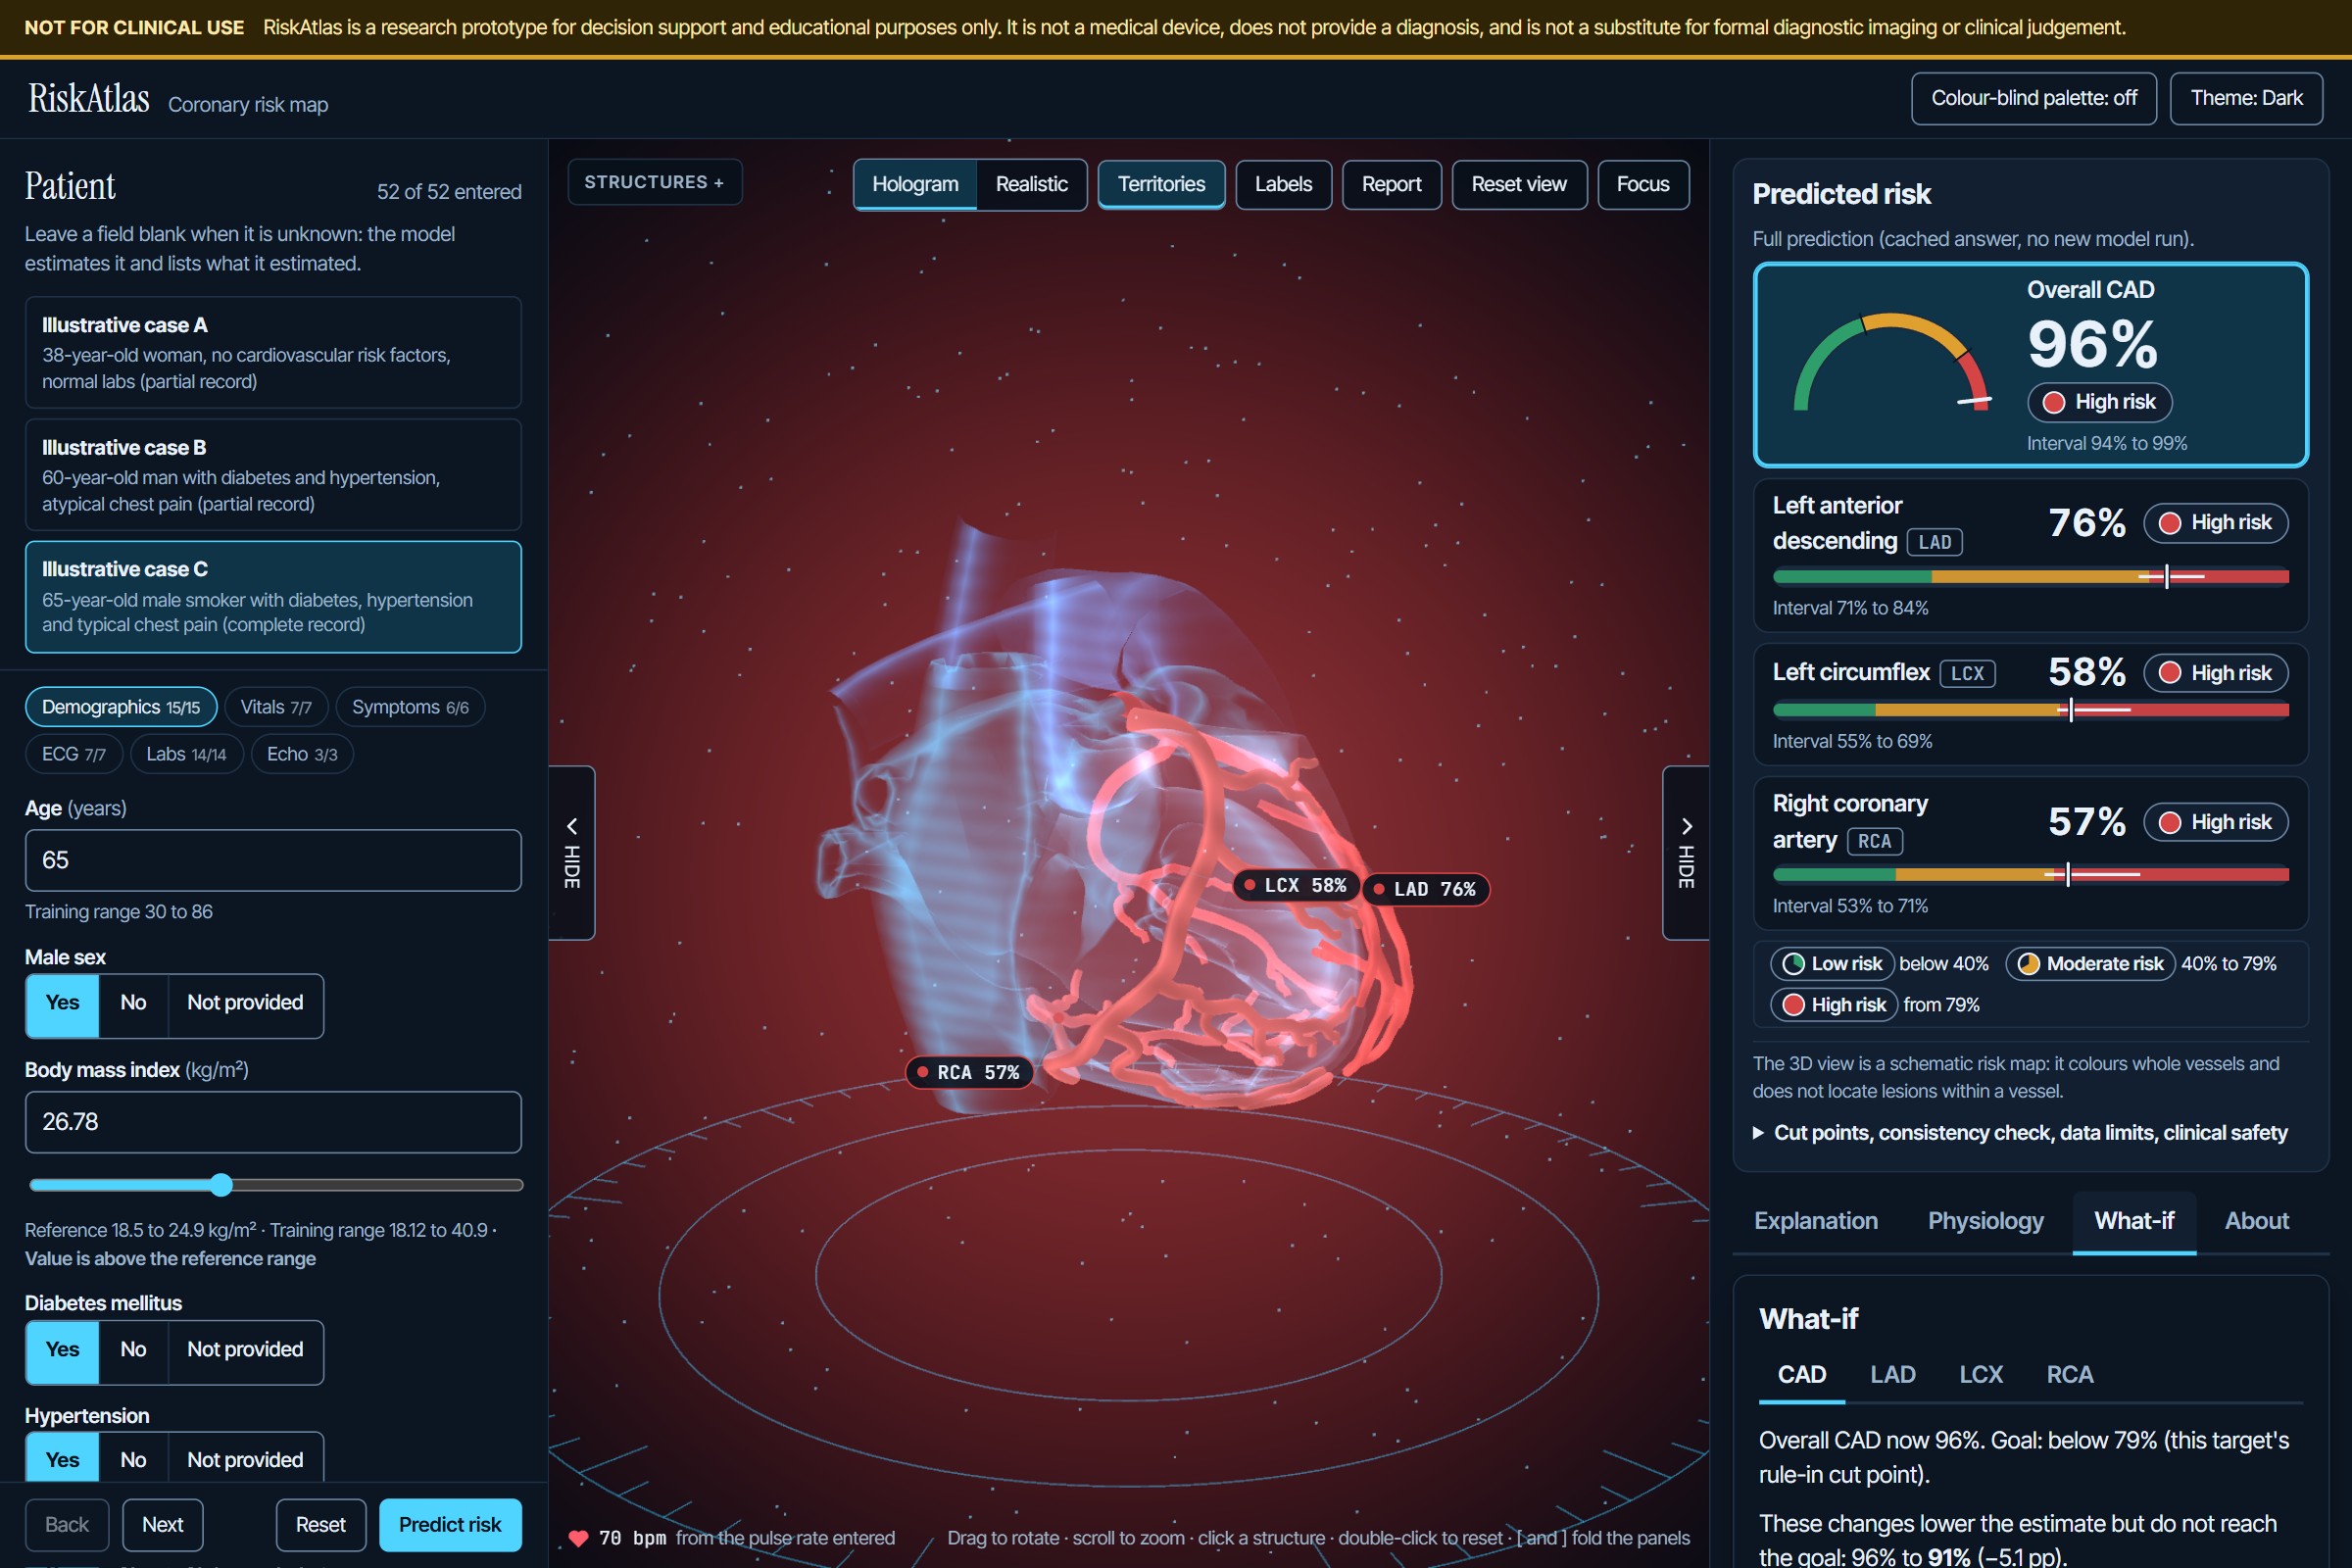
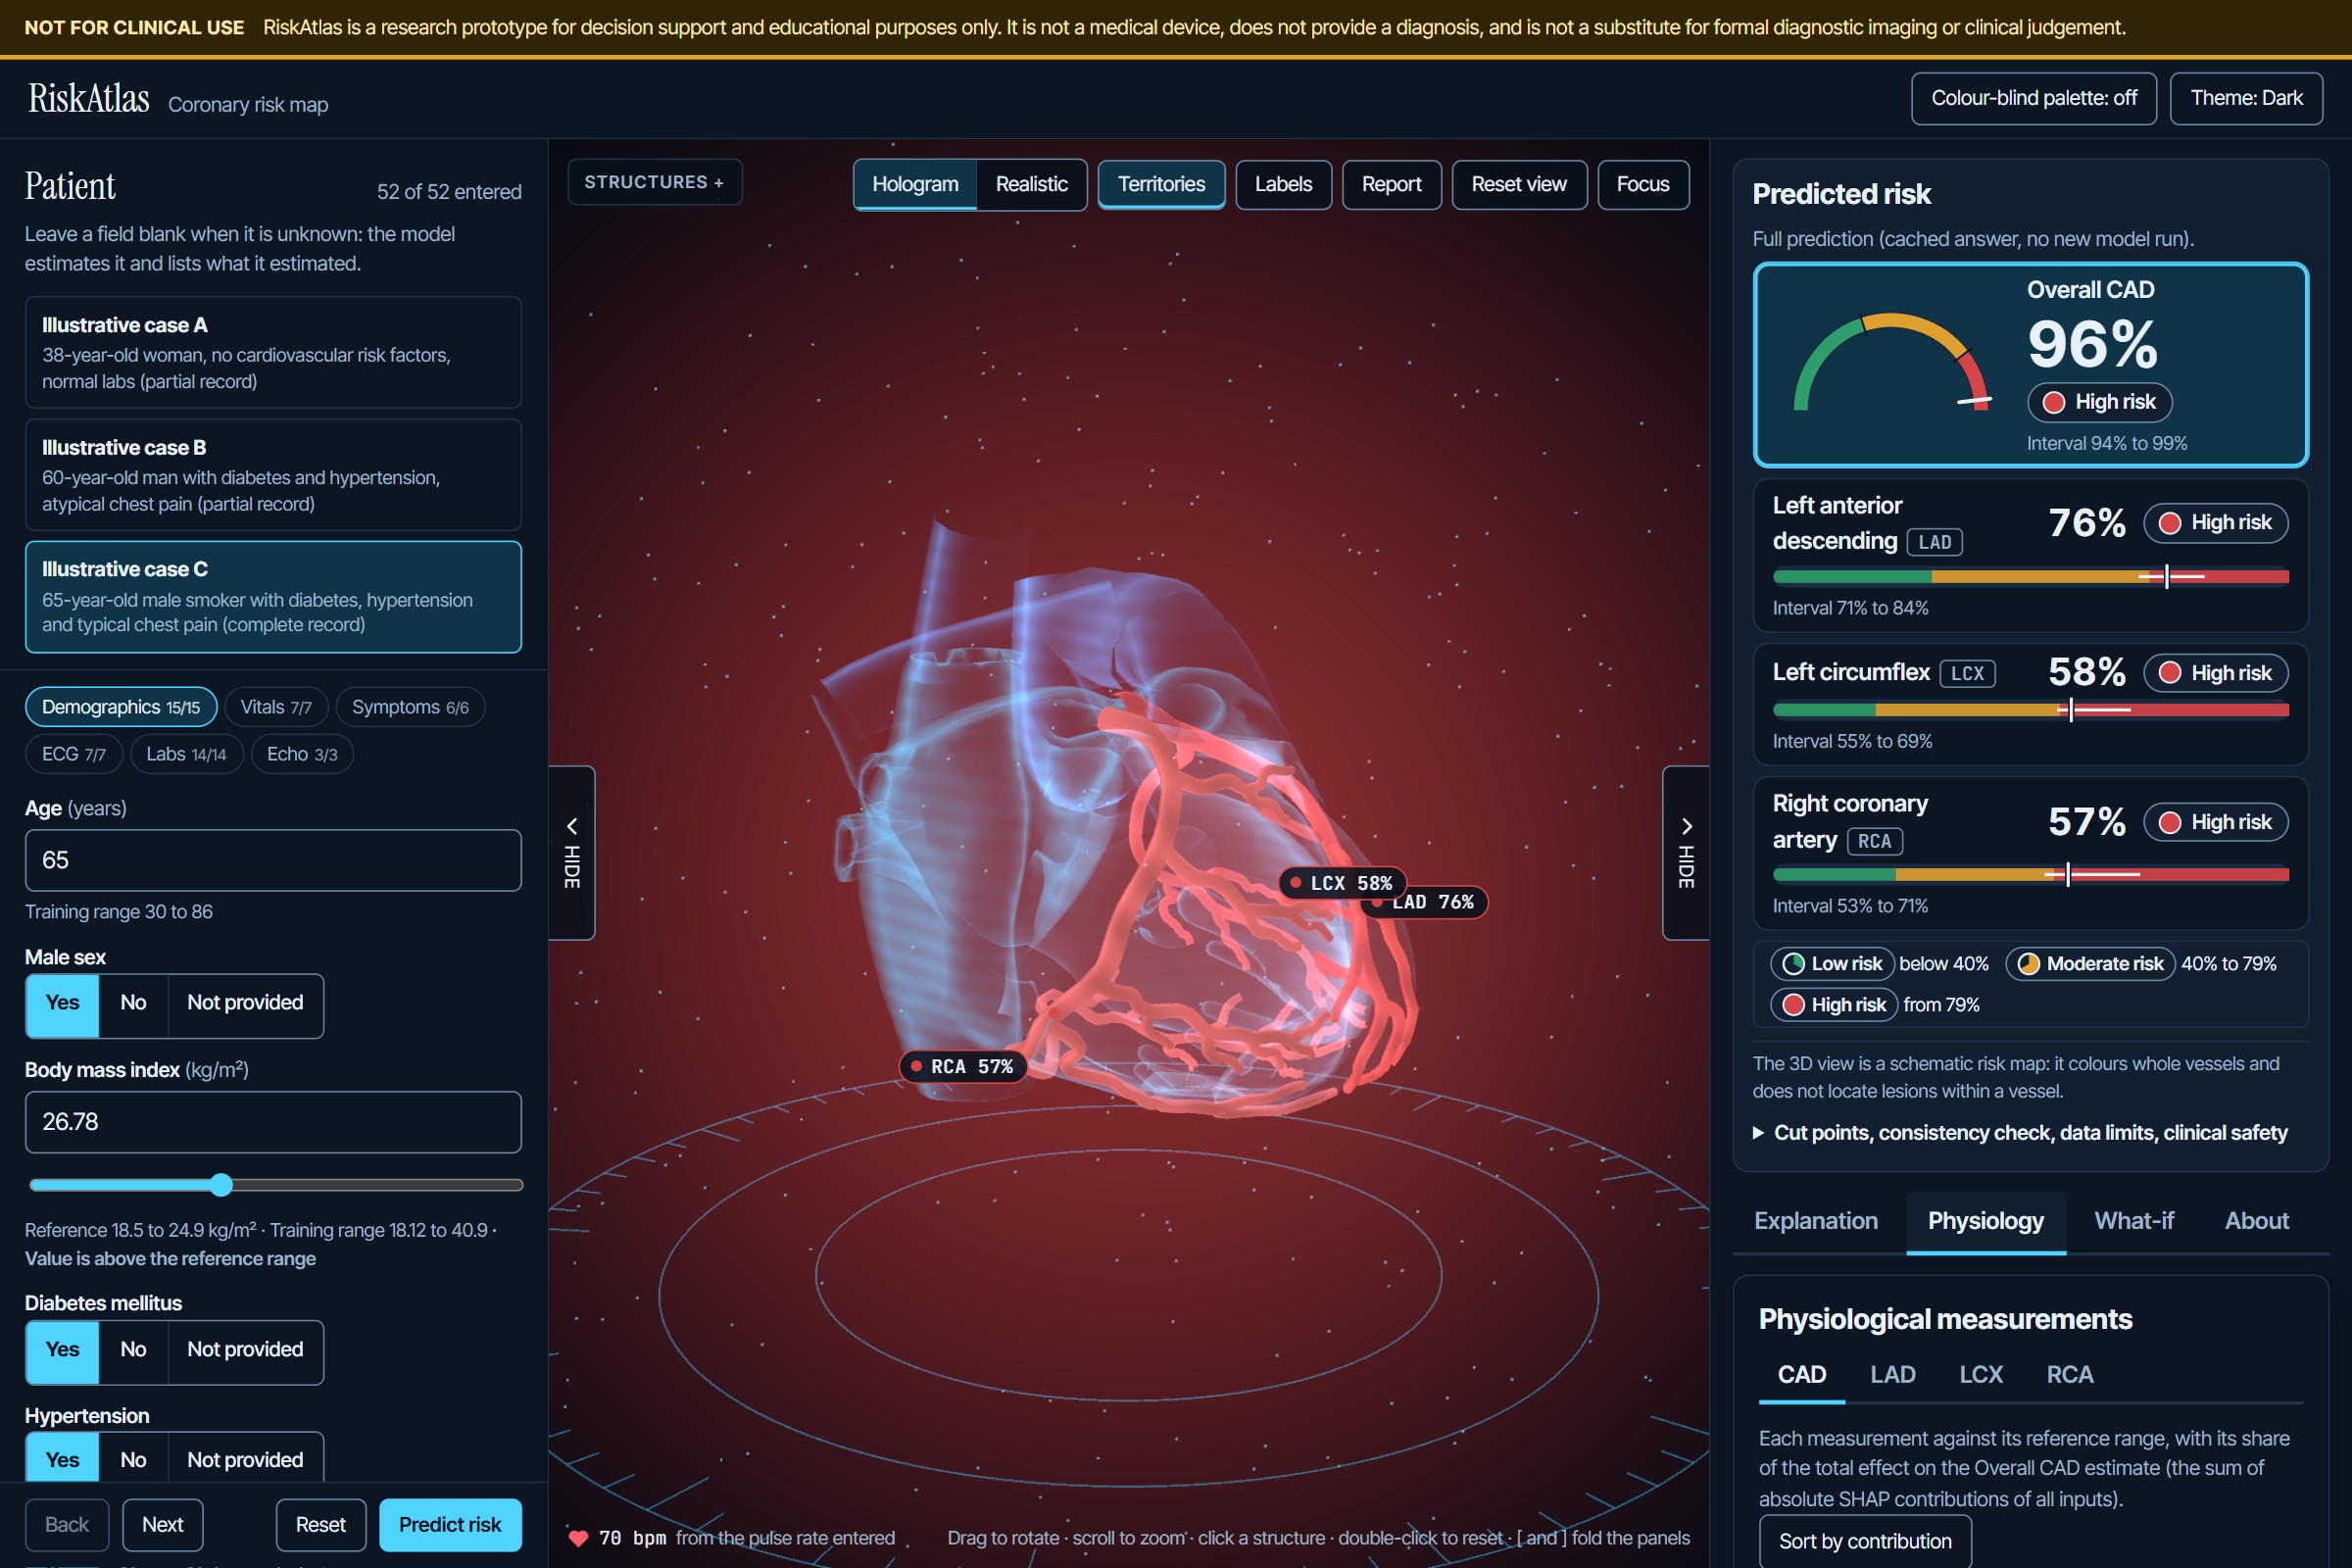
The predictions are mapped onto an interactive 3D heart. Each artery is coloured by its risk band (low / moderate / high), and its colour saturation shows how confident the model is. Next to the heart, a clinical dashboard shows:
- why: SHAP attributions that add up exactly to the displayed probability;
- physiology: each measurement against its reference range;
- what-if: sliders that recolour the heart live, plus automatic counterfactuals ("the smallest plausible change that lowers this artery's risk band");
- a permanent safety disclaimer: decision support only, not a substitute for angiography.
How we built it
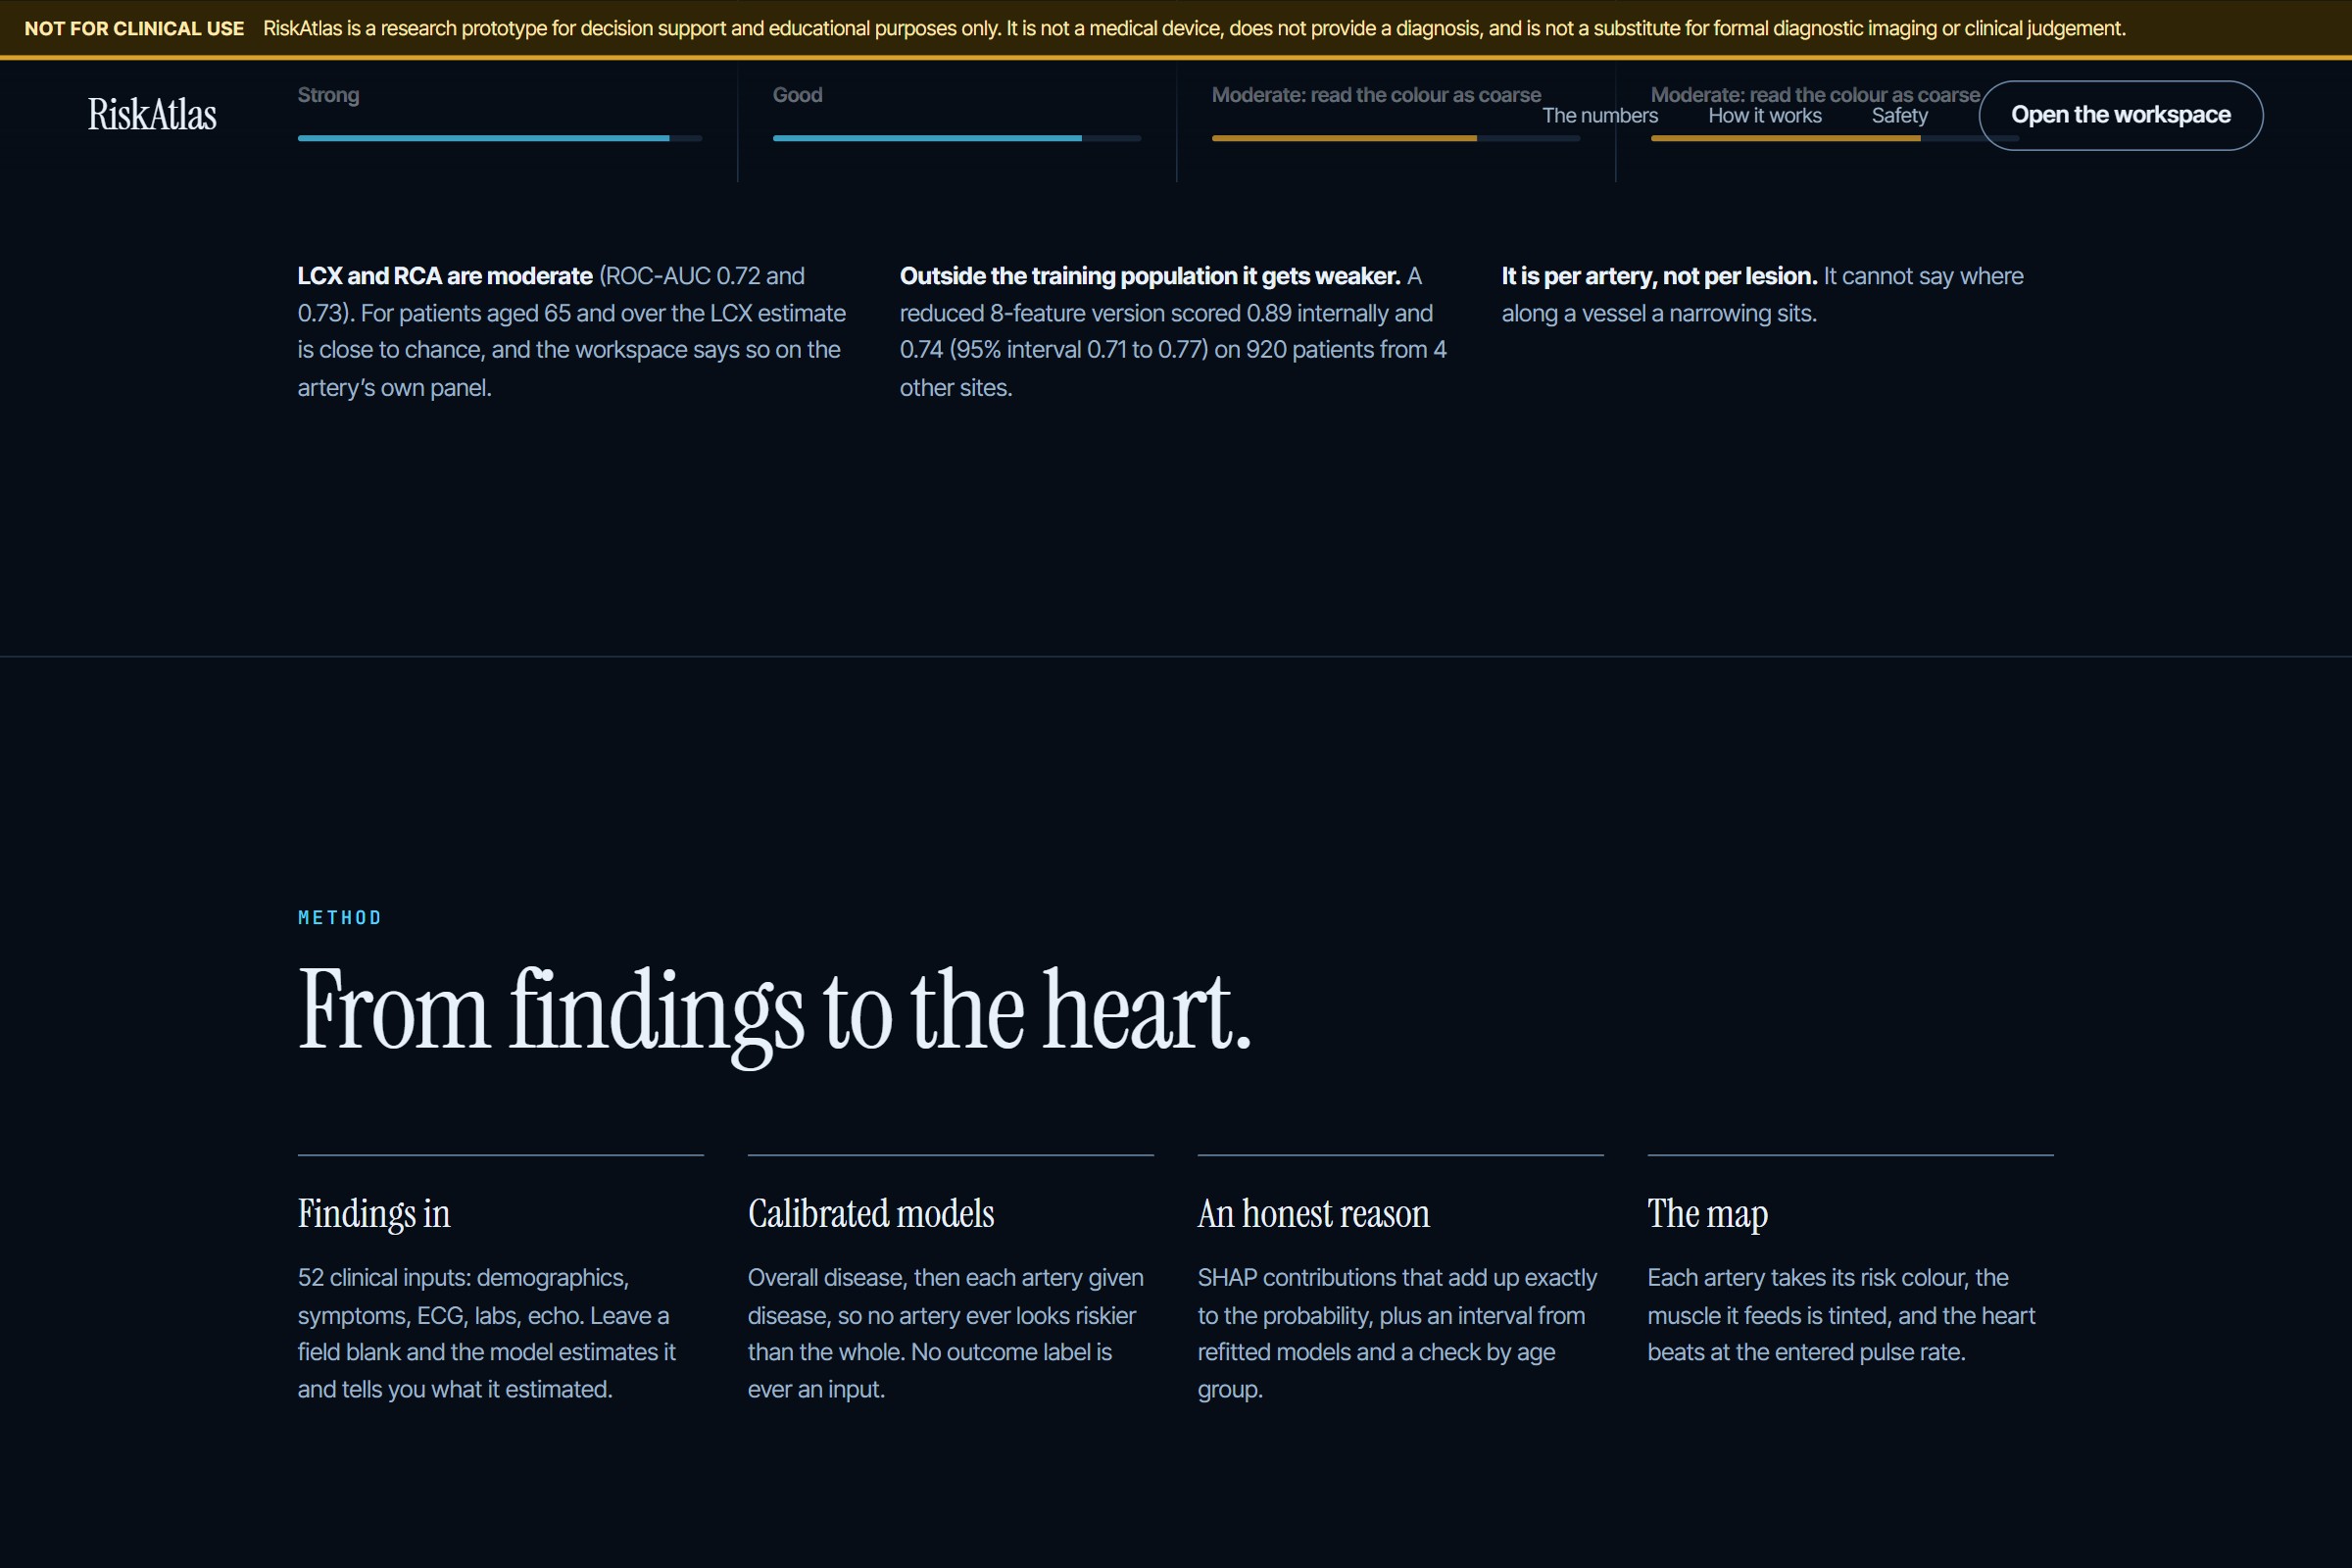
Data. The Extension of Z-Alizadeh Sani dataset (303 patients, 52 inputs). Following the problem statement and the dataset authors, the per-artery labels and Cath are never used as inputs. A leakage guard enforces this in code, and tests cover it.
Models that respect the anatomy. CAD is defined as at least one stenotic artery, so each artery is modelled through CAD:
$$ P(\text{vessel}) = P(\text{CAD}) \times P(\text{vessel} \mid \text{CAD}) $$
This guarantees an artery can never look riskier than CAD itself. For each part we compared logistic regression, random forests, XGBoost and an ensemble, then picked the simplest one within one standard error of the best.
Validation. We develop on all patients and estimate performance by re-running the entire procedure (model selection, tuning, calibration and thresholds) inside every cross-validation fold, with 95% bootstrap intervals on every metric. We also validated externally on 920 patients from 4 hospitals (UCI Heart Disease).
Stack. A Python/scikit-learn pipeline (one command, python -m pipeline), a FastAPI backend serving one /predict call, and a React + Three.js frontend that runs smoothly without a dedicated GPU.
Challenges we ran into
- Tiny data, big temptation. Many published results on this dataset look excellent (some report an AUC of 1.0), often because of leakage. Staying honest meant building our own guardrails: nested validation, a leakage guard, and numbers generated by code, never typed by hand.
- A noisy first test set. Our first 61-patient holdout had only about 22 RCA cases, so its intervals were about ±0.15. Following Steyerberg's guidance for small samples, we switched to cross-validating the whole procedure on all patients. We changed protocol after seeing that first result, so we report it too rather than hide it.
- Contradictory outputs. Separate models said things like "CAD 60%, LAD 75%" for about 20% of patients. Restructuring the model fixed this at the root instead of patching the display.
- Real-time vs rich explanations. The full payload takes about 2 seconds, so sliders use a fast path of about 0.1 seconds while dragging and fetch everything on release.
Accomplishments that we're proud of
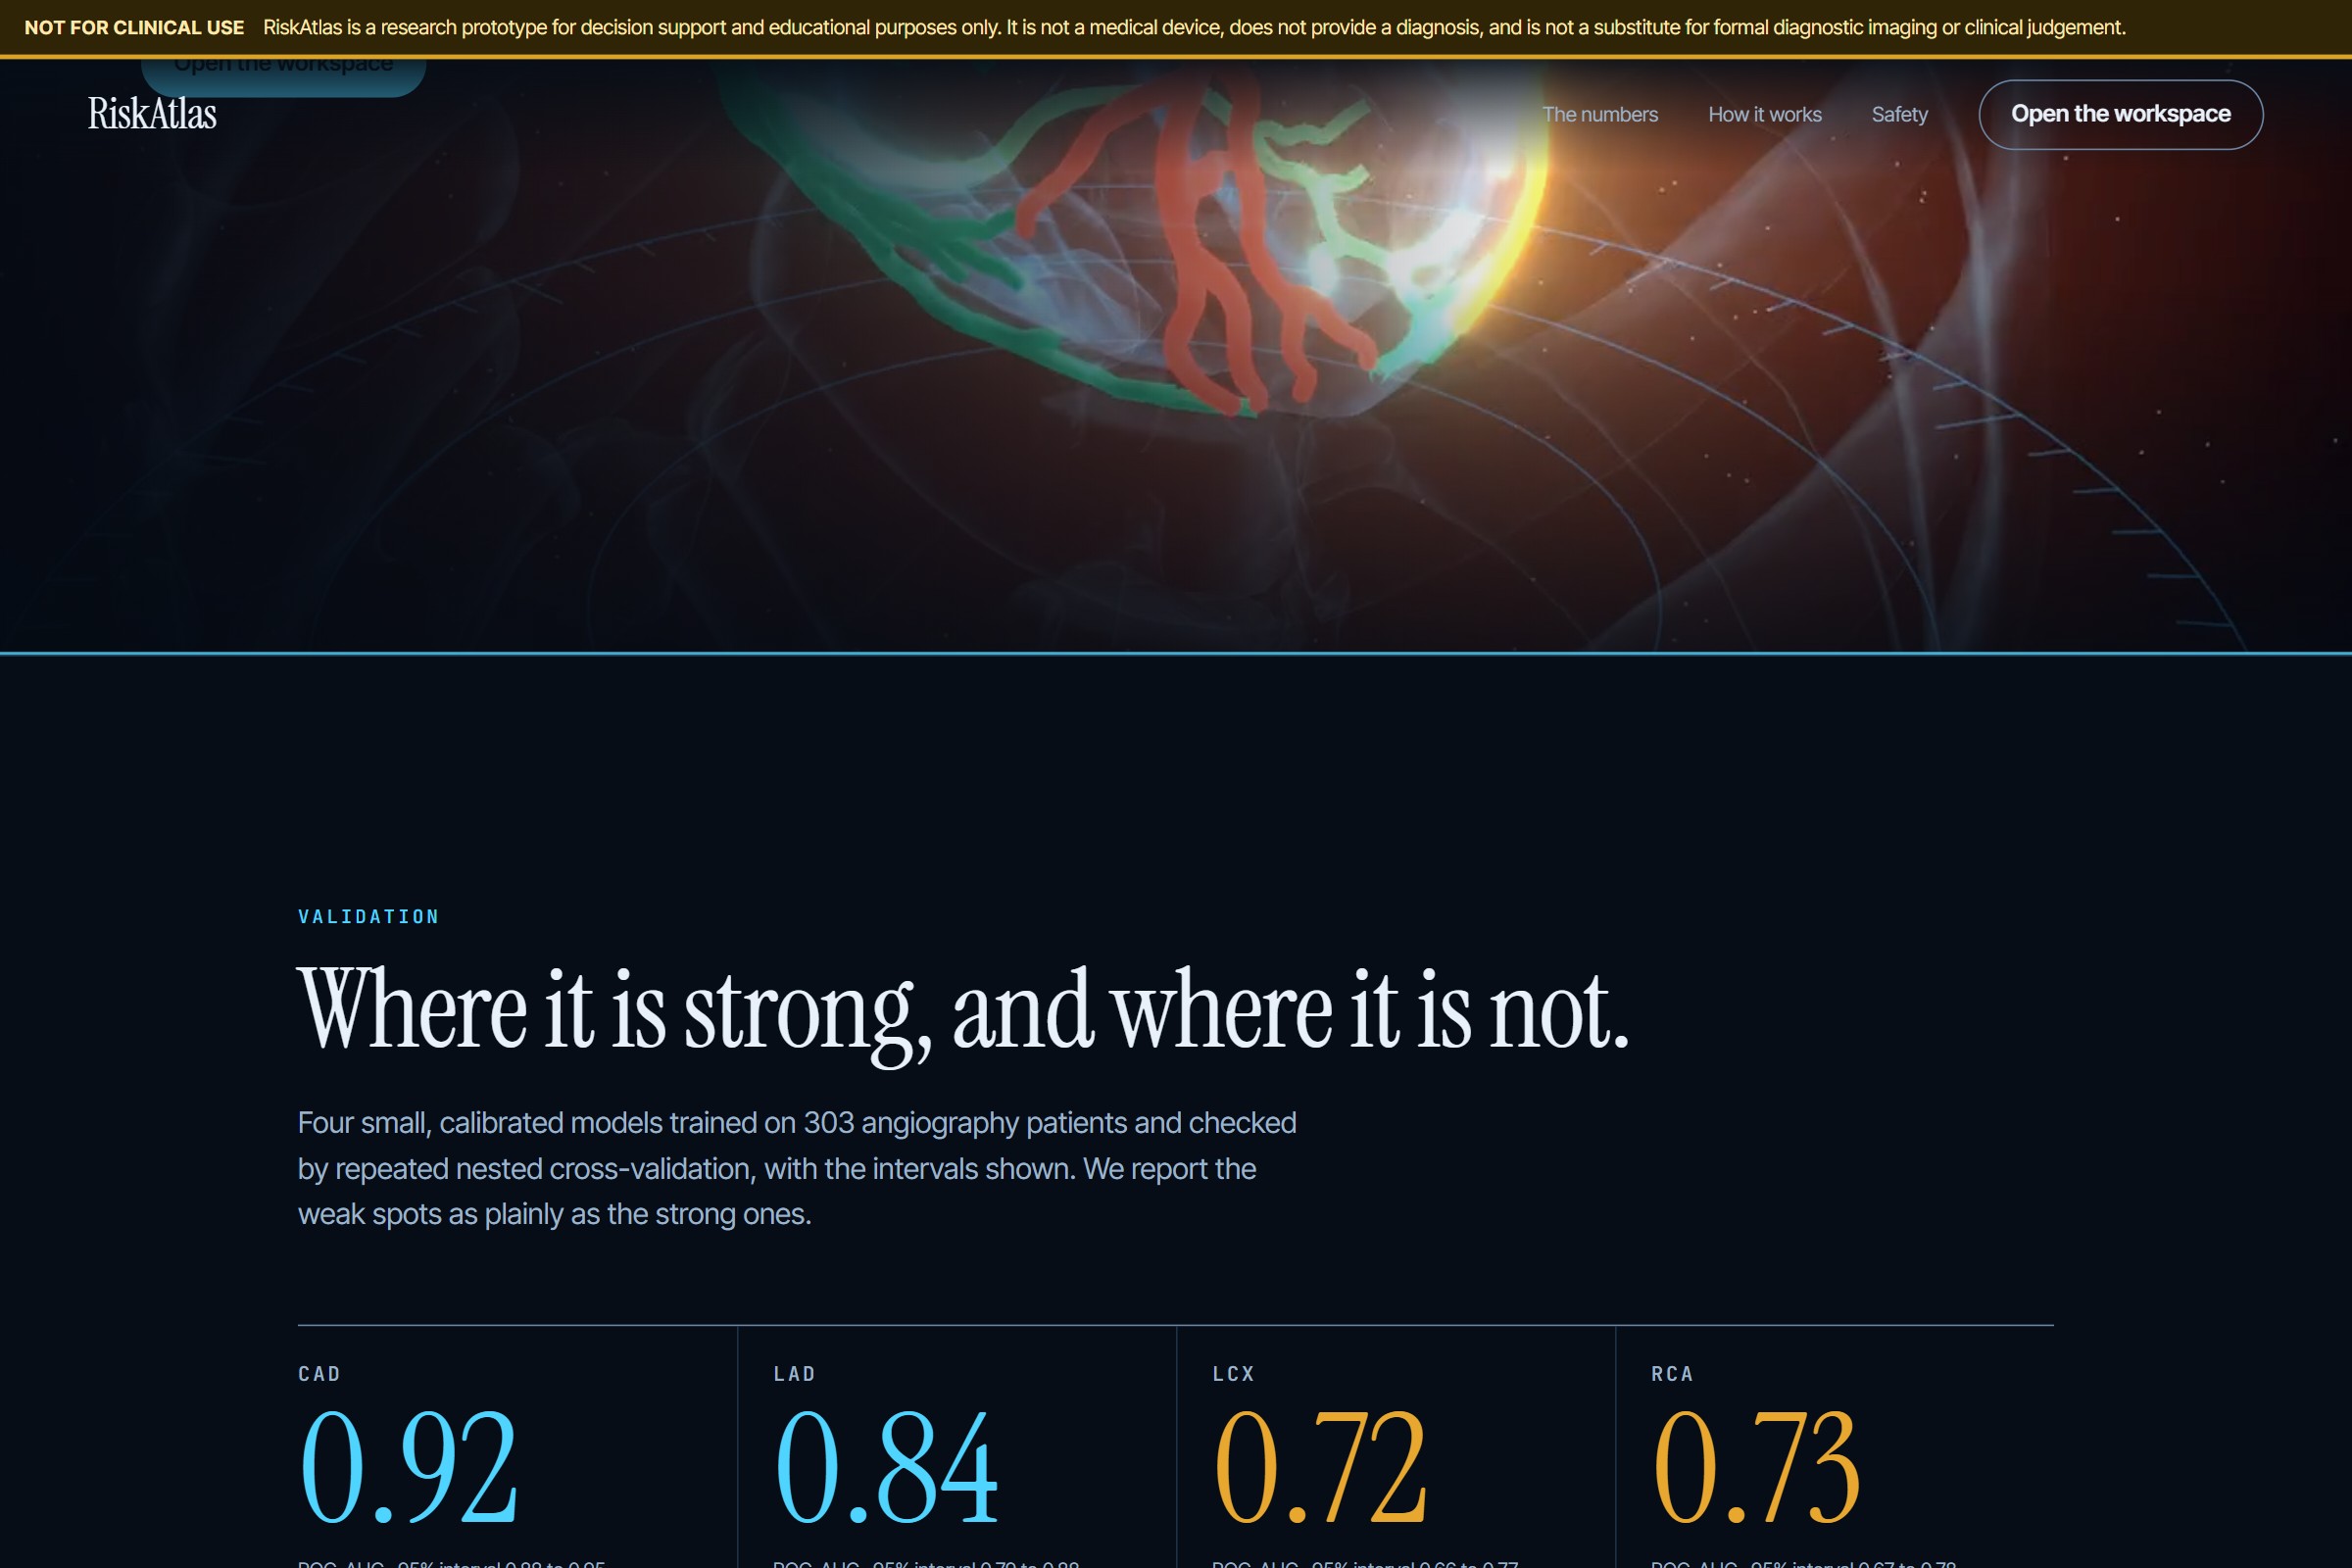
| Target | Cross-validated ROC-AUC [95% CI] |
|---|---|
| CAD | 0.92 [0.88, 0.95] |
| LAD | 0.84 [0.79, 0.88] |
| LCX | 0.72 [0.66, 0.77] |
| RCA | 0.73 [0.67, 0.78] |
- Every number is honestly validated, with intervals, and we report the result we didn't like too.
- Zero contradictions between the overall and per-artery predictions, by construction.
- External validation on 920 patients from 4 hospitals.
- Per-prediction uncertainty that genuinely tracks error, rendered directly on the 3D heart.
- The whole ML pipeline rebuilds from a clean clone with one command.
What we learned
- Validation design matters more than model choice on small clinical datasets.
- Domain structure (CAD ⇒ at least one blocked artery) beats bigger models. TabPFN, a state-of-the-art foundation model for small tables, gained less than 0.015 AUC and was too slow for real-time use. The limit is the information in the data, not the model.
- Honest uncertainty is a feature: showing how sure the model is builds more trust than a confident-looking number.
What's next for RiskAtlas
- More data and more sites, to tighten the intervals, especially for LCX and RCA.
- Lead-level ECG and imaging inputs, which carry location information that the current yes/no ECG flags don't.
- Report reading: upload a lab or echo report and have the form fill itself in.
- A clinician study, to test whether the 3D view and explanations actually improve understanding.
Built With
- docker
- fastapi
- javascript
- lime
- matplotlib
- numpy
- pandas
- pytest
- python
- react
- render
- scikit-learn
- scipy
- shap
- three.js
- typescript
- uvicorn
- vite
- vitest
- webgl
- xgboost


Log in or sign up for Devpost to join the conversation.