-
-
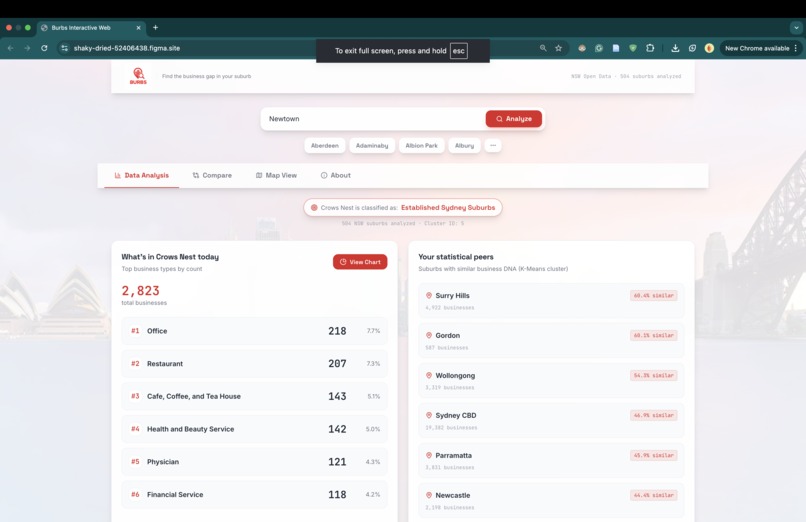
Burbs Home Page
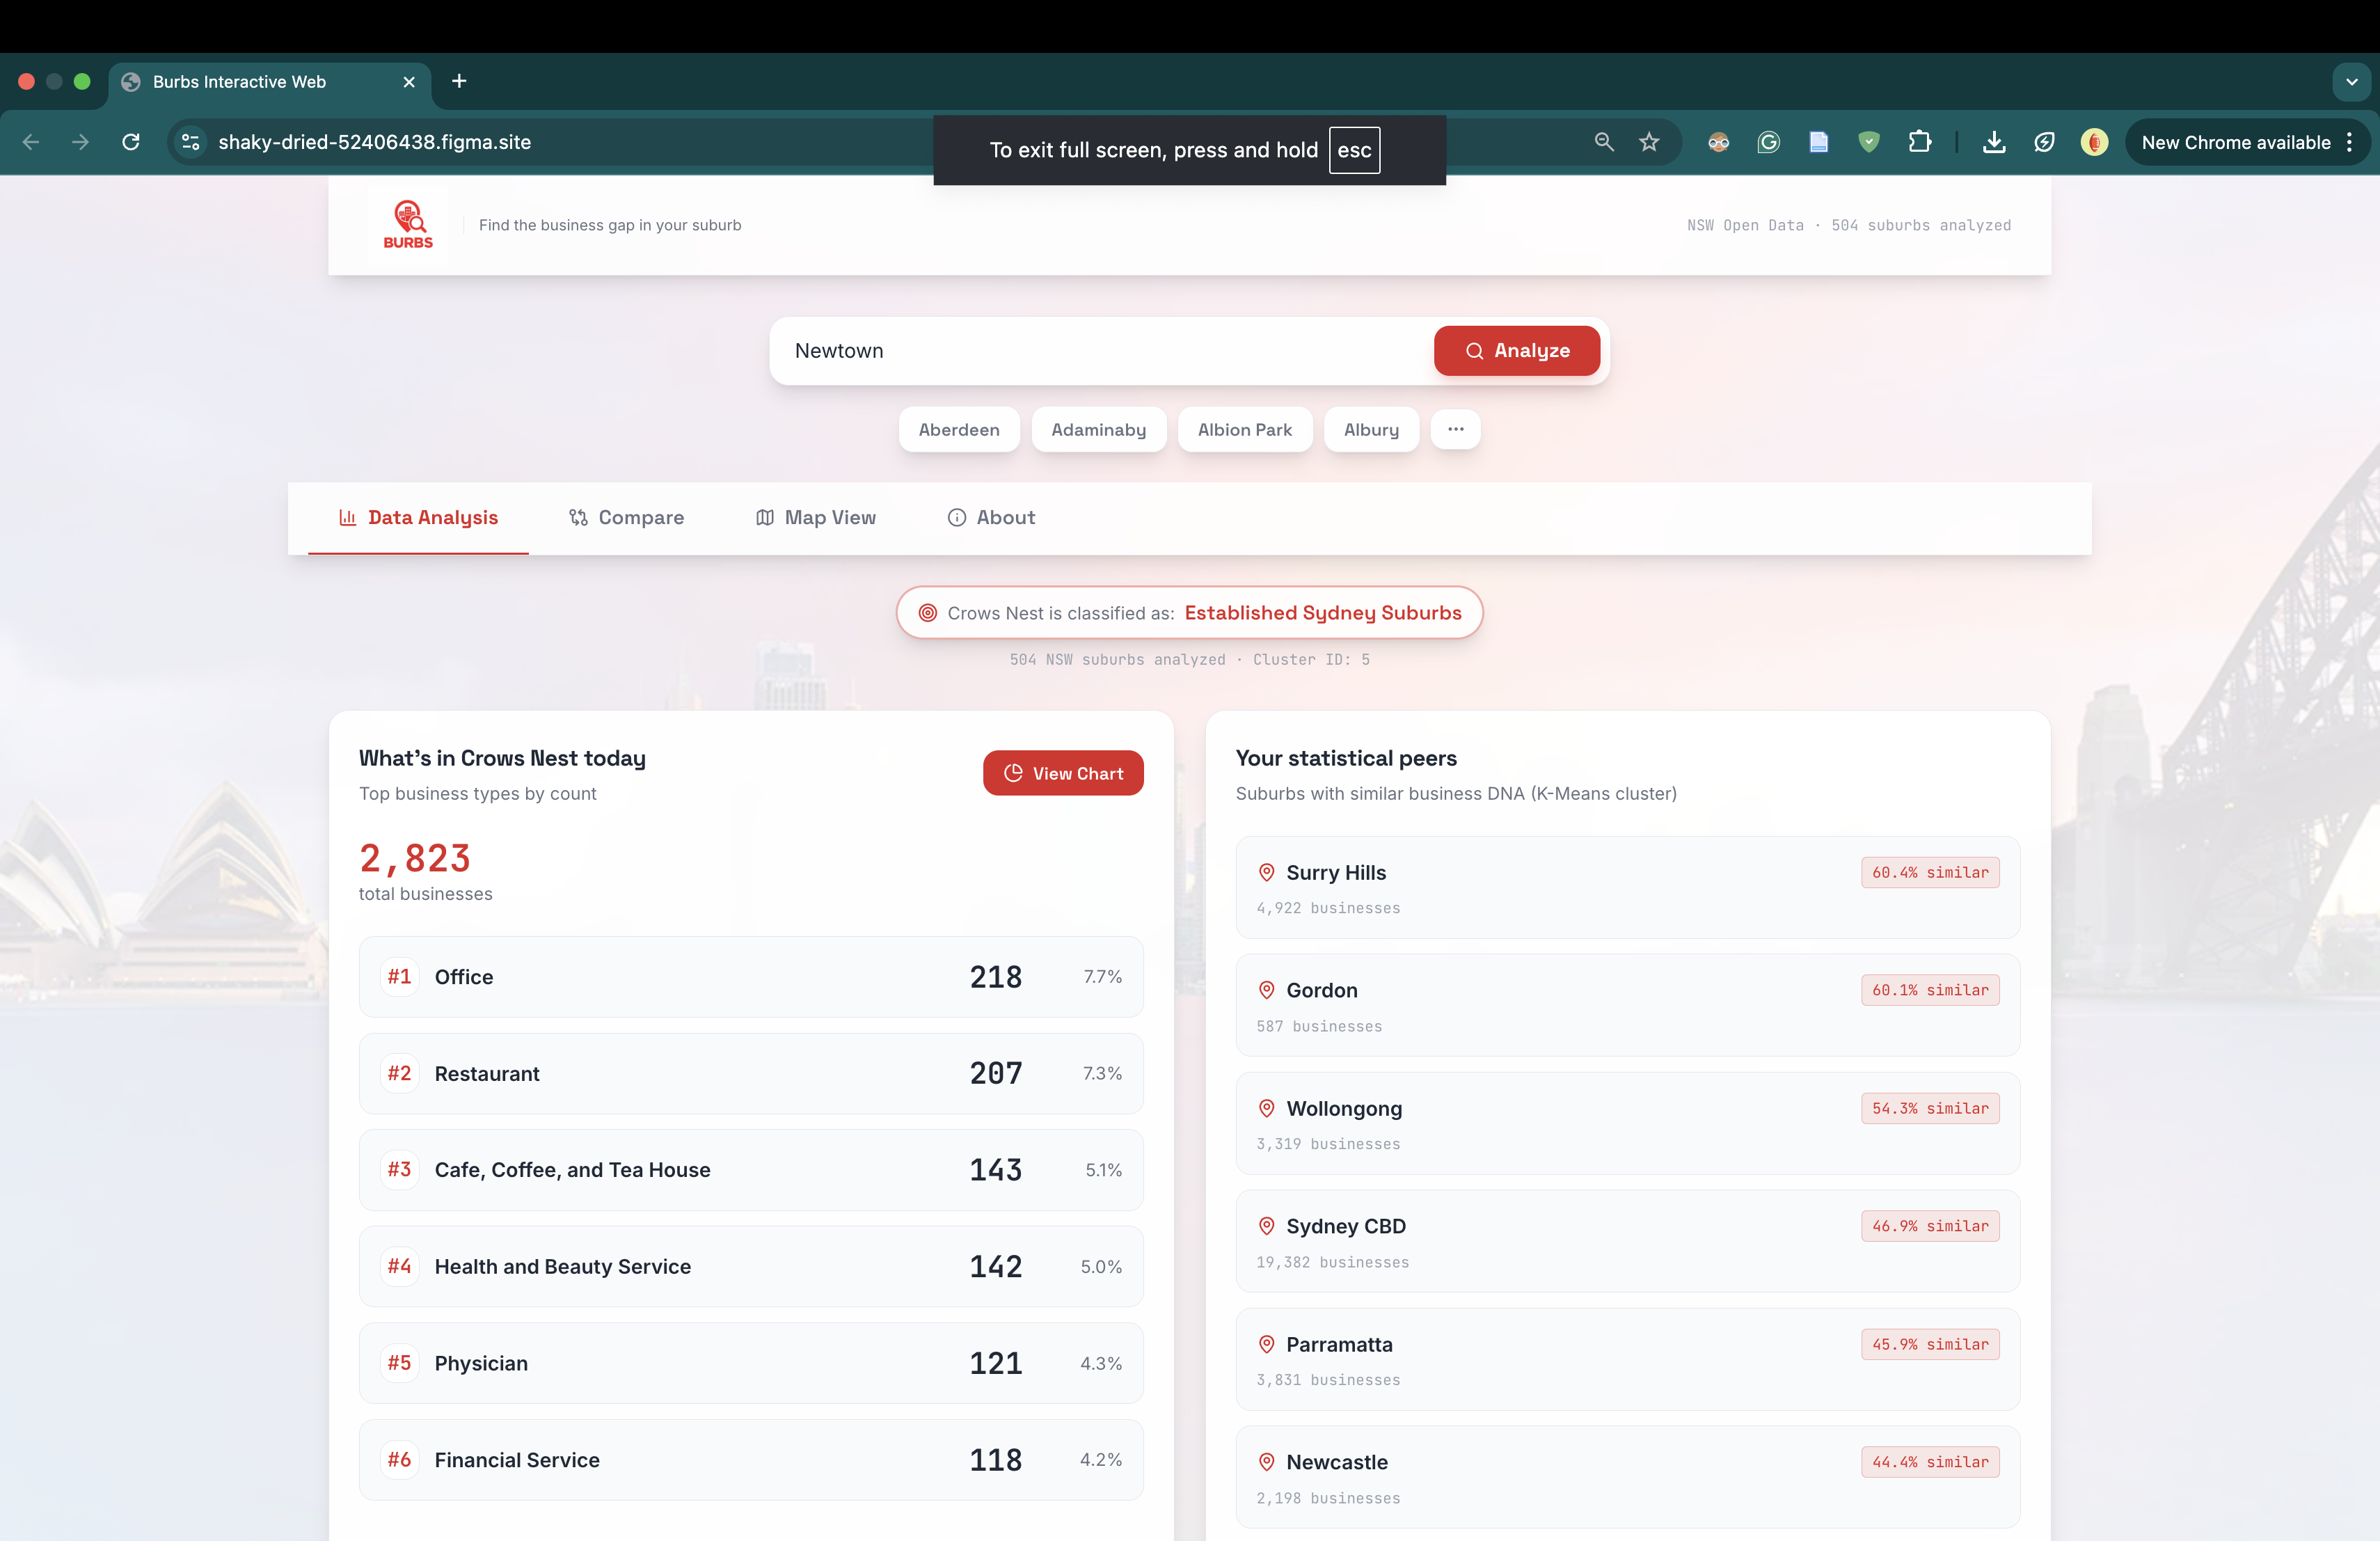
Inspiration
An estimated 20% of new small businesses in Australia fail in their first year, and up to 60% don't survive beyond five years, according to the Australian Small Business and Family Ombudsman (ASBFEO).¹
The most common reason isn't bad food, bad service, or bad luck — it's bad location decisions. Too much competition. Not enough demand. Wrong demographic.
Big retail chains spend tens of thousands on consultants to figure out where to open. Small business owners — the cafe dreamer, the family restaurateur, the first-time entrepreneur — are left to guess. Market research firms charge $10,000+ for a single suburb report. That's a barrier most aspiring owners can't clear.
We thought: what if you could replace expensive consultancy with free, honest data?
The breakthrough idea was simple. Instead of trying to predict what will succeed (impossible without a crystal ball), what if we just show what already does? Use machine learning to find suburbs statistically similar to yours, then surface what business types are thriving there but missing from your area.
That's how Burbs (suburb.au) was born.
What it does
Burbs is a web app for NSW small business owners trying to figure out what to open and where. Type in any NSW suburb, and within seconds you get:
- Your suburb's archetype — one of 8 K-Means-derived clusters (Inner-City Hospitality, Industrial & Trade Hubs, Country Towns, etc.)
- Your statistical peers — the most similar suburbs in NSW, ranked by Jensen-Shannon similarity on detailed business mix
- Opportunity gaps — business categories that thrive in your peer suburbs but are under-represented in yours, ranked by percentage point gap
- Real evidence — actual long-running businesses of those types operating in your peer suburbs (proof the model isn't hallucinating)
- A side-by-side comparison page — pick any two suburbs and see their similarity, business mix differences, and bidirectional gaps
- A geographic map view — using the Haversine formula to show which peers are physically near vs far
We don't guarantee success. We show you what already does.
How we built it
Data Pipeline (Python + DuckDB)
- Loaded Foursquare's Open Source Places dataset (Apache 2.0 licensed) via Hugging Face
- Filtered 1.5M Australian businesses → 447,031 NSW → 425,588 with valid metadata → 404,192 currently operating (filtered out closed businesses using
date_closed IS NULL) - Mapped postcodes to suburbs using Matthew Proctor's NSW postcode dataset, intersecting with most-frequent locality names
- Extracted Foursquare's hierarchical category taxonomy at Level 1 (10 broad categories) and Level 2 (~420 specific categories)
Machine Learning (scikit-learn + scipy)
- Clustering: Built a 508 × 10 suburb × category proportion matrix. Ran K-Means with k=8 (chosen via elbow method on inertia values 2–15). Used Euclidean distance — appropriate for proportion vectors where character matters more than magnitude.
- Similarity: For pairwise suburb comparison, switched from cosine similarity (which produced misleading 95%+ scores for everything) to Jensen-Shannon divergence — the standard metric for comparing probability distributions. This gave realistic spread (twin suburbs ~70%, very different ones ~20-30%).
- Gap Analysis: Compared each suburb's category proportions against the average of its cluster peers. Filtered to a hand-curated list of ~136 "commercially viable" categories (a small business owner could realistically open a cafe — they can't open a hospital).
Geographic Distance (Haversine Formula) For our map view, we used the Haversine formula to calculate true great-circle distances between suburbs based on latitude and longitude. This properly accounts for Earth's curvature instead of treating coordinates as a flat grid:
$$a = \sin^2\left(\frac{\Delta\varphi}{2}\right) + \cos(\varphi_1) \cdot \cos(\varphi_2) \cdot \sin^2\left(\frac{\Delta\lambda}{2}\right)$$
$$d = 2R \cdot \arctan\left(\sqrt{a}, \sqrt{1-a}\right)$$
Where $\varphi$ is latitude, $\lambda$ is longitude, and $R = 6,371$ km is Earth's radius.
This gave us two complementary views: K-Means tells you who shares your suburb's business DNA, while Haversine tells you who's physically nearby.
Frontend (React + TypeScript) The data pipeline exports a single ~3.6MB JSON file containing pre-computed analysis for all 508 suburbs. The frontend loads it once on startup — no backend, no database, no API calls. The whole app is a static site that loads in under a second.
Challenges we ran into
1. The "everything looks 95% similar" problem Our first version used cosine similarity, which gave nearly every pair of suburbs scores between 95% and 100%. The math was right, but the metric was wrong — cosine measures angle, not magnitude, so when all suburbs share a similar overall shape (food is always the biggest category), everything looks identical. We switched to Jensen-Shannon divergence, which is purpose-built for comparing probability distributions, and finally got meaningful spread.
2. The "Sydney" data trap
Foursquare's locality field contained "Sydney" as a value 80,000+ times — a generic catch-all where the actual suburb was unknown. This polluted our clusters. We rebuilt the suburb mapping using postcode → suburb whitelisting from Australia Post data, which gave us reliable assignments at the cost of slight imprecision (some postcodes contain multiple suburbs).
3. The 2010 evidence problem When we sorted businesses by founding date to surface "long-running businesses as proof," everything piled up at 2010. Turns out Foursquare did a major data ingestion in 2010, so any business that existed before then got stamped 2010-xx-xx. We couldn't claim "open since 2010" honestly. We reframed the language to "operating for at least 16 years" — same data, honest framing.
4. Closed businesses contaminating analysis
We initially included 43,000 closed businesses in our clustering and gap analysis. This meant Newtown's "520 restaurants" included restaurants that no longer existed. We refiltered at the source (date_closed IS NULL), which made the entire pipeline reflect "what's working right now" instead of "what historically existed."
5. The Compare page revealed an inconsistency Our peers panel showed "97% similar" while our Compare page showed "21% similar" for the same pair of suburbs — destroying credibility. The fix was to use the same metric (Jensen-Shannon on Level 2) in both places. Painful lesson in pipeline consistency.
What we learned
- Honest framing beats flashy claims. Our "we don't guarantee success, we show you what already does" tagline scored more credibility than any predictive accuracy claim ever could.
- Choosing the right distance metric matters more than choosing the right algorithm. K-Means is just a wrapper around Euclidean distance. The real choices are what to measure and how to compare.
- Data cleaning is 80% of the work. Postcode mapping, closed-business filtering, multi-category business handling, and category whitelist curation took longer than the actual ML.
- Pre-computation enables great UX. By doing all the heavy ML upfront and exporting to JSON, we got an instant-loading static site that scales to any number of users.
- Foursquare's
date_createdisn't business founding date. Always question what a column actually means before building features on it.
What's next for Burbs
- Population & demographic overlay — combine business mix with ABS census data to add a "demand signal" that distinguishes viable gaps from gaps caused by lack of demand
- Expand beyond NSW — same pipeline works for any Australian state once we add their postcodes, with potential to reach other states and eventually non-Australian markets
- Time-series analysis — track how suburb archetypes shift over Foursquare's release history (2018-2026), surfacing patterns of change
Sources
¹ Australian Small Business and Family Ombudsman (ASBFEO), via My Business — "5 reasons small businesses fail". Statistics also drawn from the Australian Bureau of Statistics (ABS) Counts of Australian Businesses, including Entries and Exits (CABEE).
Data:
- Foursquare Open Source Places, release dt=2026-04-14 (Apache 2.0 license)
- Matthew Proctor's Australian Postcodes dataset (community-maintained)
Built With
- cartodb
- css
- duckdb
- foursquare-os-places
- html
- huggingface-datasets
- jupyter-notebook
- leaflet.js
- numpy
- pandas
- python
- scikit-learn
- scipy

Log in or sign up for Devpost to join the conversation.