Project: Exploring Chaotic Dynamics with the Logistic Map in Python
Inspiration
The inspiration behind this project came from my fascination with chaos theory and its applications in various scientific and mathematical fields. I wanted to explore chaotic systems and visualize their behavior using Python, particularly the logistic map, a simple yet powerful chaotic system. The logistic map is a discrete-time, one-dimensional map that exhibits chaotic behavior for certain parameter values. I was curious to observe how changing the parameter values would lead to different patterns and behaviors.
What I Learned
Throughout this project, I learned about chaotic dynamics, discrete dynamical systems, and the logistic map equation. I also gained experience in using Python for data visualization, which allowed me to observe and understand chaotic behavior more intuitively. Additionally, I deepened my understanding of random number generation and its role in chaotic systems.
Building the Project
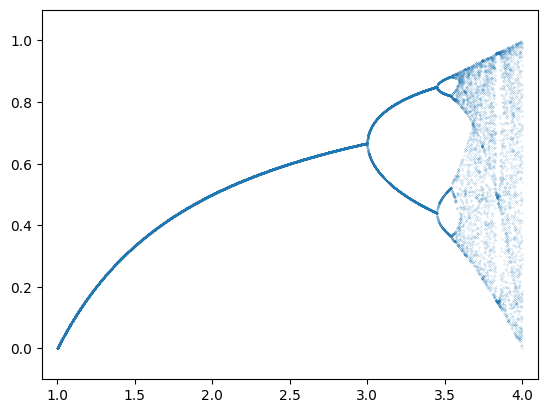
I built the project using Python and the pylab module, which provides a MATLAB-like interface for data plotting. I used the logistic map equation x = x * r * (1 - x) to generate the iterations and observed the system's behavior by plotting the values of x against different parameter values r.
The project's core consists of two main functions:
logisticmap(x, r): This function calculates the next value ofxbased on the logistic map equation with the given parameterr.iterate(n, x, r): This function iterates the logistic mapntimes, starting from the initial valuexwith the given parameterr.
I then used a loop to iterate through a range of parameter values r and plotted the resulting x values using the scatter function from pylab. The randint function was used to introduce randomness in the iterations, providing a glimpse of the system's sensitivity to initial conditions.
Challenges Faced
One of the challenges I faced was ensuring the appropriate range and spacing of parameter values r for meaningful visualizations. Choosing suitable values was essential to capture the different dynamic behaviors of the logistic map. Additionally, it took some time to fine-tune the visualization parameters, such as plot size and point size, to create a clear and informative plot.
Another challenge was understanding the concept of chaos theory and the logistic map equation itself. As chaos theory involves complex mathematical concepts, I had to spend some time studying and understanding the underlying principles to effectively implement the project.
Overall, this project was a great learning experience, and it allowed me to dive into the fascinating world of chaotic dynamics. I gained valuable insights into chaos theory, data visualization, and Python programming, which will undoubtedly benefit me in future projects and explorations.
Conclusion
Exploring chaotic dynamics using the logistic map in Python was a rewarding and intellectually stimulating experience. The visualizations provided intriguing insights into the behavior of chaotic systems, showcasing the complexity that arises from simple mathematical equations. This project has sparked my interest in exploring more chaotic systems and their applications in different domains. I hope to continue my journey in chaos theory and contribute to further research and understanding of these fascinating phenomena.
Built With
- and-animated-visualizations.-it-could-also-be-used-for-data-plotting-and-visualization
- but-in-this-project
- interactive
- matplotlib
- or-apis-were-utilized-in-this-project
- pylab
- pylab`-was-preferred-for-its-simplicity.-no-cloud-services
- python

Log in or sign up for Devpost to join the conversation.