Inspiration
Major League Hacking is my inspiration.
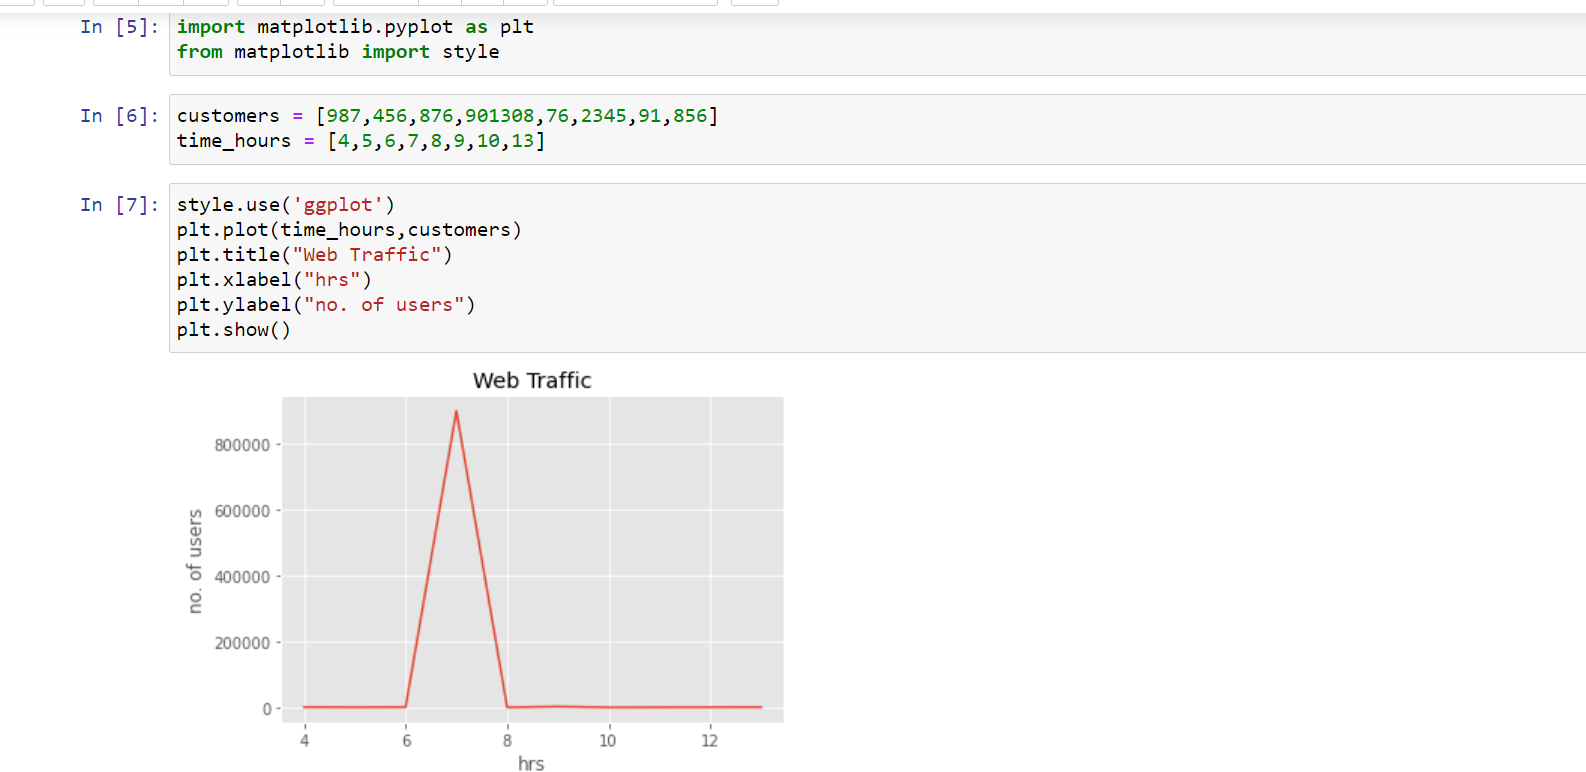
What it does
It visualizes the relation between traffic and time on a certain website.
How we built it
I built it using python.
import matplotlib.pyplot as plt
from matplotlib import style
customers = [987,456,876,901308,76,2345,91,856]
time_hours = [4,5,6,7,8,9,10,13]
style.use('ggplot')
plt.plot(time_hours,customers)
plt.title("Web Traffic")
plt.xlabel("hrs")
plt.ylabel("no. of users")
plt.show()
Challenges we ran into
A new subject is always a challenge.
Accomplishments that we're proud of
I am proud of taking this challenge.
What we learned
I learned data visualization.
What's next for Build a Data Visualization
Probably using some bigger data sets.
Built With
- data
- python
- visualization


Log in or sign up for Devpost to join the conversation.