-
data-prediction
Build a Data Visualization
Data science is one of the fastest growing fields in tech. There are so many different ways to visualize data. It can be as simple as a graph or as complex as a piece of art. Show off your visualization
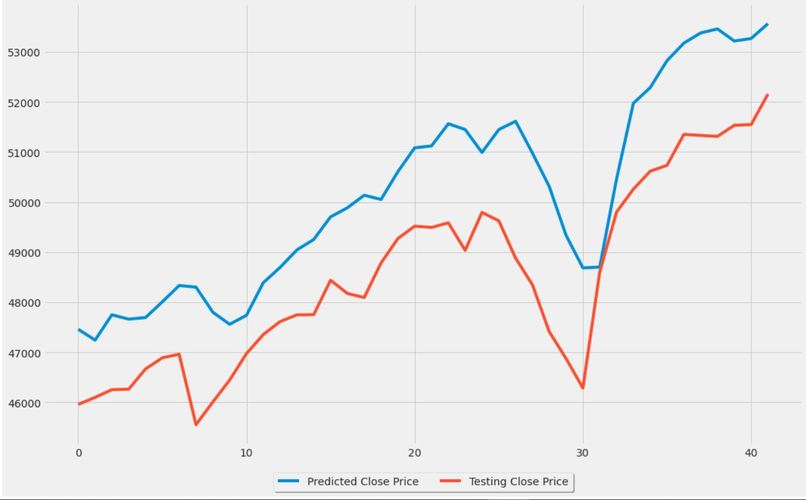
Stock Market Prediction using Numerical and Textual Analysis
Create a hybrid model for stock price/performance prediction using numerical analysis of historical stock prices, and sentimental analysis of news headlines
Stock to analyze & predict - SENSEX (S&P BSE SENSEX)
- Download historical stock prices (^BESN.csv) : https://finance.yahoo.com
- Download textual (news) data from https://bit.ly/36fFPI6"

Log in or sign up for Devpost to join the conversation.