-
-
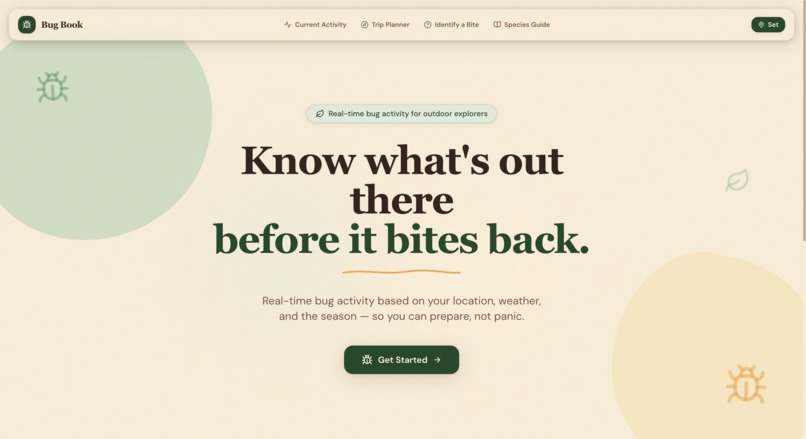
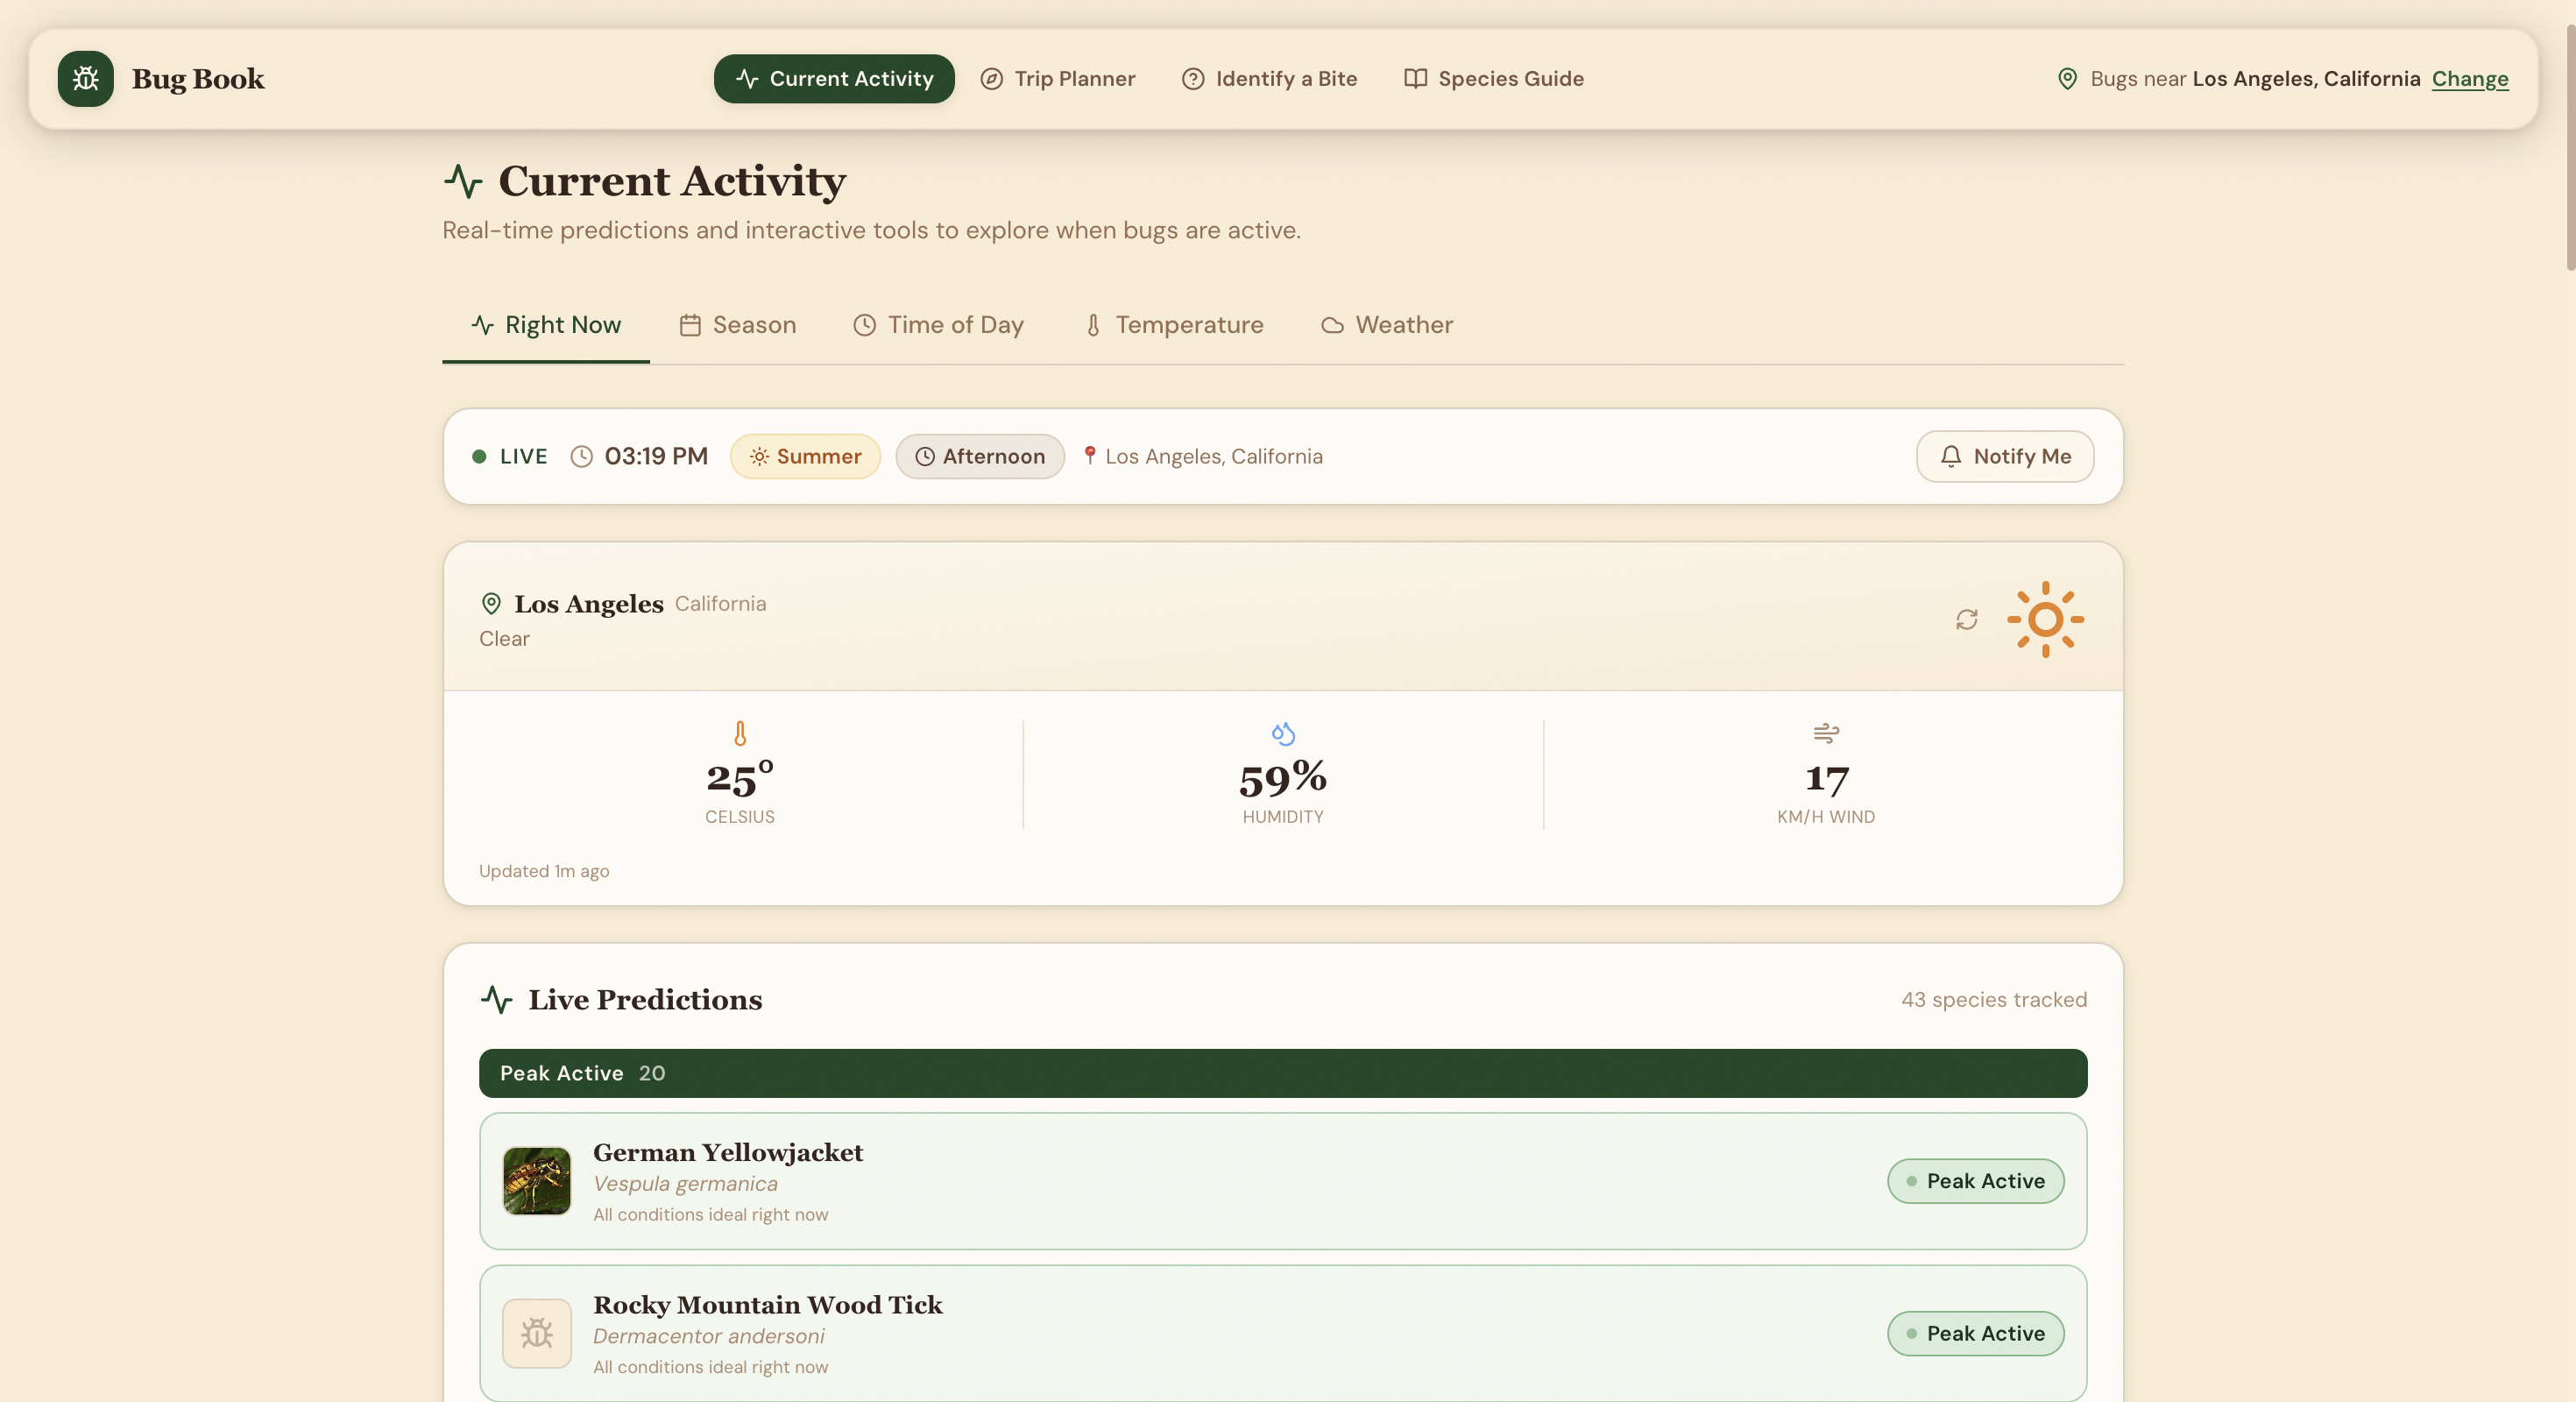
Home Page
-
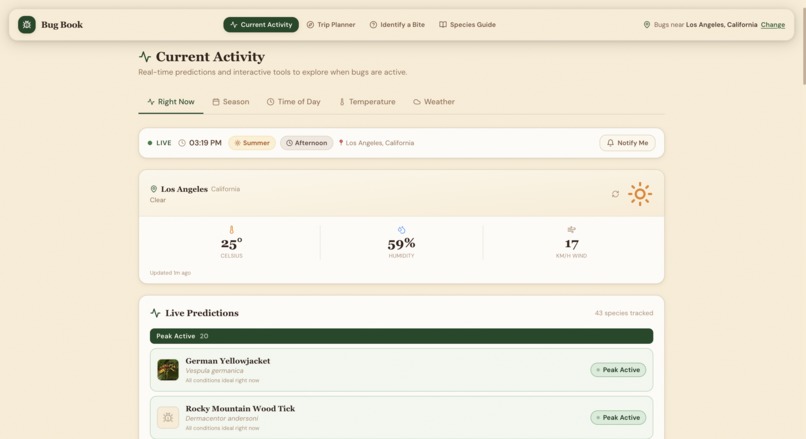
Activity Tracker
-
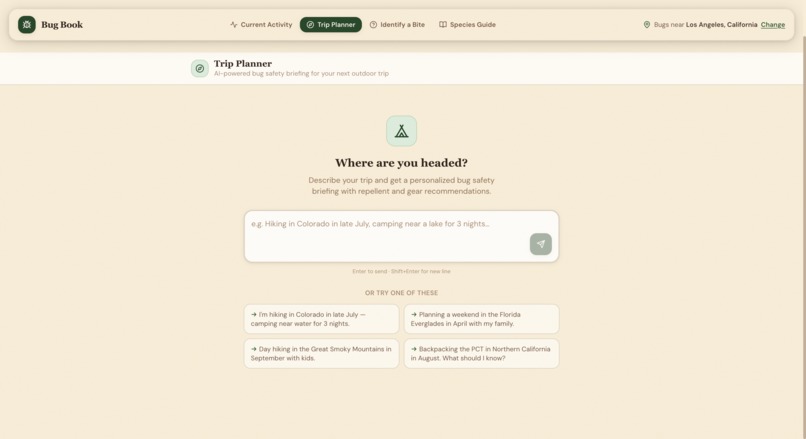
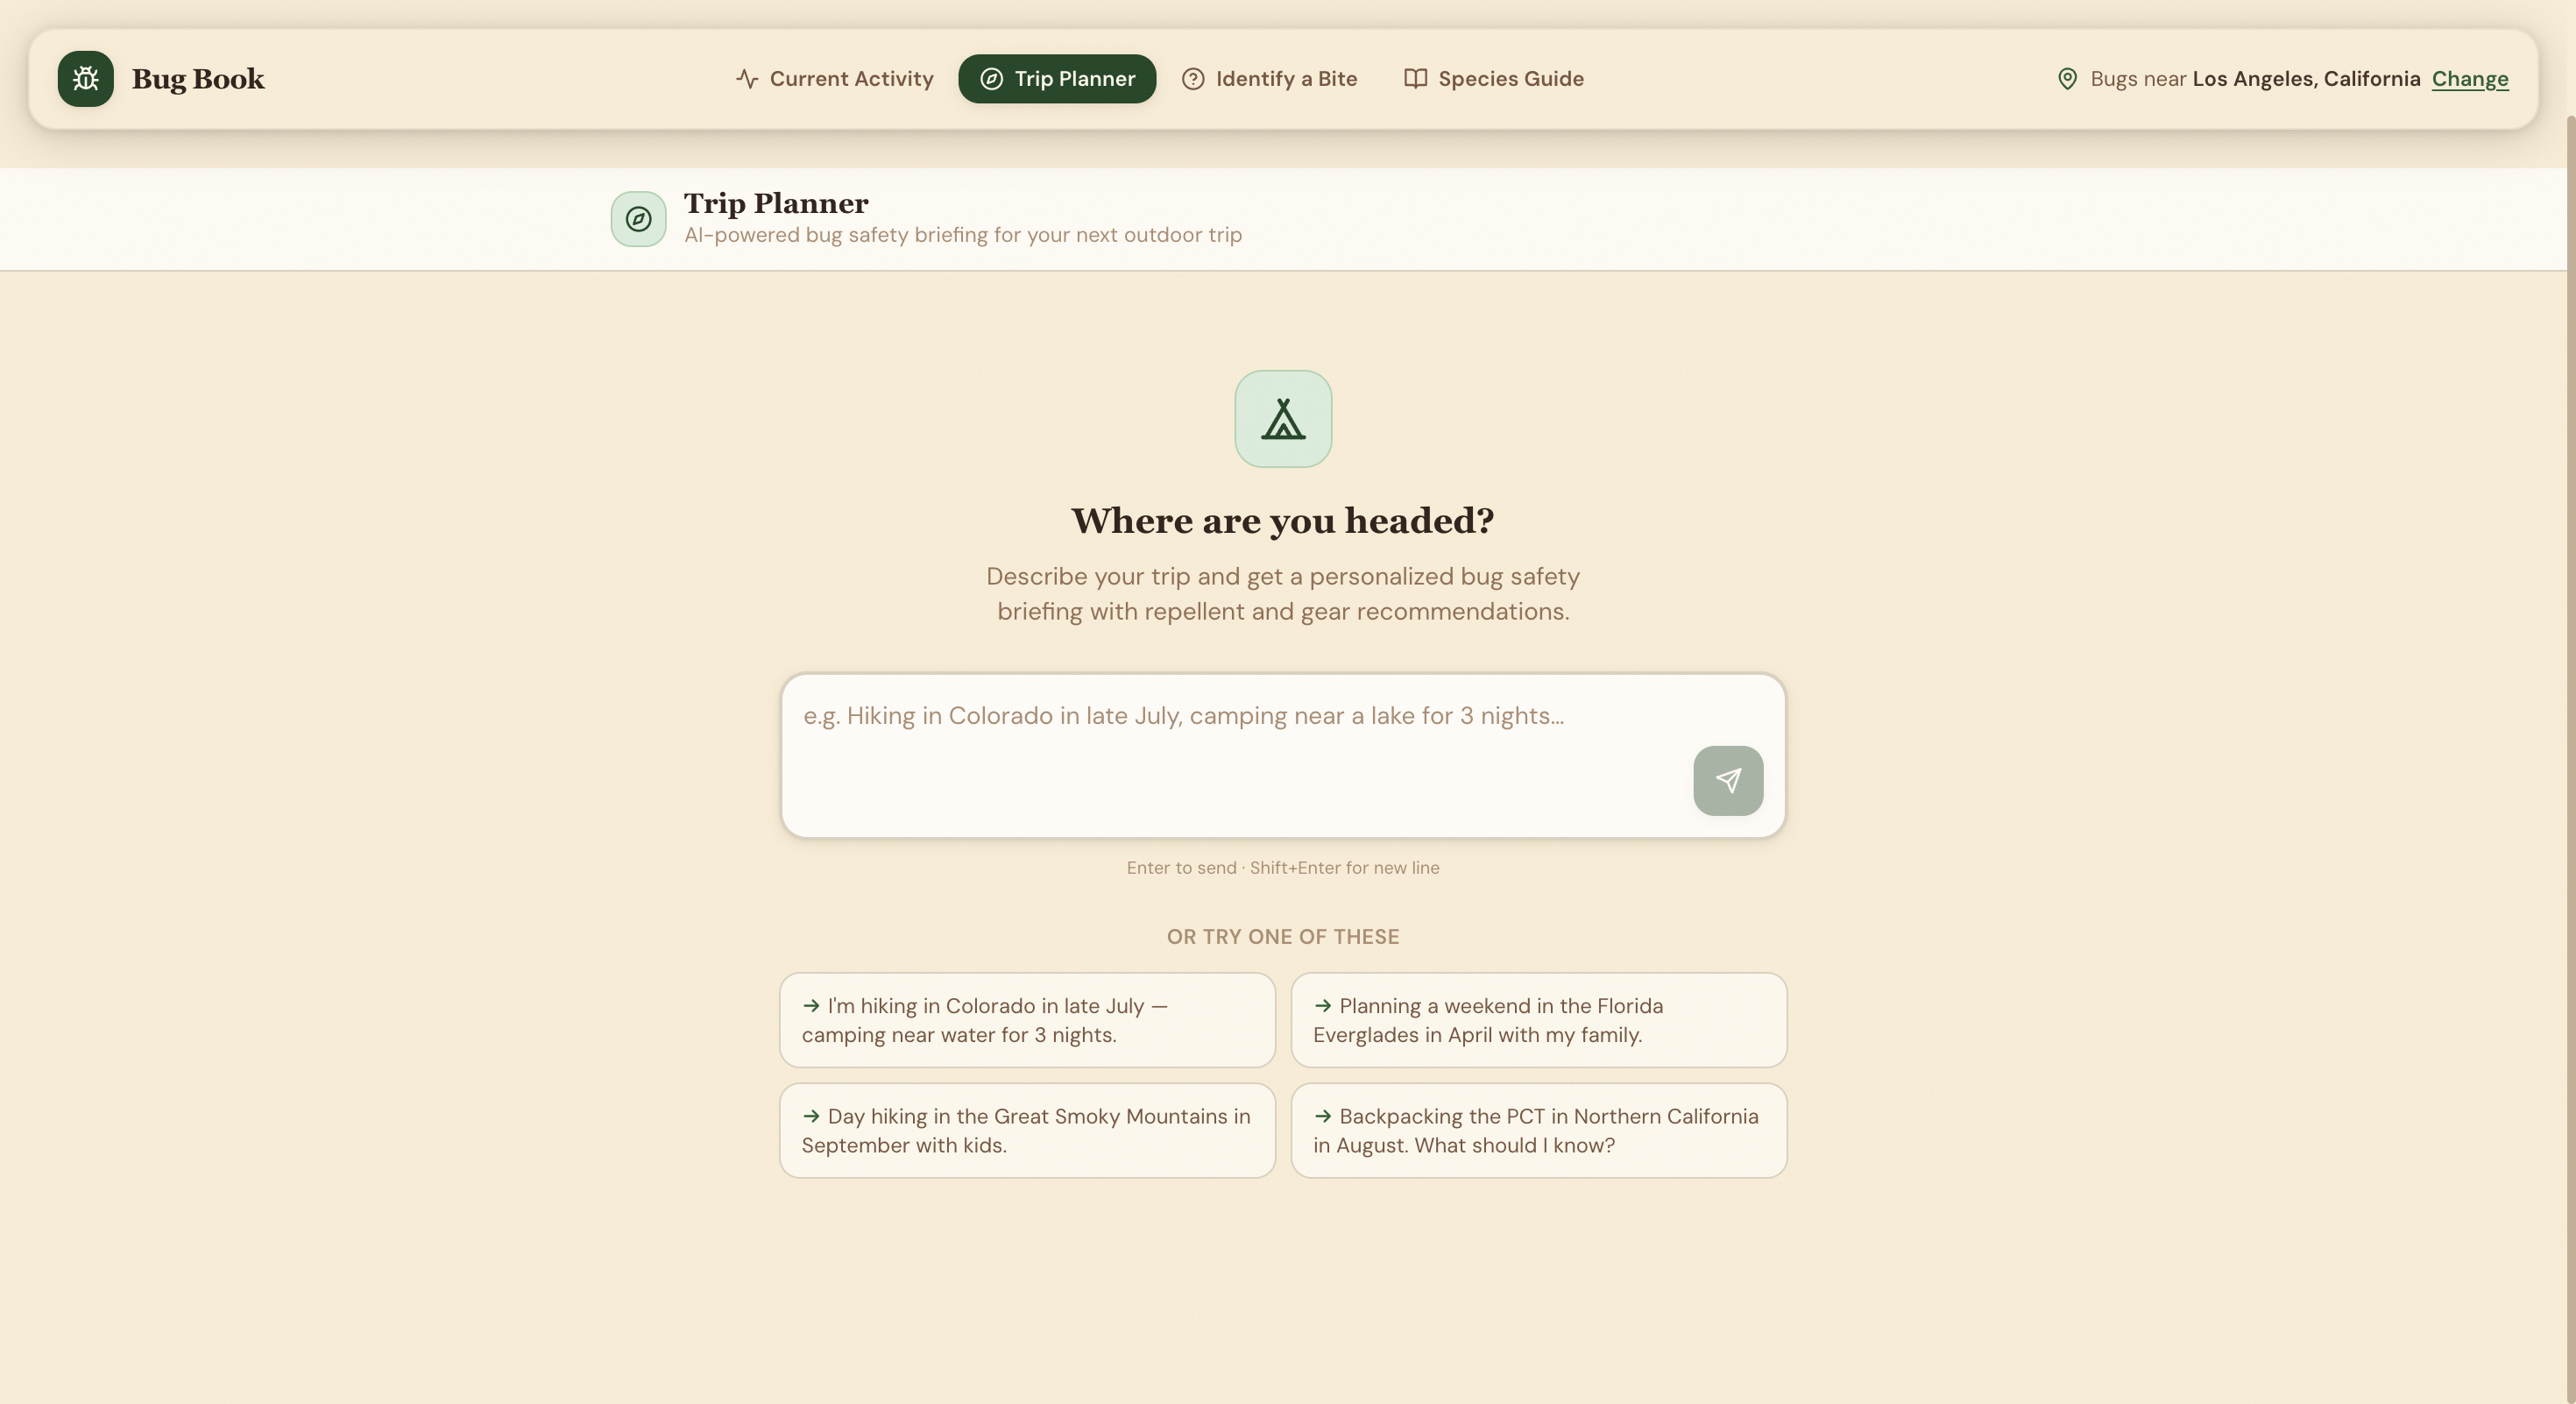
Trip Planner
-
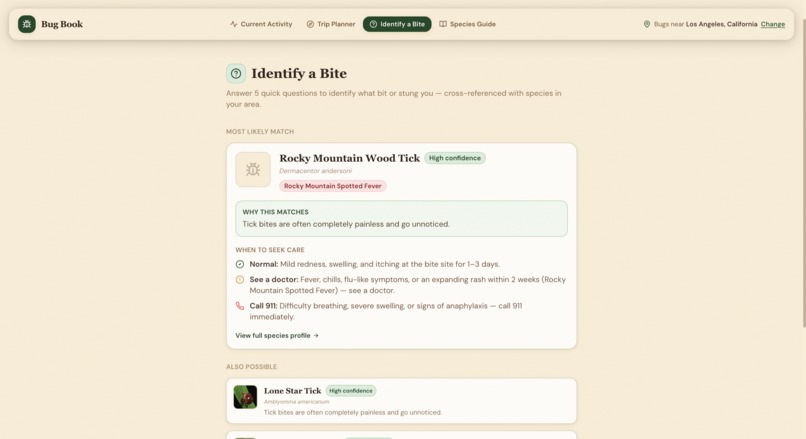
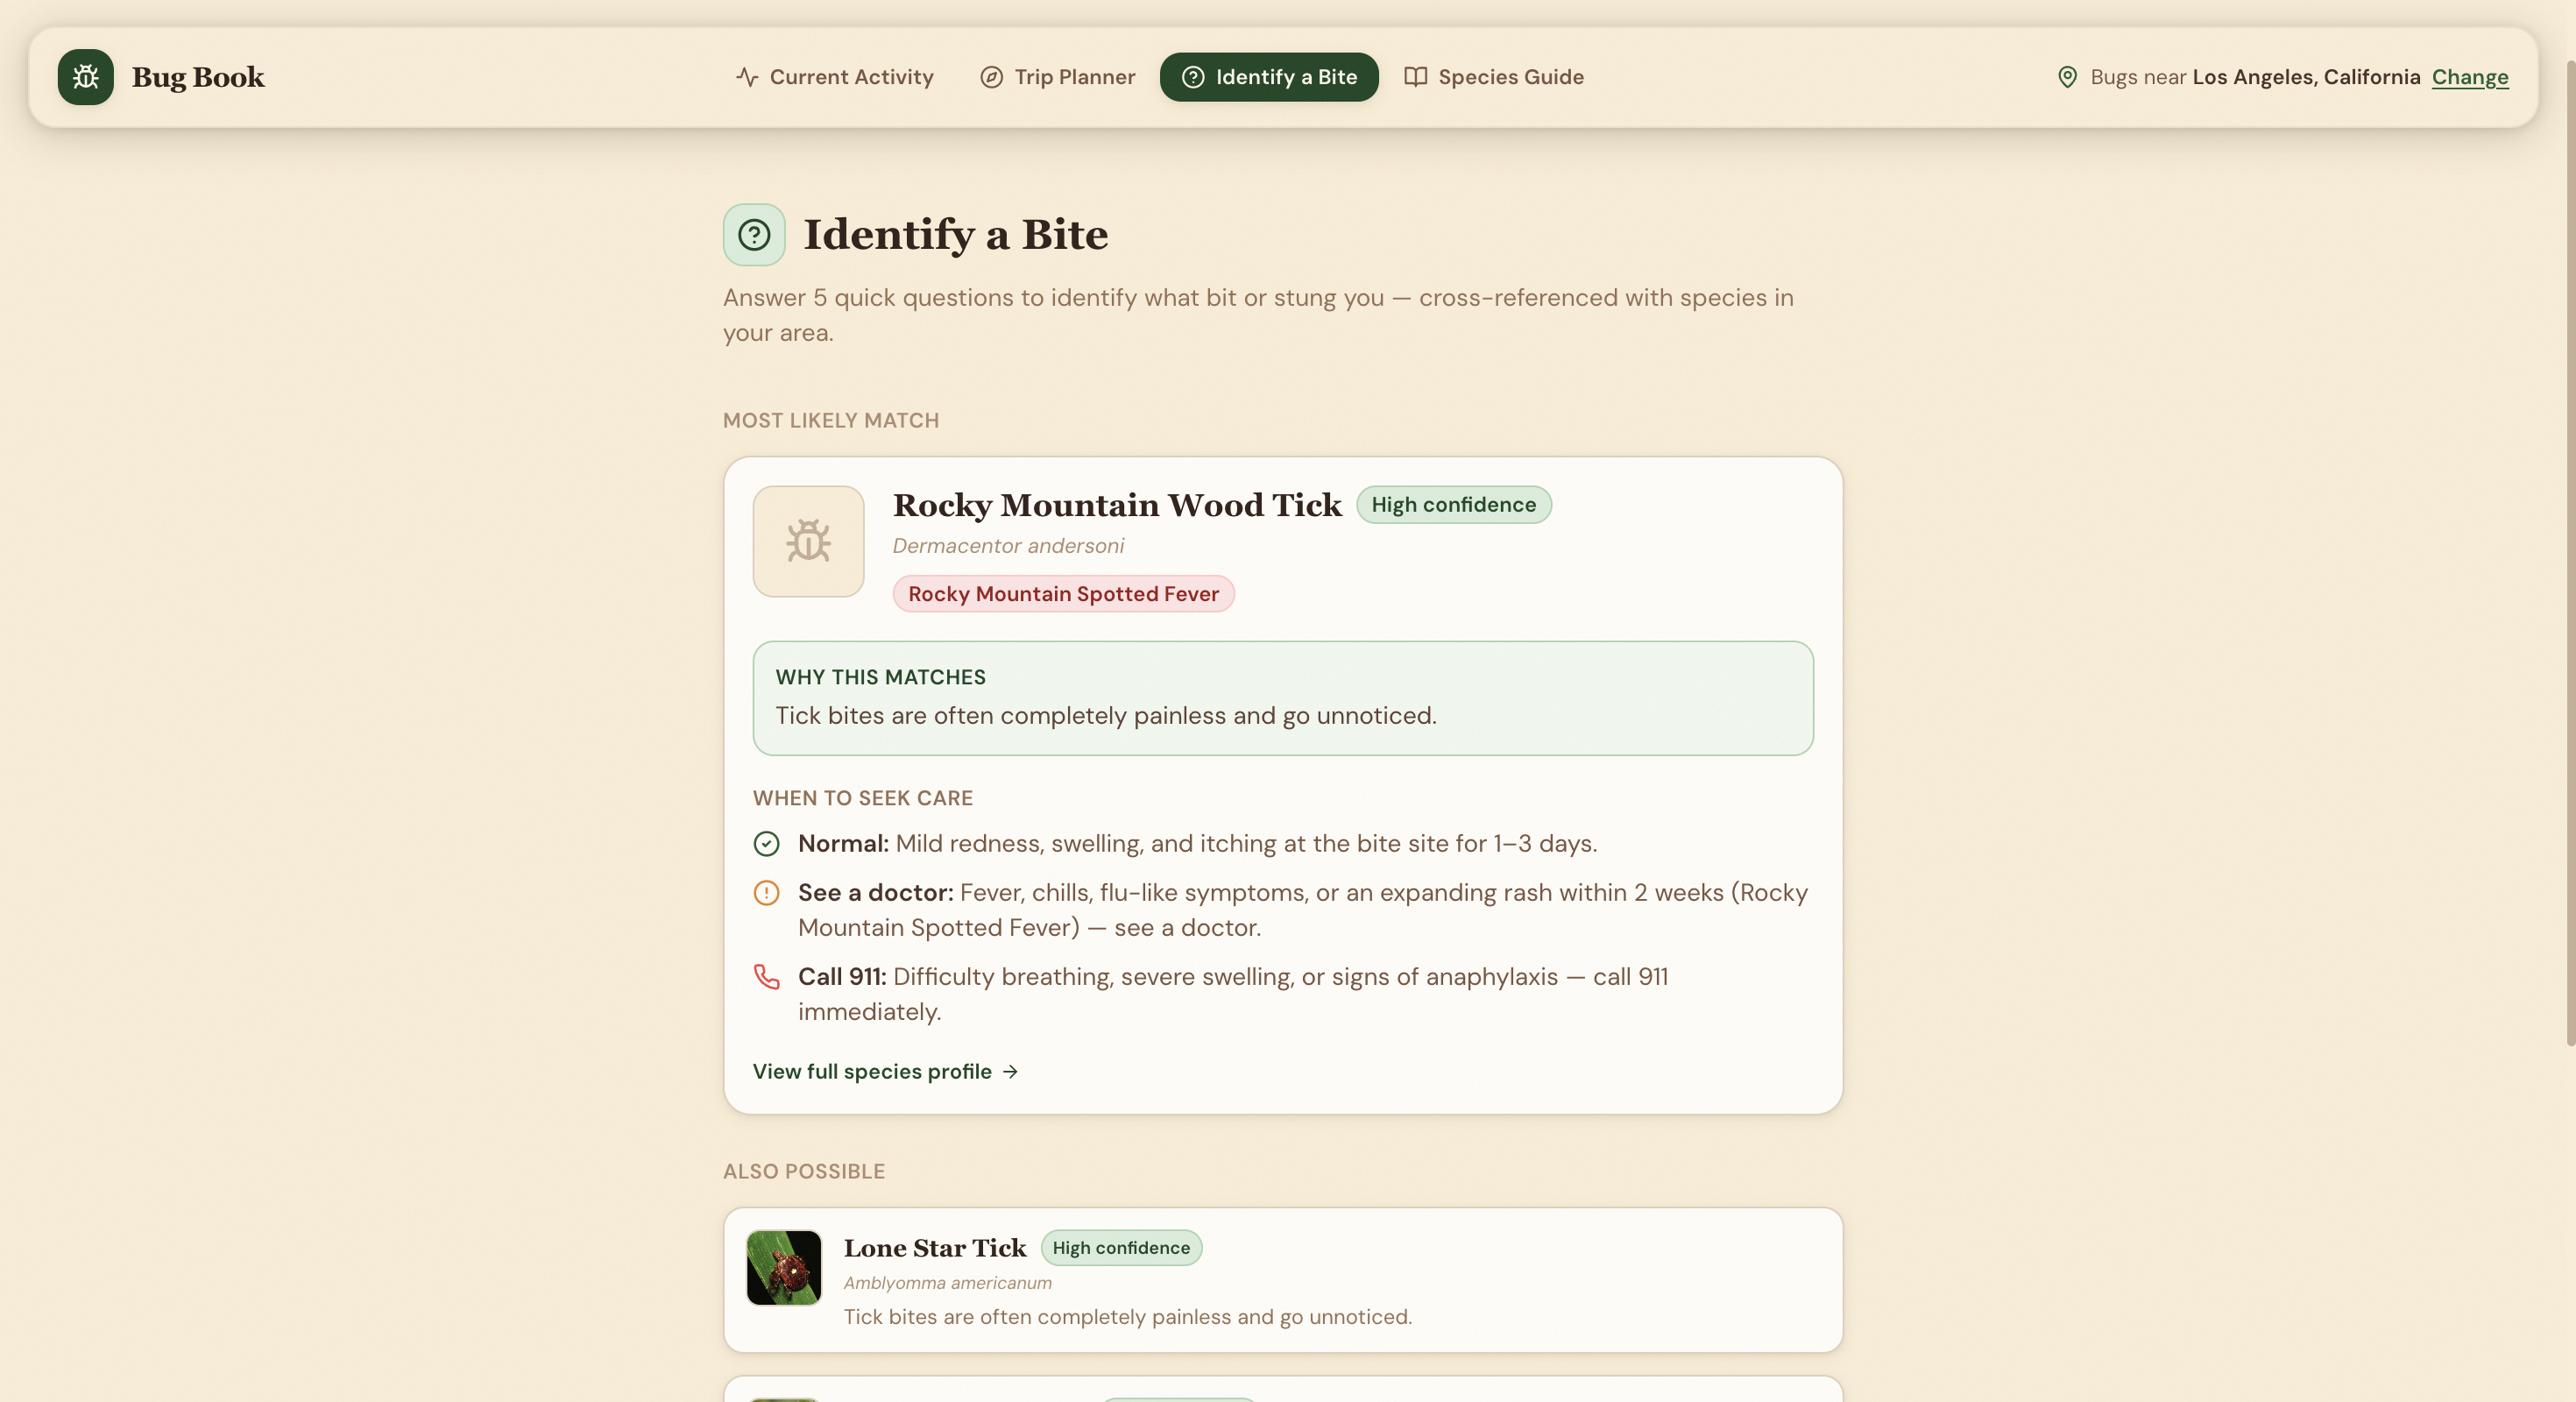
Bug Bite Identifier
-
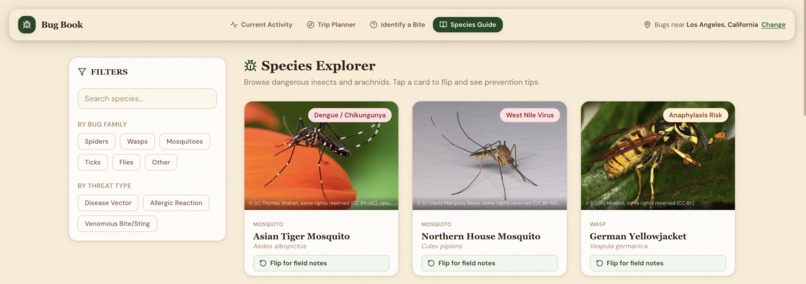
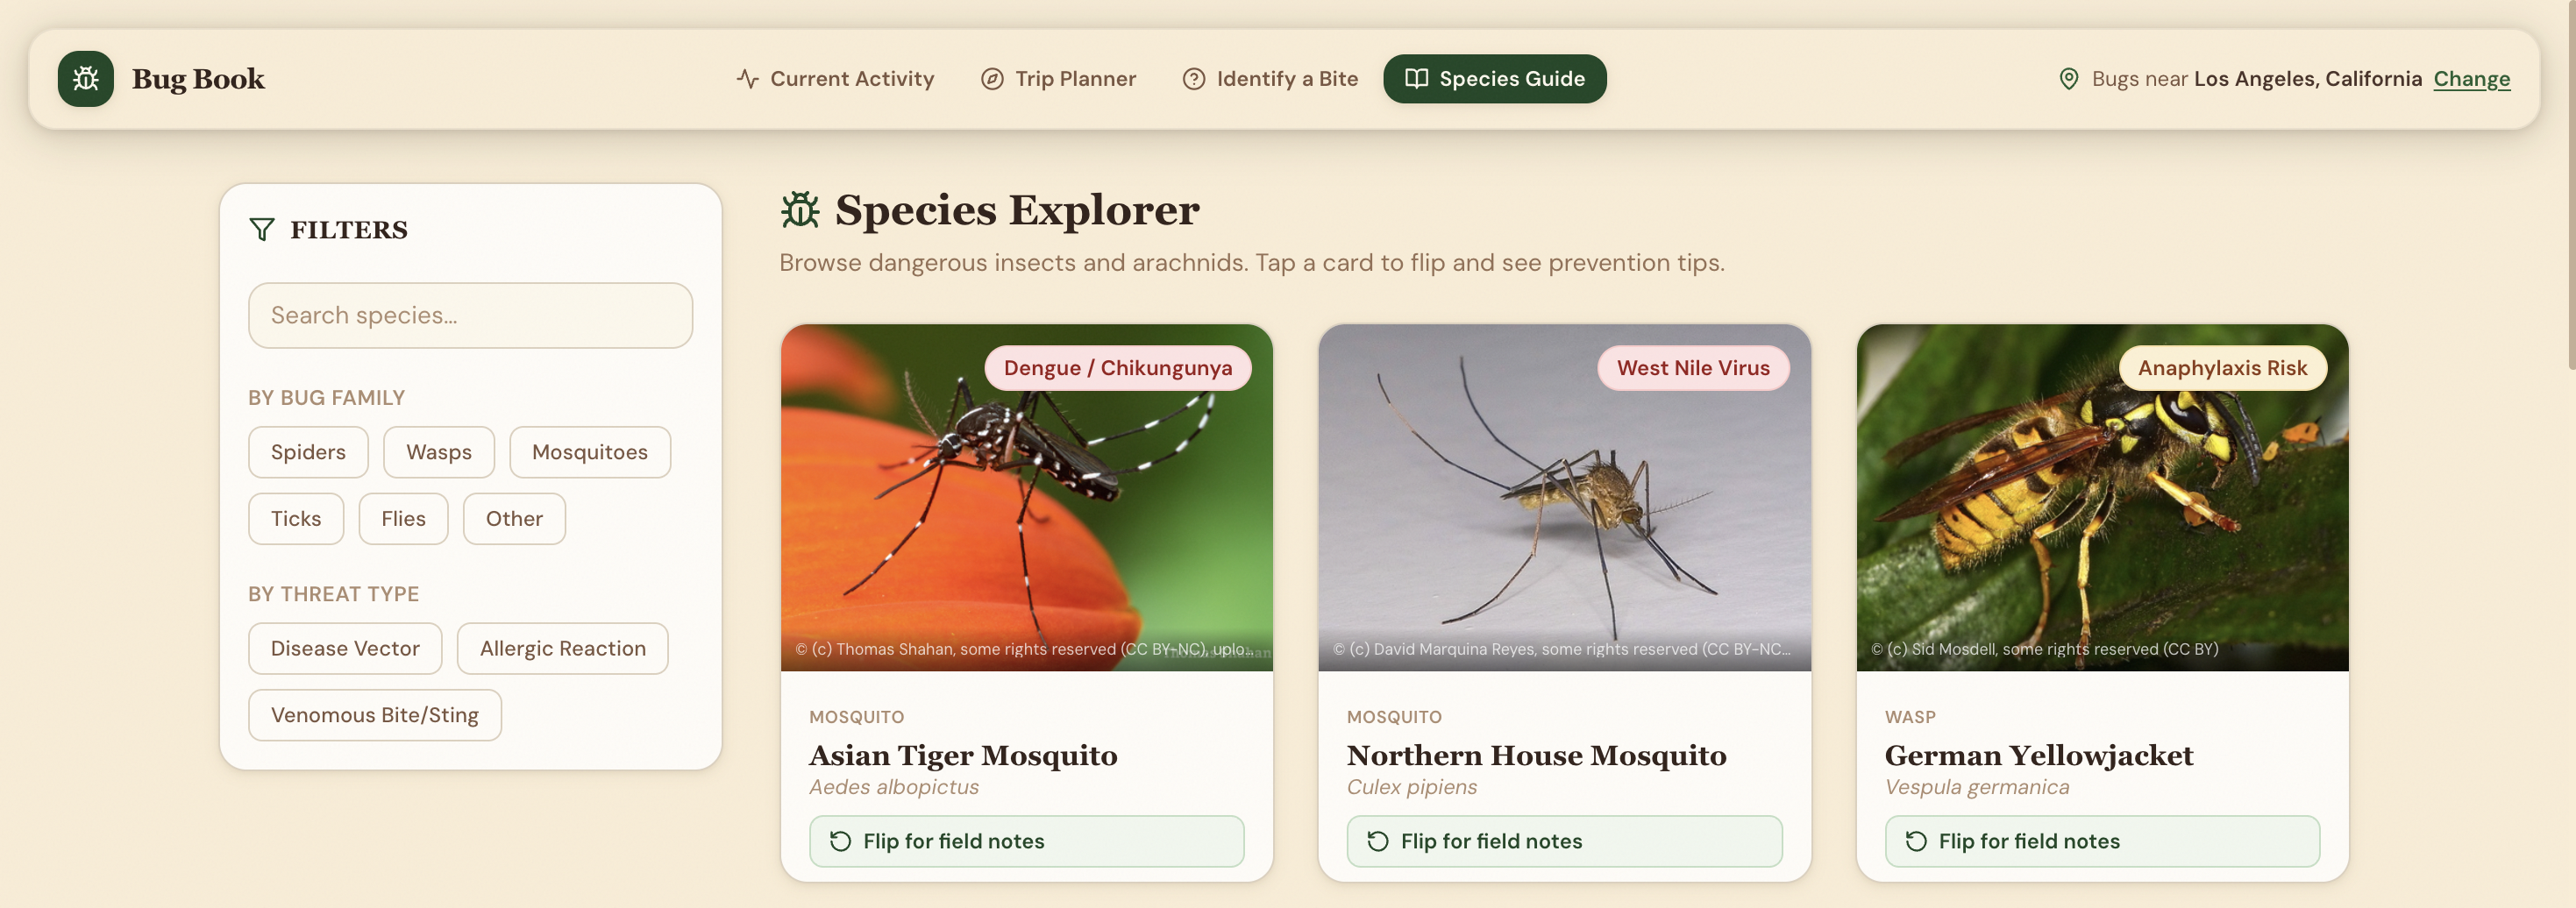
Species Guide
-
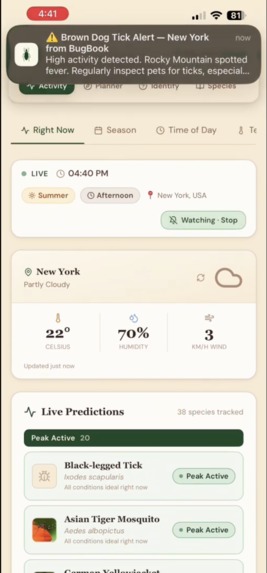
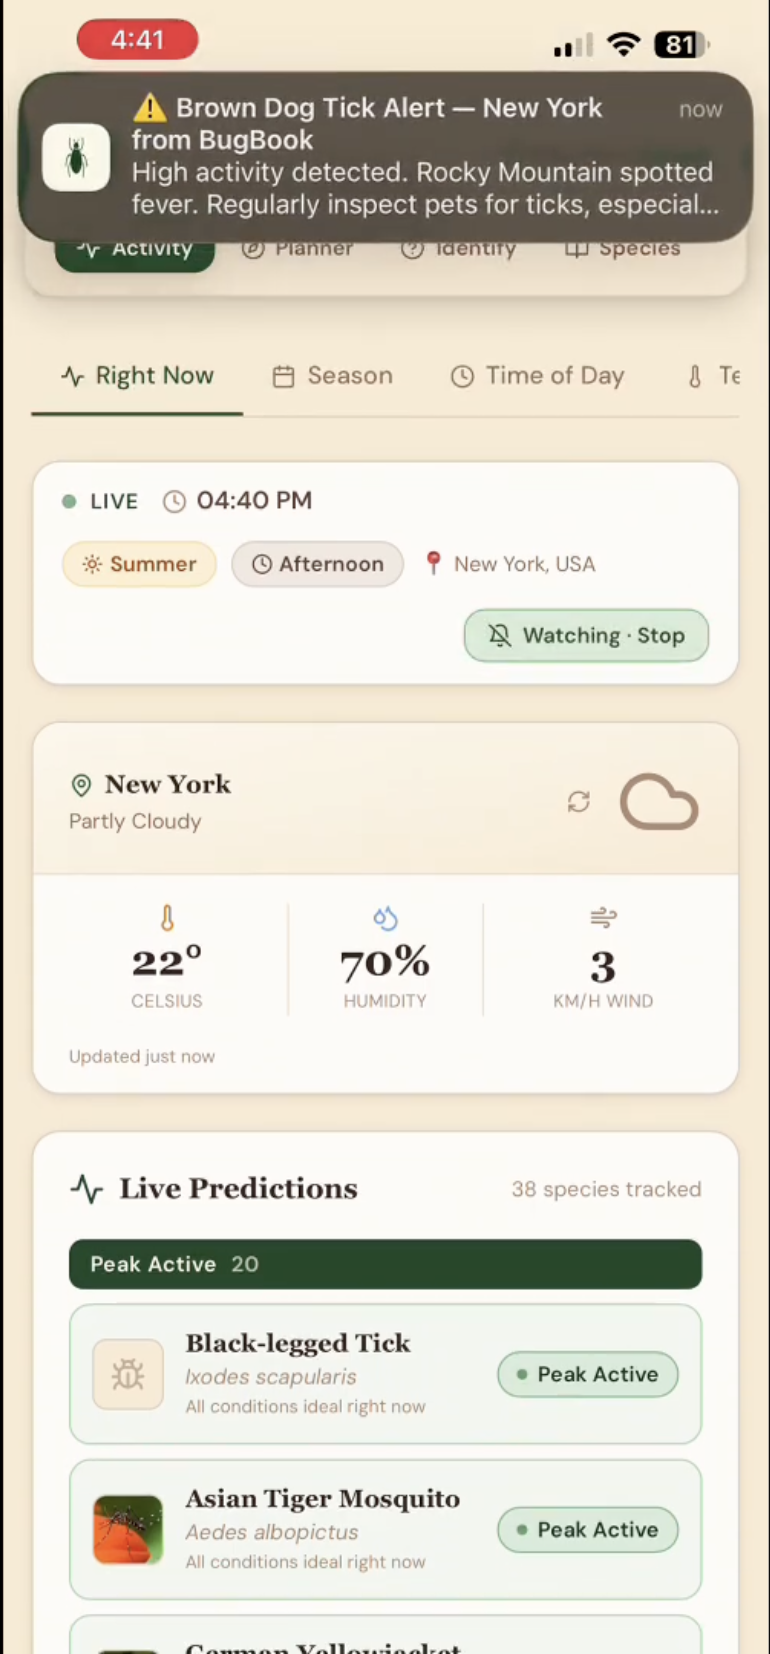
Notification on iPhone
-
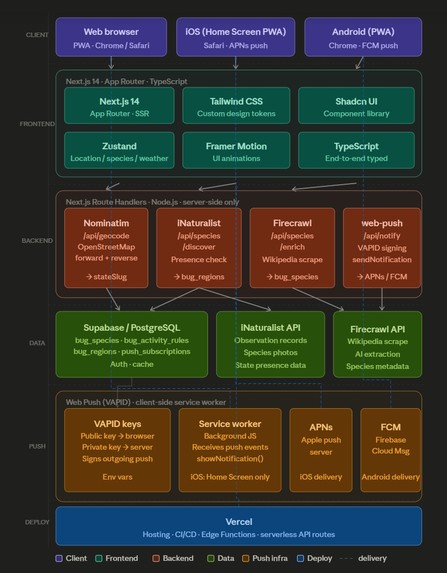
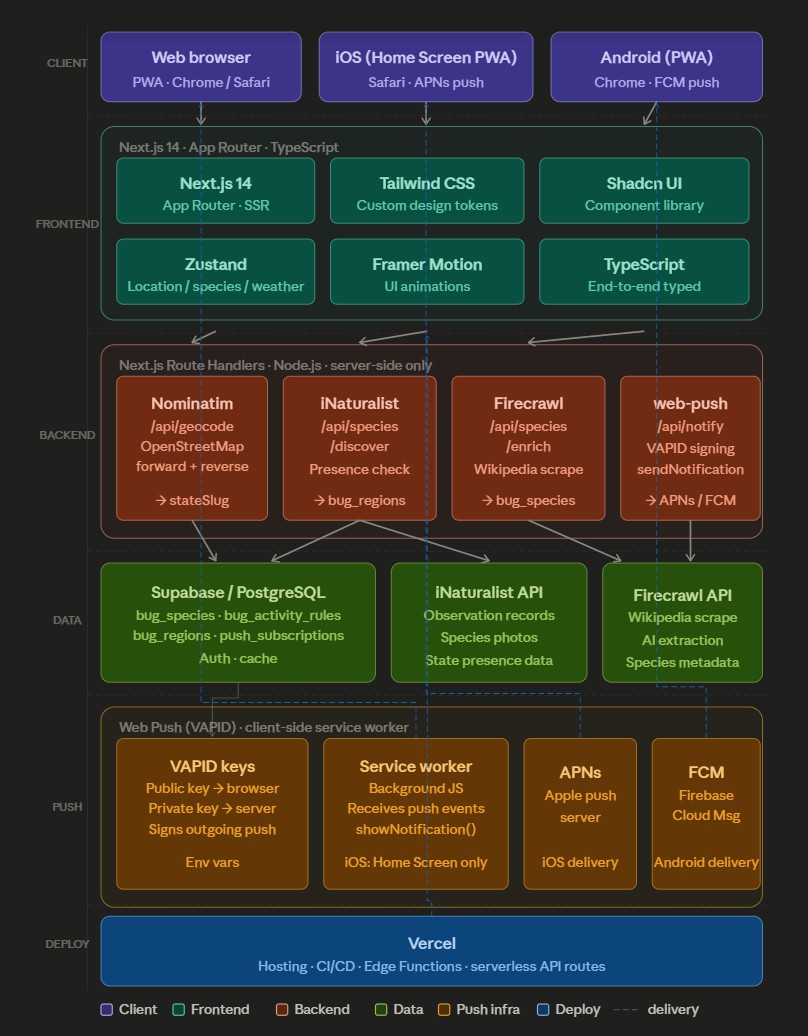
BugBook Application Architecture Overview
Inspiration
Illnesses from mosquito, tick, and flea bites have tripled in the U.S. over the past two decades, with nine new pathogens introduced in just 13 years. The CDC estimates approximately 475,000 Lyme disease cases annually, and between 2019 and 2022, every U.S. state reported at least one tickborne disease case. West Nile virus alone causes over 1,200 life-threatening illnesses and more than 120 deaths each year. Despite the scale of this threat, public information remains static, generalized, and disconnected from the conditions that actually drive bug activity. A hiker in Georgia in August faces an entirely different risk profile than one in Oregon in October, yet no tool reflects that in real time. BugBook closes that gap. By combining biodiversity data, live weather conditions, and AI-generated species intelligence, we give everyone a location-specific picture of what's dangerous near them and how to stay protected.
What it does
BugBook is a real-time bug safety platform that tells you which dangerous insects and arachnids are active in your area based on your location, season, time of day, and live weather. Going somewhere new? The Trip Planner takes a natural language description and returns a personalized safety briefing for your destination. If you get bitten and aren't sure what it was? The Bite Identifier walks you through a guided questionnaire and cross-references your symptoms against locally recorded species for an accurate match and medical guidance. All data is grounded in real biodiversity records from iNaturalist and GBIF, enriched by live web data from public health sources, and delivered through a fast, conversational interface powered by Groq.
How we built it
BugBook runs on Next.js with Tailwind CSS and Shadcn UI. Species data is auto-discovered from iNaturalist and GBIF, filtered against a curated dangerous-taxa allowlist, and enriched on first encounter using Firecrawl to scrape descriptions, threat metadata, and activity rules from public sources, all cached permanently in Supabase. Live weather comes from Open-Meteo and feeds into seasonal and time-of-day logic in server-side Route Handlers to compute real-time activity predictions. The Trip Planner runs on Groq with Llama 3 70B for near-instant inference. Location is resolved through Nominatim with full server-side geocoding, and every third-party call that carries a secret or rate limit runs server-side. Read our additional info doc for more documentation.
Challenges we ran into
Picking our tech stack required us to discuss early: Django vs. Next.js, Firebase vs. Supabase, Chakra UI vs. Shadcn UI, and OpenAI vs. Gemini vs. Groq. Once underway, Gemini API rate limits forced architectural decisions around caching and fallback handling, and getting consistent structured output from our AI integrations took more prompt engineering than expected. Shadcn/UI was new to the whole team, which added an unplanned learning curve. We cut the distribution map feature given our timeline, channeling that effort into the Trip Planner instead, and had to pause at one point to work through some internal disagreements on product direction.
Accomplishments that we're proud of
The end-to-end data pipeline is what we're most proud of. We resolved location through Nominatim, sourced dangerous species from iNaturalist and GBIF, enriched threat and prevention content via Firecrawl, and cached everything through Supabase. Seeing it return accurate species data for the first time with every layer working in sequence, made the initial architectural decisions feel worth it for us. Supabase, Groq, and Shadcn/UI were all new to us, and getting all three fully operational in a single hackathon was a solid outcome.
What we learned
We came away with a much stronger appreciation for established libraries and external packages. Shadcn/UI, Supabase, and the open biodiversity APIs let us move faster and ship something more polished than if we'd built those layers ourselves, and that build-vs-leverage instinct is something we'll carry forward. We also got hands-on experience connecting web applications with native mobile notifications, an integration surface none of us had worked with before. And somewhere along the way, we also picked up a lot of knowledge about dangerous insects and vector-borne diseases.
What's next for BugBook
The first thing we want to ship is the distribution map we cut during the hackathon, so users can visually explore species activity across regions. Further out, we're planning to expand beyond the U.S. and we could explore a potential CDC partnership for richer data in high-risk regions. On the infrastructure side, we're looking at moving the Trip Planner to a self-hosted model via Ollama on an AWS g4dn.xlarge EC2 instance, with LoRA fine-tuning on entomology and public health data to improve response quality and reduce our dependence on third-party APIs, especially with all the rate limits we were hitting during the hackathon.
Built With
- browser-geolocation-api
- claude
- css
- firecrawl
- gbif
- groq
- html5
- inaturalist
- javascript
- next.js-(app-router)
- nominatim
- open-meteo
- postgresql
- python
- react
- shadcn/ui
- supabase
- tailwind
- typescript
- vercel

Log in or sign up for Devpost to join the conversation.