-

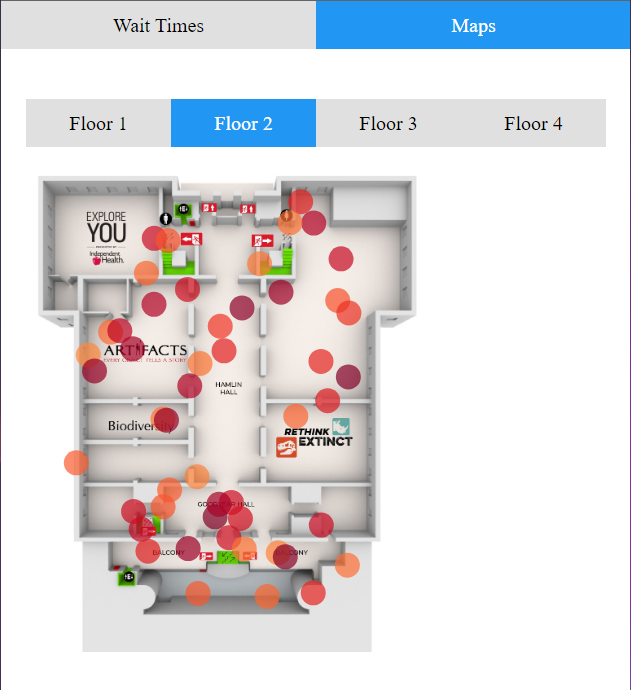
The Maps View
-

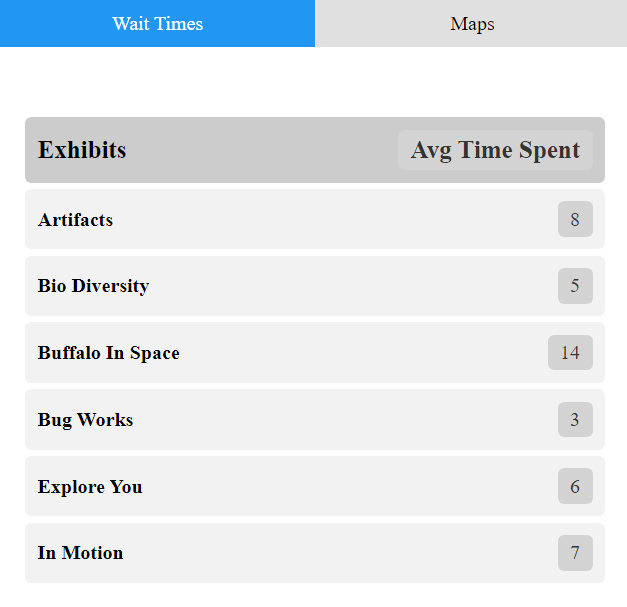
The Wait Time View
-

Inspiration
To help Buffalo Science members have a better viewing experience.
What it does
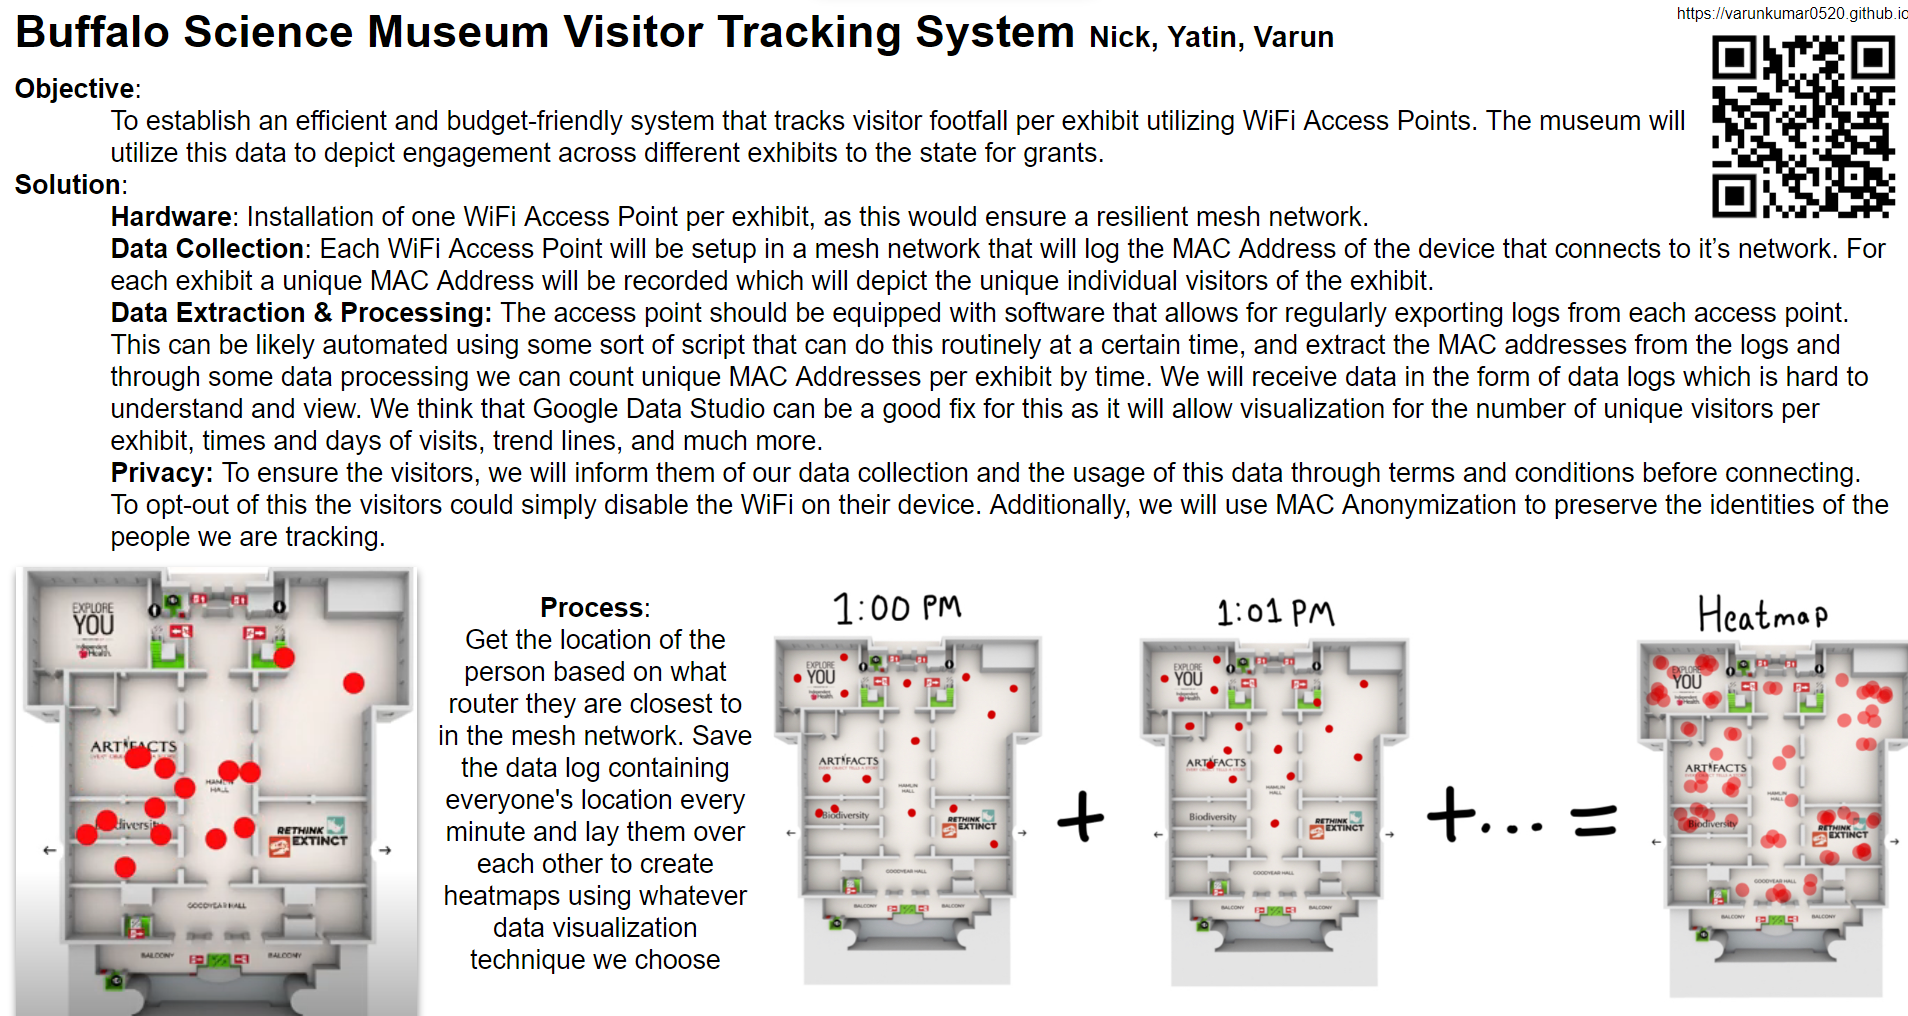
Tracks users time spent at exhibits through data collection at router access points of a mesh network and then displays in a user friendly way.
How we built it
We used D3.JS to visualized data collected from mesh access points.
Challenges we ran into
Originally we wanted to use wifi tracking to triangulate the location of guests in the museum, but figured it would be easier to implement stat tracking on the individual access points and put one at each exhibit.
Accomplishments that we're proud of
We're proud to have created an efficient and simple to use tool for the museum staff as well as the visitors.
What we learned
We learned a lot about wifi tracking, mesh networks, and data visualization.
Built With
- d3.js
- html/css
- javascript

Log in or sign up for Devpost to join the conversation.