
Inspiration
Budgeting is hard, especially when you can't visualize your spendings. Oftentimes, just writing down numbers doesn't help you see your improvements in your spending habits... or your damages. As college students where bad money management can be detrimental for our daily lives, we decided to create budgetbuddy as a tool to help people manage their finances and spending better. budgetbuddy helps kids and students alike budget visually and be more responsible, especially when they're just starting out with money.
What it does
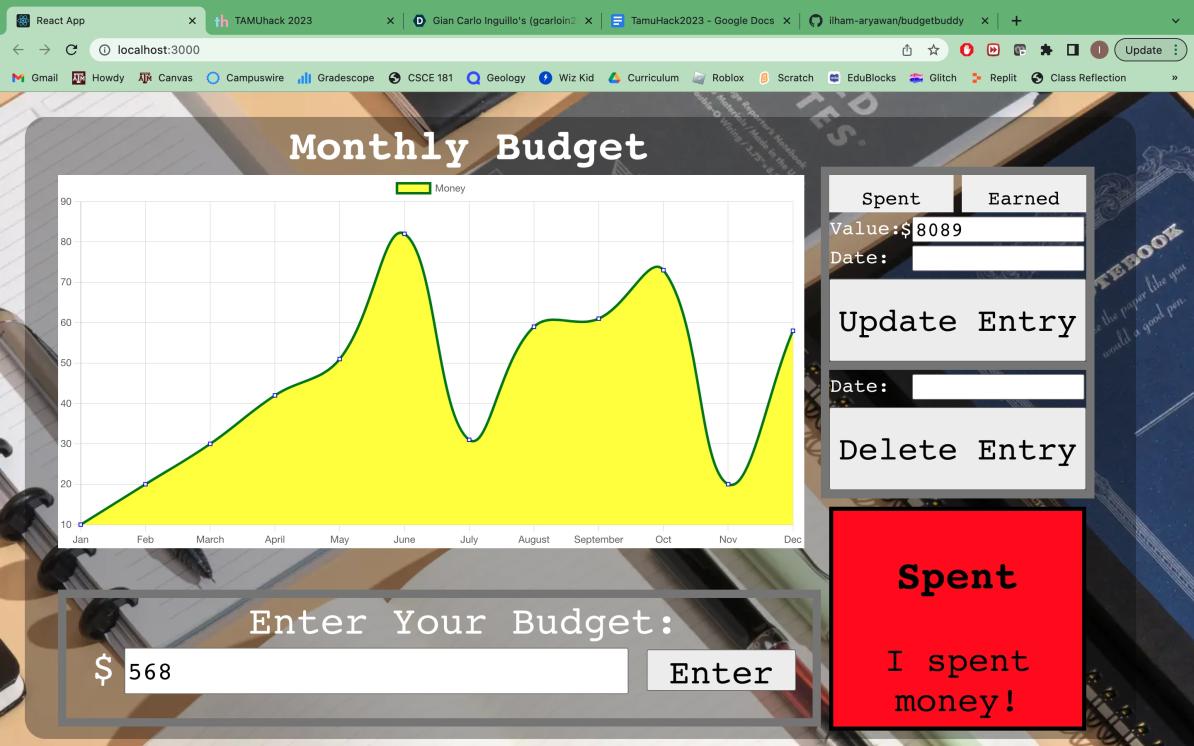
budgetbuddy allows you to import an excel sheet to be displayed as a dynamic graph, as well as additional individual points that can be manually added into the graph. The graph will then be updated accordingly, giving a visual representation of the user's spending habits.
How we built it
We built budgetbuddy using mainly React and its related technologies. We learned how to implement Chart.js with React, as well as how to code front-end and web development.
Challenges we ran into
One major problem we encountered while developing the website was how to create a dynamic graph that could be updated as the website was running. Regarding problems with formatting and created a UI, we would split up to individually to find whatever resources and tutorials we could to find a solution.
Accomplishments that we're proud of
At first, we ran into challenges of how to incorporate technologies together and how to work on our code together among several team members. However, as time went on, we learned more and were able to seamlessly incorporate our changes together.
What we learned
We learned to work together as a team and use Chart.js with React. Friendship.
What's next for budgetbuddy
Our next steps are to add additional tabs to the website to give the user more options for tracking other financial obligations as well as add a variety of graph display options.

Log in or sign up for Devpost to join the conversation.