-
-
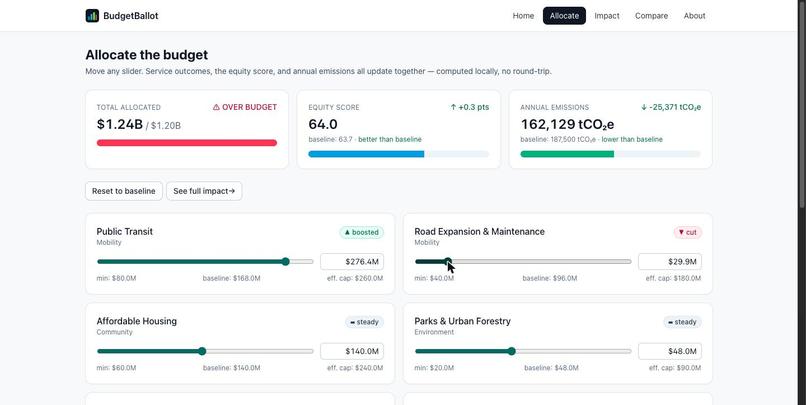
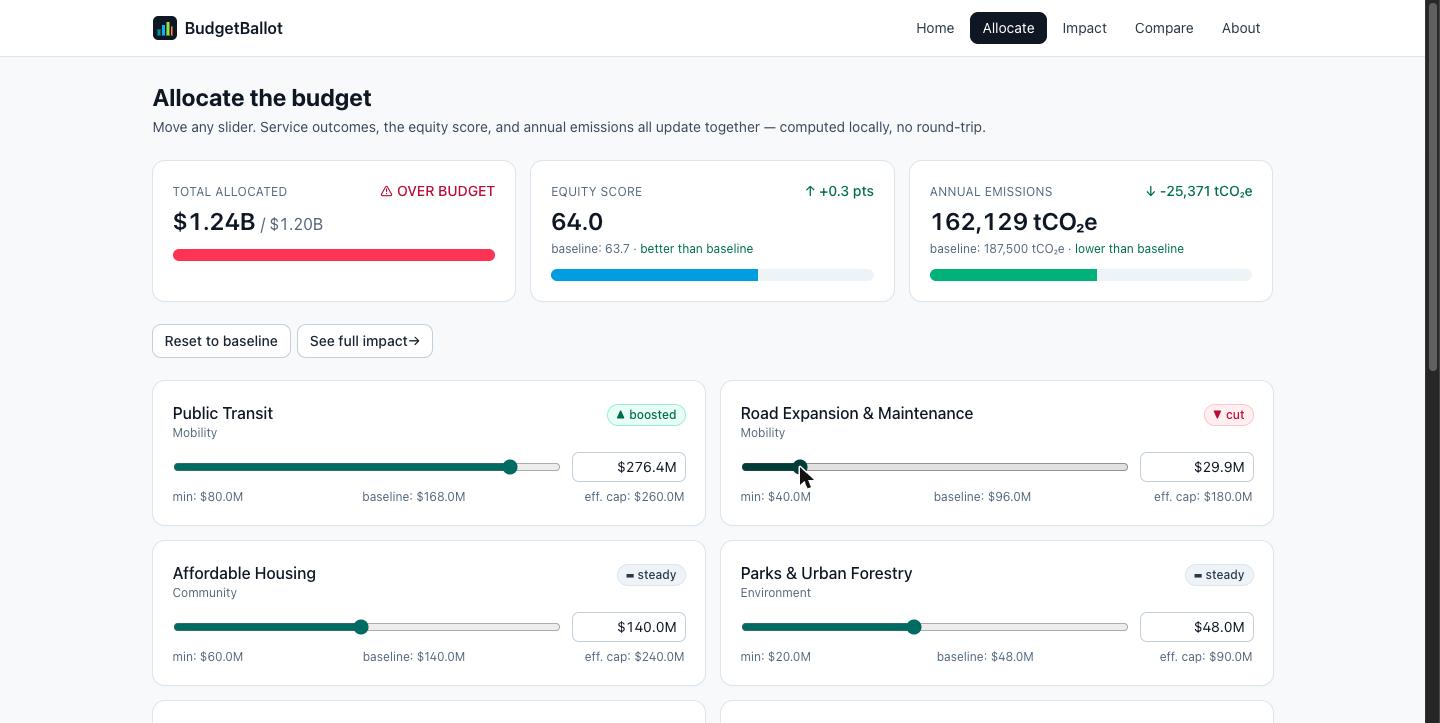
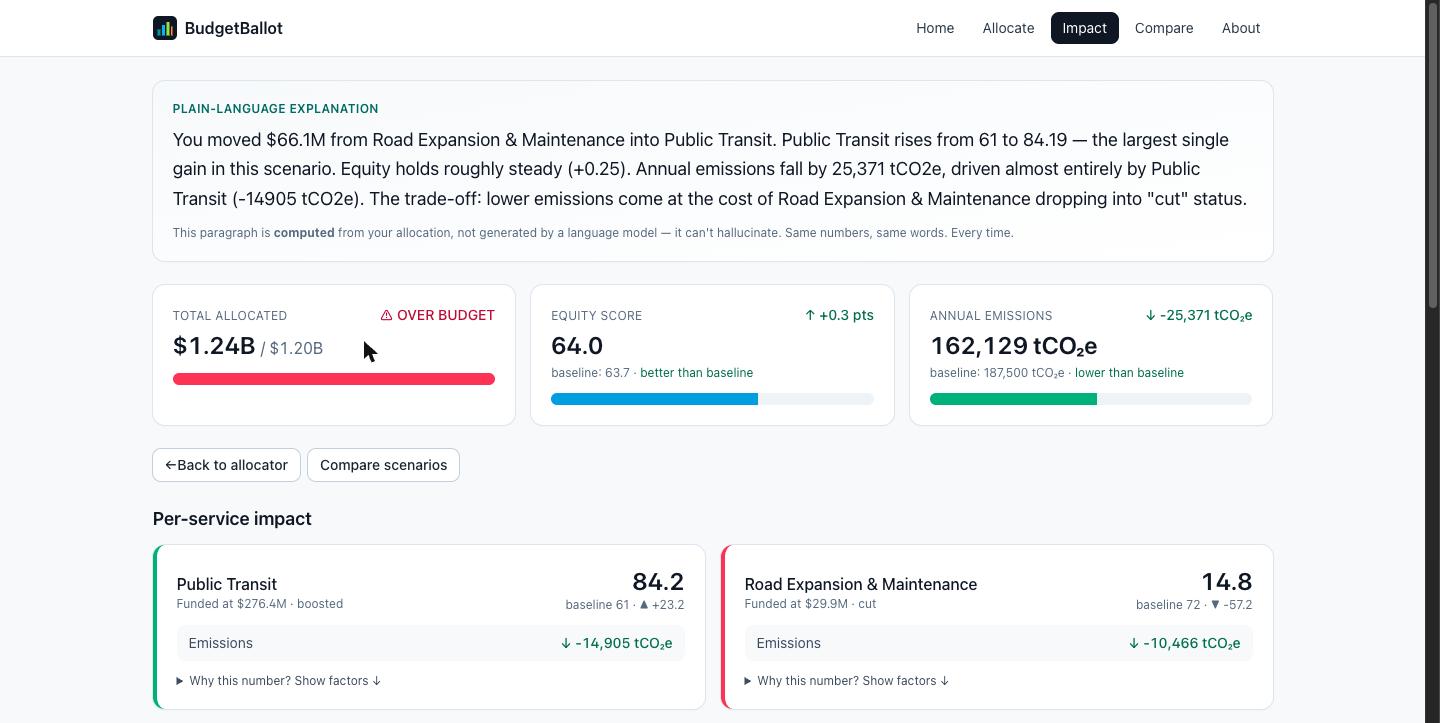
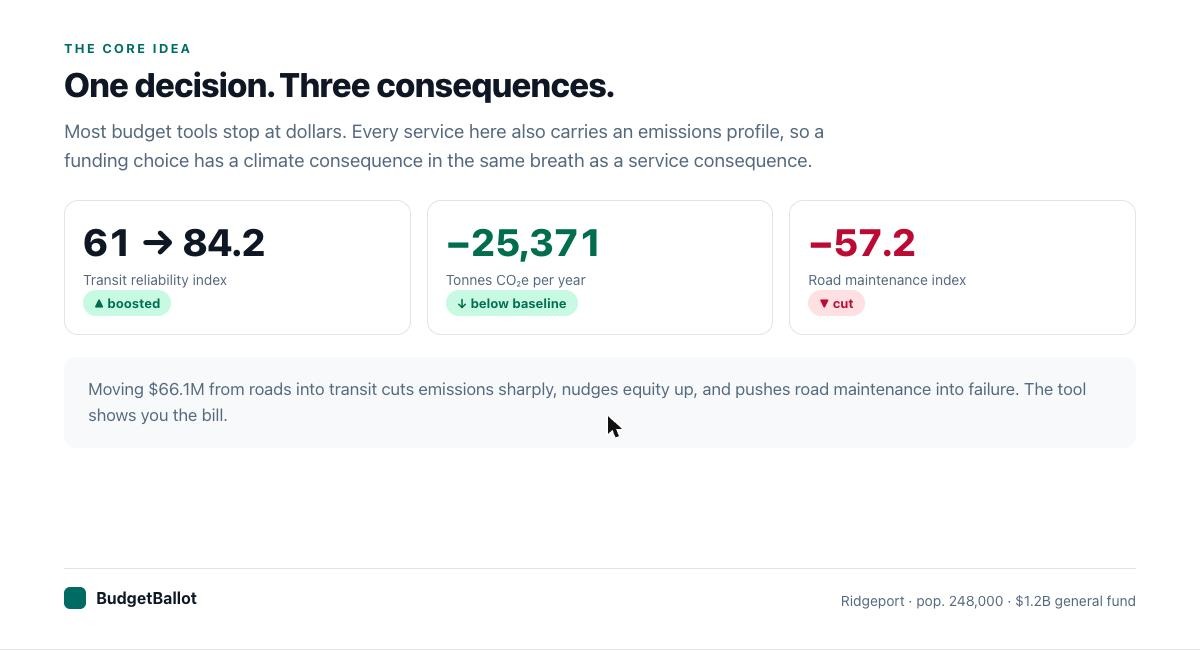
After shifting $66.1M into transit: equity up, emissions down 25,371 tCO2e, budget over cap. Three consequences from one slider.
-
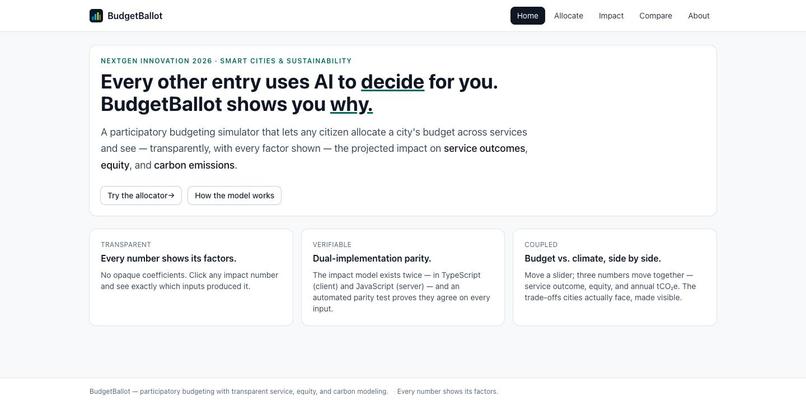
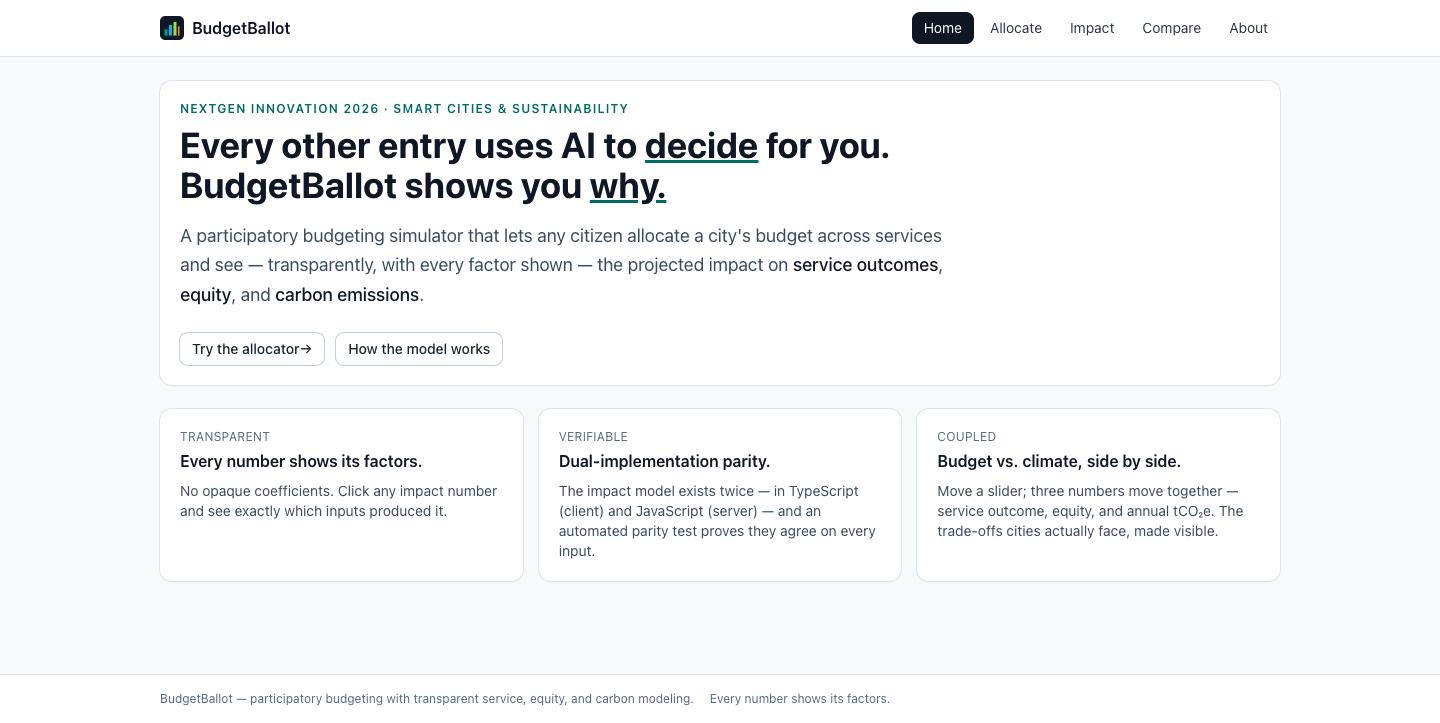
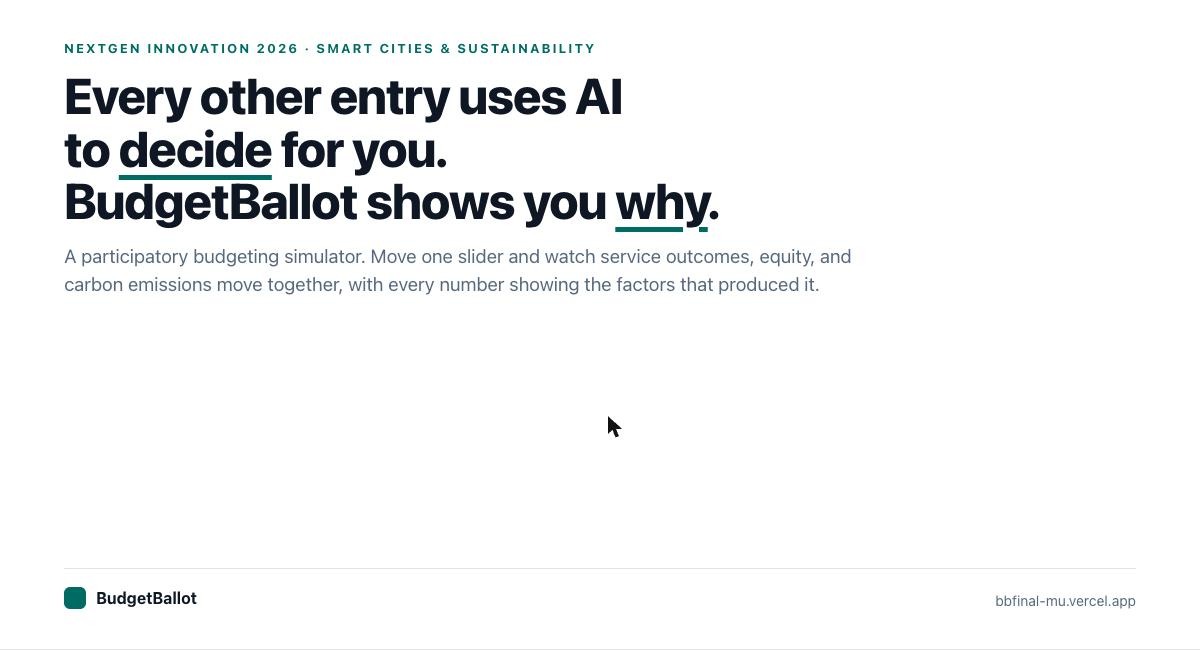
Landing page. The positioning is the product: every number in BudgetBallot shows the factors that produced it.
-
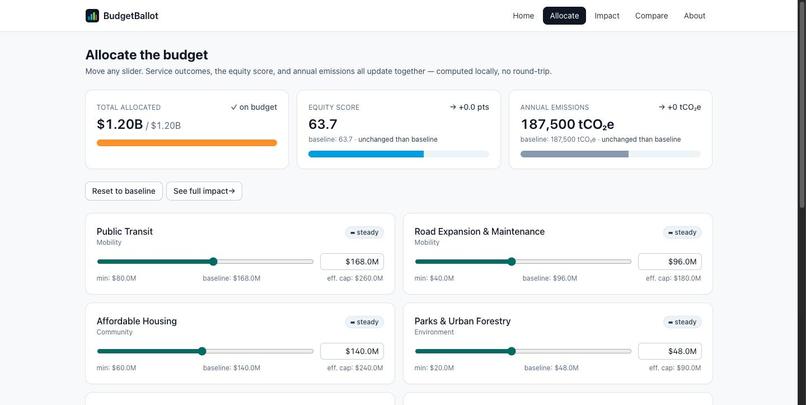
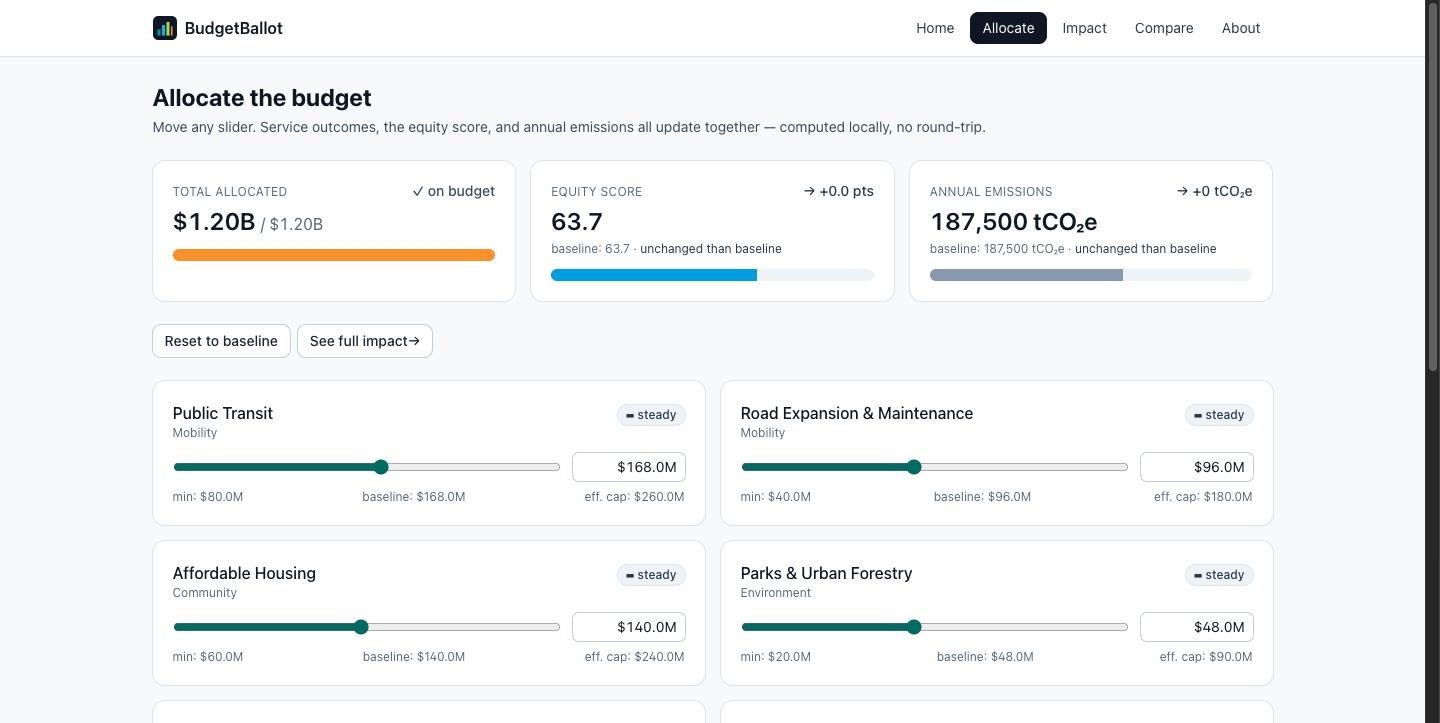
The allocator at baseline. $1.20B across 12 services, equity 63.7, emissions 187,500 tCO2e per year. Move any slider to begin.
-
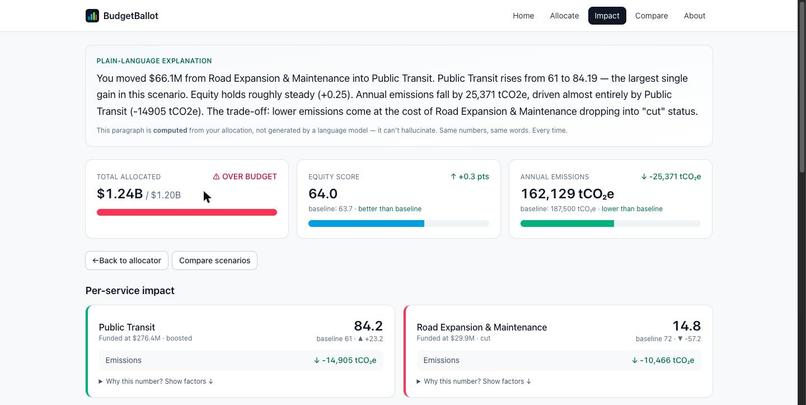
Impact view. The plain-language paragraph is computed from your allocation, never generated, so it cannot hallucinate a number.
-
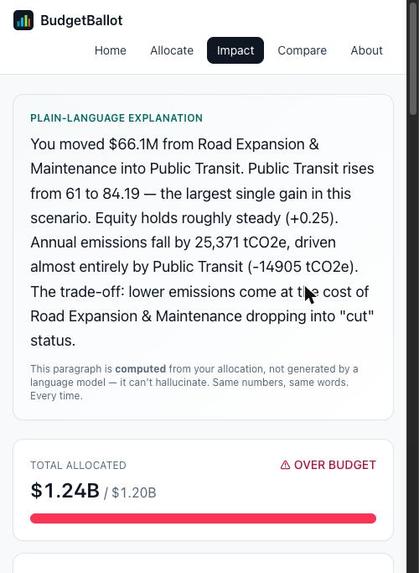
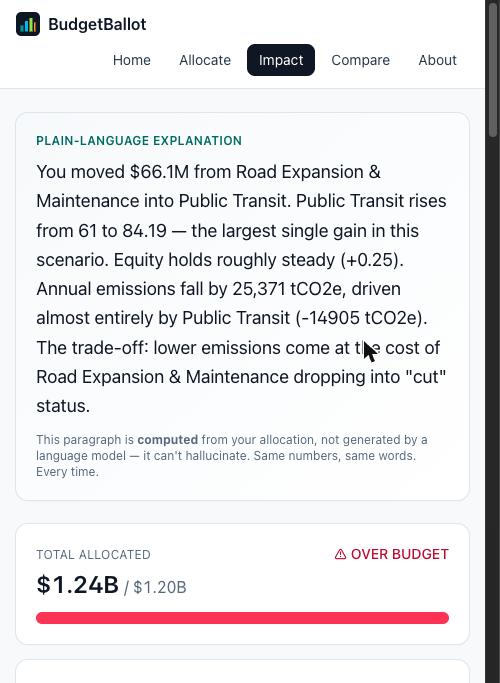
Fully responsive. Nav wraps, cards stack, and the computed explanation stays readable at 375px.
-
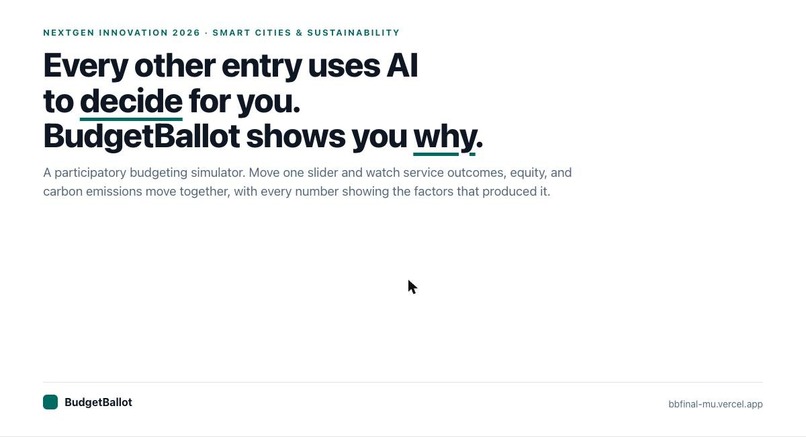
BudgetBallot: a participatory budgeting simulator for NextGen Innovation 2026, Smart Cities and Sustainability.
-
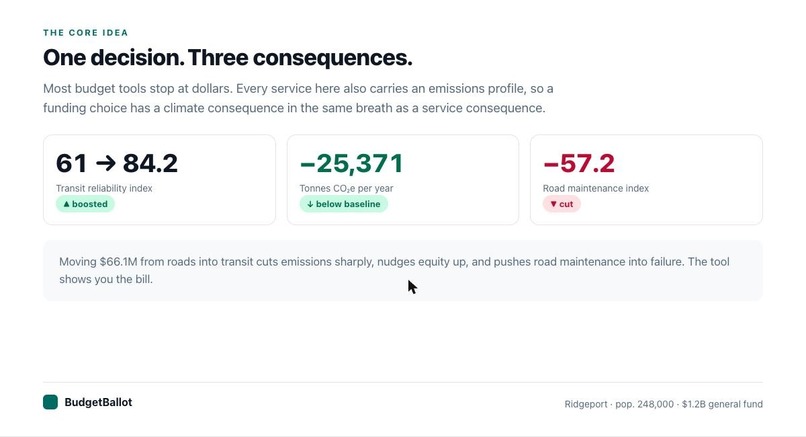
One slider moves three numbers: service outcome, equity, and annual carbon. The tool shows you the bill rather than hiding it.
-
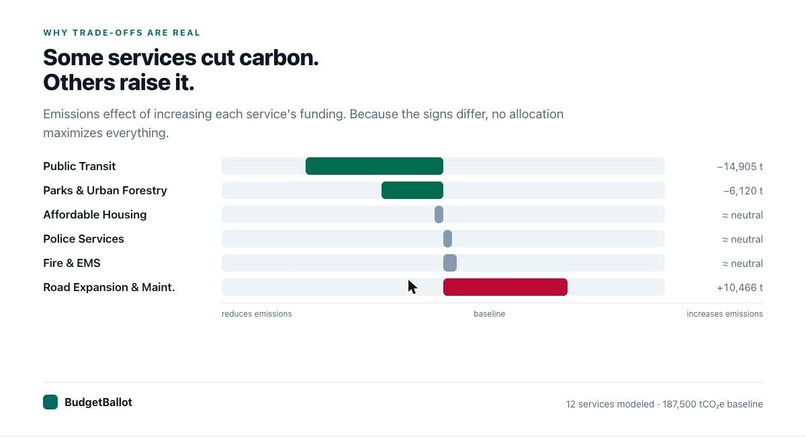
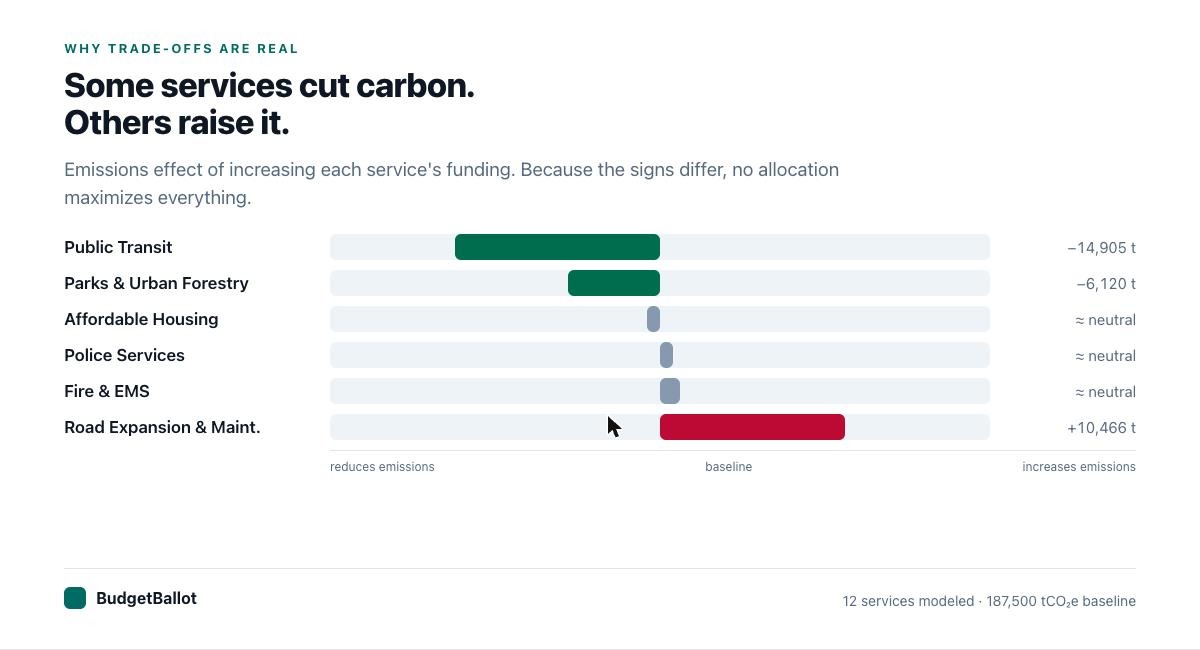
Transit and parks cut emissions when funded. Road expansion raises them. Because the signs differ, no allocation maximizes everything.
-
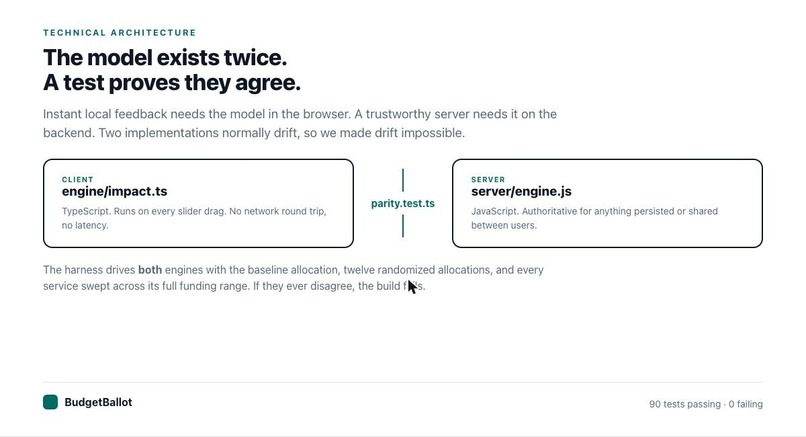
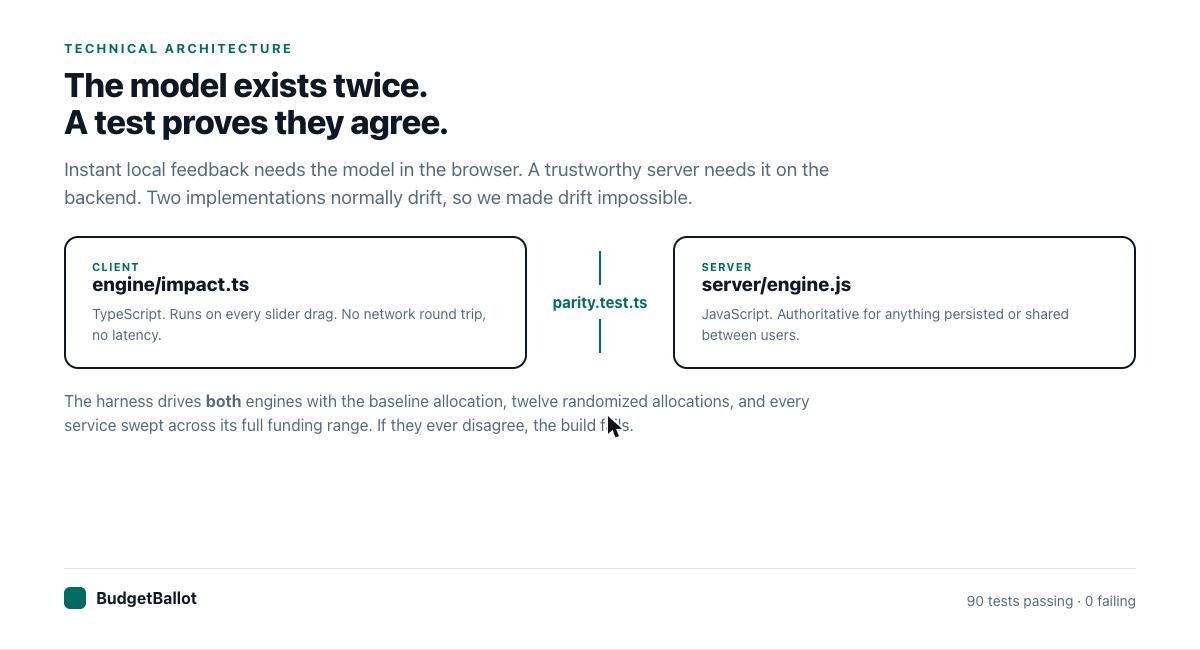
The impact model is implemented twice, in TypeScript and JavaScript. An automated parity test fails the build if they ever disagree.
-
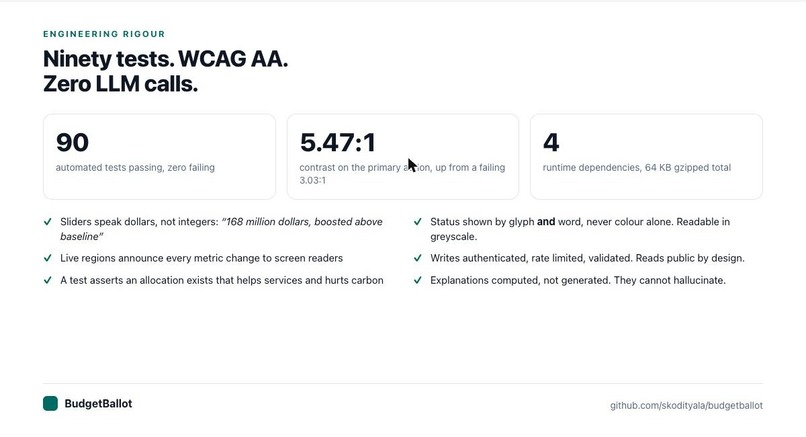
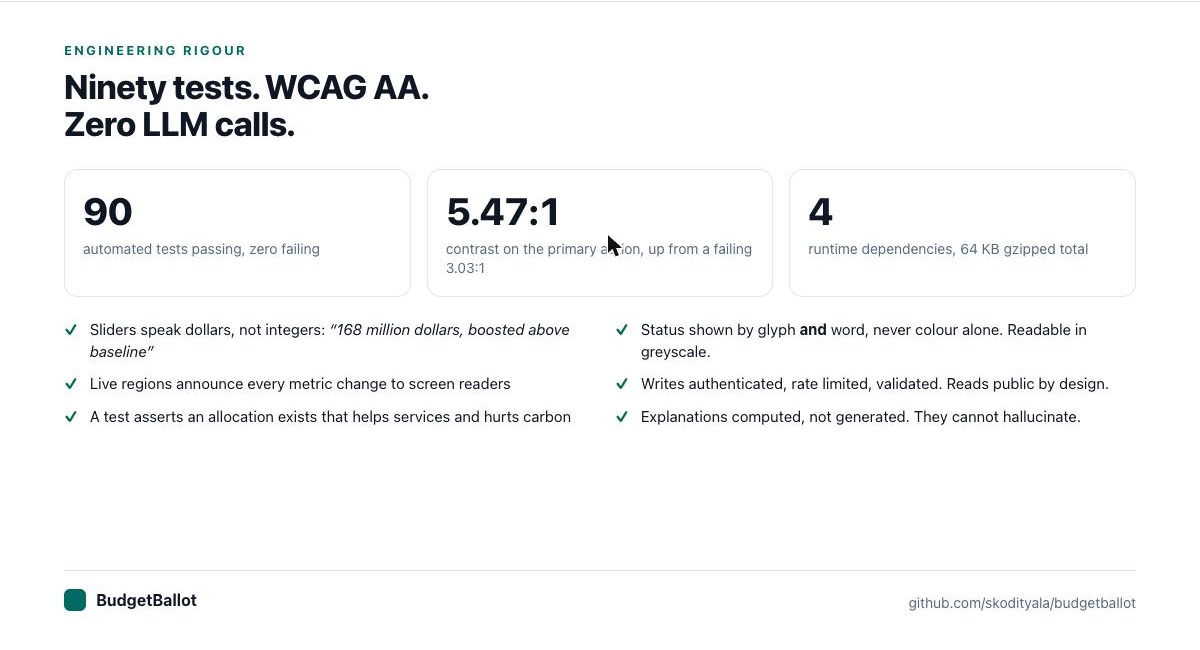
90 tests passing, WCAG AA contrast at 5.47:1, four runtime dependencies, and zero LLM calls in the explanation pipeline.
The problem, in one picture
A city moves a billion dollars a year. Residents get a survey.
   HOW IT WORKS TODAY                    WHAT IS MISSING
   ───────────────────                   ───────────────

   budget drafted  ──▶  hearing  ──▶     no model
   (closed room)        (finished        no trade-offs shown
                         document)       no way to ask
                                         "what if we spent
        ▲                                 it differently?"
        │
   resident ranks
   priorities on
   a survey  ────────▶  ??? ─────────▶   nothing returns
A budget is a chain of trade-offs. If you cannot see the chain, you are not participating. You are being consulted.
What BudgetBallot does
   ONE SLIDER                          THREE CONSEQUENCES
   ──────────                          ──────────────────

   Public Transit                      ┌──────────────────────────┐
   ▓▓▓▓▓▓▓▓▓░░░░░░  $168M  ───────┬───▶│ SERVICE OUTCOME    61.0  │
                                  │    ├──────────────────────────┤
                                  ├───▶│ EQUITY SCORE       63.7  │
                                  │    ├──────────────────────────┤
                                  └───▶│ EMISSIONS   187,500 tCO2e│
                                       └──────────────────────────┘
                                        all three recomputed live
                                        locally, no round trip
The city: Ridgeport
  population         248,000
  general fund       $1,200,000,000
  services                       12
  baseline equity              63.7 / 100
  baseline emissions        187,500 tCO2e / yr
Where the money sits at baseline
  Police Services        ████████████████████  $180.0M   15.0%
  Public Transit         ██████████████████    $168.0M   14.0%
  Affordable Housing     ███████████████       $140.0M   11.7%
  Fire & EMS             ████████████          $110.0M    9.2%
  Road Expansion         ██████████            $ 96.0M    8.0%
  Parks & Forestry       █████                 $ 48.0M    4.0%
  six further services   ████████████████████  $458.0M   38.1%
                         ──────────────────────────────────────
                                               $1,200.0M  100%
Every service has a floor, a baseline and a ceiling
  SERVICE                FLOOR        BASELINE       CEILING
  ─────────────────────────────────────────────────────────────
  Public Transit         $ 80.0M ├────── $168.0M ──────┤ $260.0M
  Road Expansion         $ 40.0M ├── $96.0M ───────────┤ $180.0M
  Affordable Housing     $ 60.0M ├───── $140.0M ───────┤ $240.0M
  Parks & Forestry       $ 20.0M ├─── $48.0M ──────────┤ $ 90.0M
  Police Services        $ 90.0M ├────── $180.0M ──────┤ $260.0M
  Fire & EMS             $ 70.0M ├──── $110.0M ────────┤ $160.0M
  ─────────────────────────────────────────────────────────────
  below floor = service fails      above ceiling = money stops
                                    buying outcome
Money does not buy outcome linearly
  OUTCOME
  INDEX
   100 ┤                                   ....................
       │                          ........
    80 ┤                    ......                  ← ceiling:
       │                ....                          extra money
    60 ┤            ....   ● baseline                 stops buying
       │         ...                                  outcome
    40 ┤      ...
       │    ..
    20 ┤  ..
       │ .
     0 ┼─┴────────────────────────────────────────────────────
       floor        baseline                        ceiling
                      FUNDING

  Steep early, flat late. The first dollars into a failing
  service buy far more than the last dollars into a healthy one.
Click any number and it decomposes
Nothing here is an opaque coefficient. Every figure carries its inputs, and every parameter below is read straight from the dataset.
  PUBLIC TRANSIT   ·   why this number?
  ------------------------------------------------------------------
  baselineOutcome                                      61.00
  baselineFunding                                  $168.0M
  minFunding  /  maxEffectiveFunding      $80M / $260M
  elasticity                                           0.75
  equityWeight                                         0.95
  ------------------------------------------------------------------
  baselineEmissionsTonnes                        42,000 tCO2e
  carbonElasticity                                     0.55
  carbonDirection                                   reduces
  ------------------------------------------------------------------
  carbonRationale, quoted from the dataset:
    "expanded service pulls trips out of private vehicles; each additional bus-mile displaces roughly 3-5 car-miles at typical urban ridership."
Why the trade-offs are real
Some services cut emissions when funded. Others raise them.
        EMISSIONS EFFECT OF FUNDING EACH SERVICE

  reduces                    neutral                   increases
  ◀──────────────────────────────┼──────────────────────────────▶

  Public Transit    ████████████ │                   −14,905 t
  Parks & Forestry     ██████    │                   − 6,120 t
  Affordable Housing            ▐│▌                  ≈ neutral
  Police Services               ▐│▌                  ≈ neutral
  Fire & EMS                    ▐│▌                  ≈ neutral
  Road Expansion                 │      ████████████ +10,466 t
                                 │
                             baseline

  Because the signs differ, no allocation maximizes everything.
  That is the finding, not a limitation of the model.
Worked example: move $66.1M from roads into transit
                        BEFORE          AFTER          DELTA
  ────────────────────────────────────────────────────────────
  Public Transit
    funding            $168.0M        $276.4M        +$108.4M
    outcome index         61.0           84.2          +23.2  ▲
    emissions          baseline      −14,905 t       −14,905

  Road Expansion & Maintenance
    funding            $ 96.0M        $ 29.9M         −$66.1M
    outcome index         72.0           14.8          −57.2  ▼
    emissions          baseline      −10,466 t       −10,466
  ────────────────────────────────────────────────────────────
  CITY TOTALS
    allocated           $1.200B        $1.240B        +$40.0M ⚠
    equity score          63.7           64.0         + 0.3
    emissions          187,500 t      162,129 t      −25,371 t
  ────────────────────────────────────────────────────────────
  EMISSIONS WATERFALL

  187,500 ┤████████████████████████████  baseline
          │
          │        −14,905  transit
          │        ▼▼▼▼▼▼▼
          │                  −10,466  roads
          │                  ▼▼▼▼▼
  162,129 ┤██████████████████████        result
          └──────────────────────────────────────
Equity is weighted, not averaged
Every service carries an equityWeight: how much it matters to residents
who have the least access to alternatives.
  SERVICE                  EQUITY WEIGHT (from server/seed.js)
  --------------------------------------------------------------
  Public Transit           ███████████████████░  0.95
  Affordable Housing       ██████████████████░░  0.90
  Public Health & Clinics  ██████████████████░░  0.90
  Public Schools Supplemen █████████████████░░░  0.85
  Libraries & Community Ce ███████████████░░░░░  0.75
  Fire & EMS               ██████████████░░░░░░  0.70
  Efficiency Retrofits     █████████████░░░░░░░  0.65
  Waste & Recycling        ████████████░░░░░░░░  0.60
  Parks & Urban Forestry   ███████████░░░░░░░░░  0.55
  Police Services          █████████░░░░░░░░░░░  0.45
  Road Expansion & Mainten ███████░░░░░░░░░░░░░  0.35
  General Administration   ██████░░░░░░░░░░░░░░  0.30
  --------------------------------------------------------------
  A dollar into a high weight service moves the city equity score
  more than the same dollar into a service that is already well
  covered. This is why transit-first improves equity at all.
Three scenarios, side by side
                        BASELINE    TRANSIT-FIRST   AUSTERITY
                                                    (−25% all)
  ──────────────────────────────────────────────────────────────
  allocated             $1.200B      $1.240B         $0.900B
  vs cap                on budget    OVER $40M       under $300M
  equity score            63.7         64.0            44.9
  equity delta               ―        + 0.3          − 18.8
  emissions            187,500 t    162,129 t       196,131 t
  emissions delta            ―      − 25,371        +  8,631
  ──────────────────────────────────────────────────────────────
Read the austerity column twice. Cutting every service by a quarter saves $300M, costs almost nineteen points of equity, and increases emissions by 8,631 tonnes. Cutting across the board also cuts the services that were reducing emissions.
A resident finds that in about fifteen seconds of sliding. It is not intuitive and it is not something a survey could ever surface.
The explanation is computed, never generated
 ┌───────────────────────────────────────────────────────────────┐
 │ PLAIN LANGUAGE EXPLANATION                                    │
 │                                                               │
 │ You moved $66.1M from Road Expansion & Maintenance into       │
 │ Public Transit. Public Transit rises from 61 to 84.19, the    │
 │ largest single gain in this scenario. Equity holds roughly    │
 │ steady (+0.25). Annual emissions fall by 25,371 tCO2e,        │
 │ driven almost entirely by Public Transit (−14905 tCO2e).      │
 │ The trade-off: lower emissions come at the cost of Road       │
 │ Expansion & Maintenance dropping into "cut" status.           │
 └───────────────────────────────────────────────────────────────┘
  GENERATED (a language model)     COMPUTED (this project)
  ────────────────────────────     ───────────────────────────
  can invent a number              cannot invent a number
  varies between runs              identical every run
  needs a key and a network        works offline, forever
  cannot be audited                is a pure function
  costs money per call             costs nothing
A civic tool that invents a figure is worse than no tool, because it launders a guess into something that looks like a finding.
Architecture
   BROWSER                                    SERVER
 ┌──────────────────────────┐              ┌────────────────────────────┐
 │  React 18 + TypeScript   │              │  Express 4                 │
 │  Tailwind 3 + Vite 5     │              │                            │
 │                          │              │  GET  /api/health          │
 │  views/Allocate ─────────┼──┐           │  GET  /api/dataset         │
 │  views/Impact            │  │           │  POST /api/impact          │
 │  views/Compare           │  │           │  GET  /api/scenarios       │
 │  views/About             │  │           │  POST /api/scenarios   🔒  │
 │                          │  │           │  DEL  /api/scenarios/: 🔒  │
 │  engine/impact.ts   ◀────┼──┘           │                            │
 │    instant, local        │              │  engine.js  authoritative  │
 │  engine/narrate.ts       │              │  store.js   persistence    │
 │                          │              │  validate.js  input guard  │
 └────────────┬─────────────┘              └─────────────┬──────────────┘
              │                                          │
              │         parity.test.ts                   │
              └───────── proves equal ───────────────────┘
The model exists twice. A test proves they agree.
  parity.test.ts drives BOTH engines with:

    ├── the baseline allocation
    ├── twelve pseudo random allocations
    ├── every service swept across its full funding range
    └── boundary cases at floor and ceiling

  and asserts the outputs are identical.
  If TypeScript and JavaScript ever disagree, the build fails.
This is what lets the interface be instant and the server remain authoritative at the same time.
Dependency weight
  RUNTIME DEPENDENCIES        4     react, react-dom,
                                    react-router-dom, express

  BUNDLE (gzipped)
    JavaScript    ████████████████████████  64.2 KB
    CSS           ██                         4.1 KB
                                            ────────
                                             68.3 KB

  chart library     none        LLM SDK        none
  state library     none        API keys       none
  UI framework      none        telemetry      none
Testing
  npx vitest run   →   90 passing   0 failing
  npm run build    →   exit 0

  impact model            ████████████████   core math
  carbon model            ██████████         sign convention
  engine parity           ████████           TS vs JS
  narrator                ██████████         4 distinct outputs
  API auth                ████████           401 / 201 / 400
  rate limiting           ████               token bucket
  input validation        ██████             malformed payloads
  persistence             ██████             read only fallback
  WCAG contrast           ████               regression guard
  ──────────────────────────────────────────────────────────
  plus 26 live HTTP checks against a running server
One test searches for an allocation that improves service outcomes while worsening carbon, and asserts one exists. That test is the thesis in executable form. If trade-offs stopped existing, the suite would go red.
Accessibility
  IMPLEMENTED                                    VERIFIED BY
  ──────────────────────────────────────────────────────────────
  Skip to content link, visible on focus         manual keyboard
  Sliders operable by keyboard                   manual keyboard
  aria-valuetext speaks dollars, not integers    unit test
    "168 million dollars, boosted above baseline"
  Live regions on all three meters               unit test
  Status by glyph AND word, never colour alone   greyscale review
    ▲ boosted    ▬ steady    ▼ cut
  Contrast 5.47:1 on primary action              automated test
  prefers-reduced-motion honoured                manual
  One h1 per view, logical heading order         automated test
  Route announcer for SPA navigation             screen reader
  ──────────────────────────────────────────────────────────────
  CONTRAST FIX

  before  3.03:1  ████░░░░░░░░  FAILS AA
  after   5.47:1  ████████████  PASSES AA (4.5:1 required)

  The most clicked control in the product was unreadable for
  low vision users. A regression test now asserts the old
  value fails, so it cannot come back.
Security
  SURFACE                        STATUS
  ──────────────────────────────────────────────────────────────
  GET  /api/dataset              public by design
  POST /api/impact               public by design
  GET  /api/scenarios            public by design
  POST /api/scenarios            authenticated  🔒
  DEL  /api/scenarios/:id        authenticated  🔒
  rate limiting                  20 req / min / IP, token bucket
  input validation               unknown IDs, negatives, non
                                 finite, oversized all rejected
  scenario identifiers           crypto.randomUUID
  error responses                JSON only, no stack traces
  ──────────────────────────────────────────────────────────────
Reads are open deliberately. Requiring credentials to look at a public budget model would defeat the purpose. Limitations stated plainly: the write key is a single shared secret, not per user auth, and persistence is a JSON file that degrades to memory on read only filesystems. Both are on the roadmap. Neither is hidden.
Challenges
  CHALLENGE                        RESOLUTION
  ──────────────────────────────────────────────────────────────
  Carbon signs had to be right     dedicated behavioural test
  across all 12 services           across every service at once

  Two engines could silently       parity harness, build fails
  drift apart                      on any disagreement

  Accent colour failed AA at       fixed to 5.47:1 plus a
  3.03:1                           regression test

  Vercel deployed successfully     explicit builds schema.
  and served HTML from /api,       Status 200 with the wrong
  breaking the client              body is a nasty failure mode
  ──────────────────────────────────────────────────────────────
Roadmap
  NEAR    ingest real published municipal budgets
          (the dataset is a single file)
          per user auth replacing the shared key
          durable persistence in Postgres

  MID     deliberation: fork and comment on scenarios
          deep linkable allocations that survive a refresh

  LONG    published emissions factors per service category
          multi year budgets, capital vs operating splits
What a judge can verify in sixty seconds
  CLAIM                          HOW TO CHECK IT YOURSELF
  ──────────────────────────────────────────────────────────────
  90 tests pass                  git clone && npm i && npx vitest run
  the two engines agree          read src/engine/parity.test.ts
  explanations cannot            read src/engine/narrate.ts
    hallucinate                    (no fetch, no key, pure function)
  trade-offs are real            move transit up, watch roads fall
  writes are protected           curl -X POST /api/scenarios  → 401
  it works on a phone            open the live URL on your phone
  data is illustrative           read the header of server/seed.js
  ──────────────────────────────────────────────────────────────

  live    https://bbfinal-mu.vercel.app
  code    https://github.com/skodityala/budgetballot
A note on the data
Figures are realistic, round number illustrations built on the structure of a mid sized American municipal budget, intentionally tractable so the demo works offline with no API key.
Ridgeport is a composite. No figure here should be cited as data about a real place. Service categories, funding bands and emissions directions are grounded in how municipal budgets are actually structured, but the specific numbers are illustrative parameters and are labelled as such everywhere they appear, including inside the product. Swapping in a real city's open budget data means replacing one file.
Built With
- express.js
- html
- javascript
- node.js
- react
- tailwind
- typescript
- vercel
- vite
- vitest

Log in or sign up for Devpost to join the conversation.