-
-
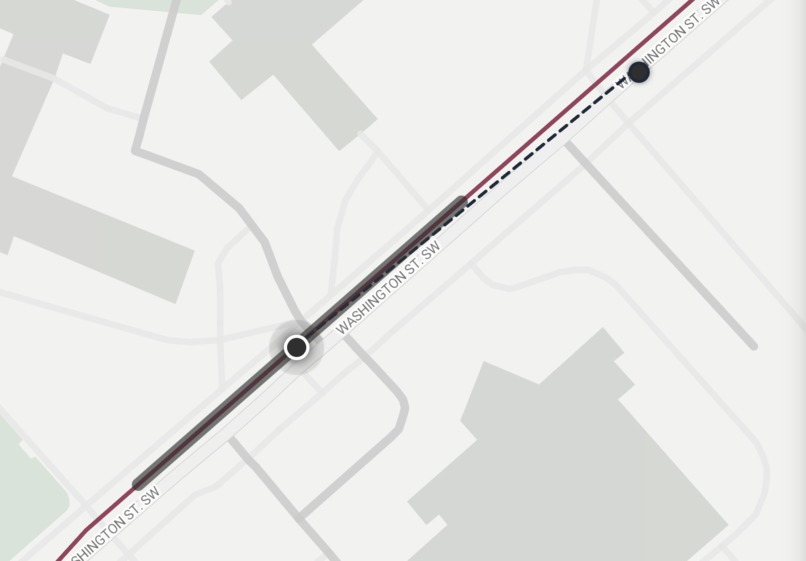
CAS and its prediction
-
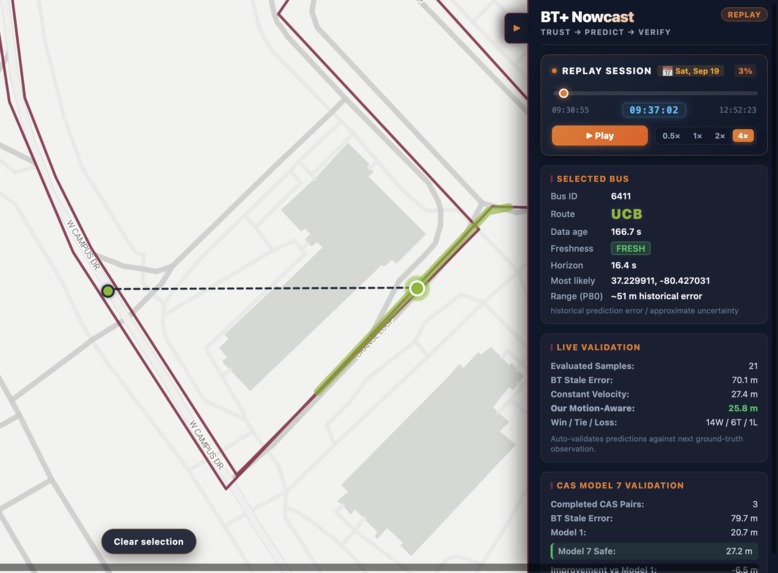
Info UI
-
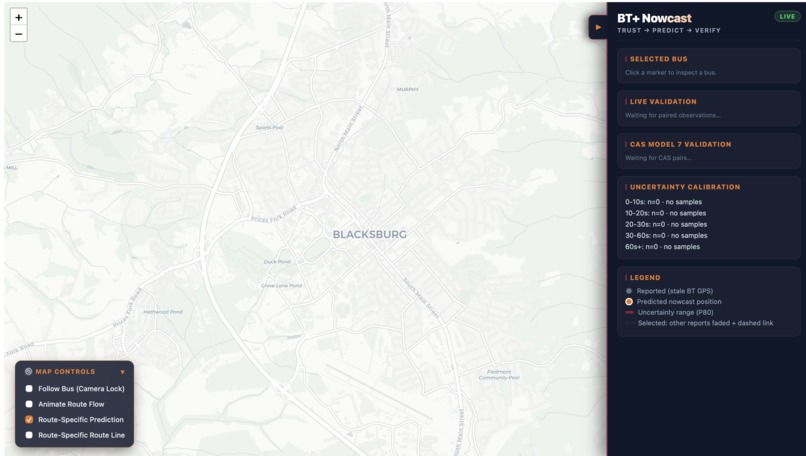
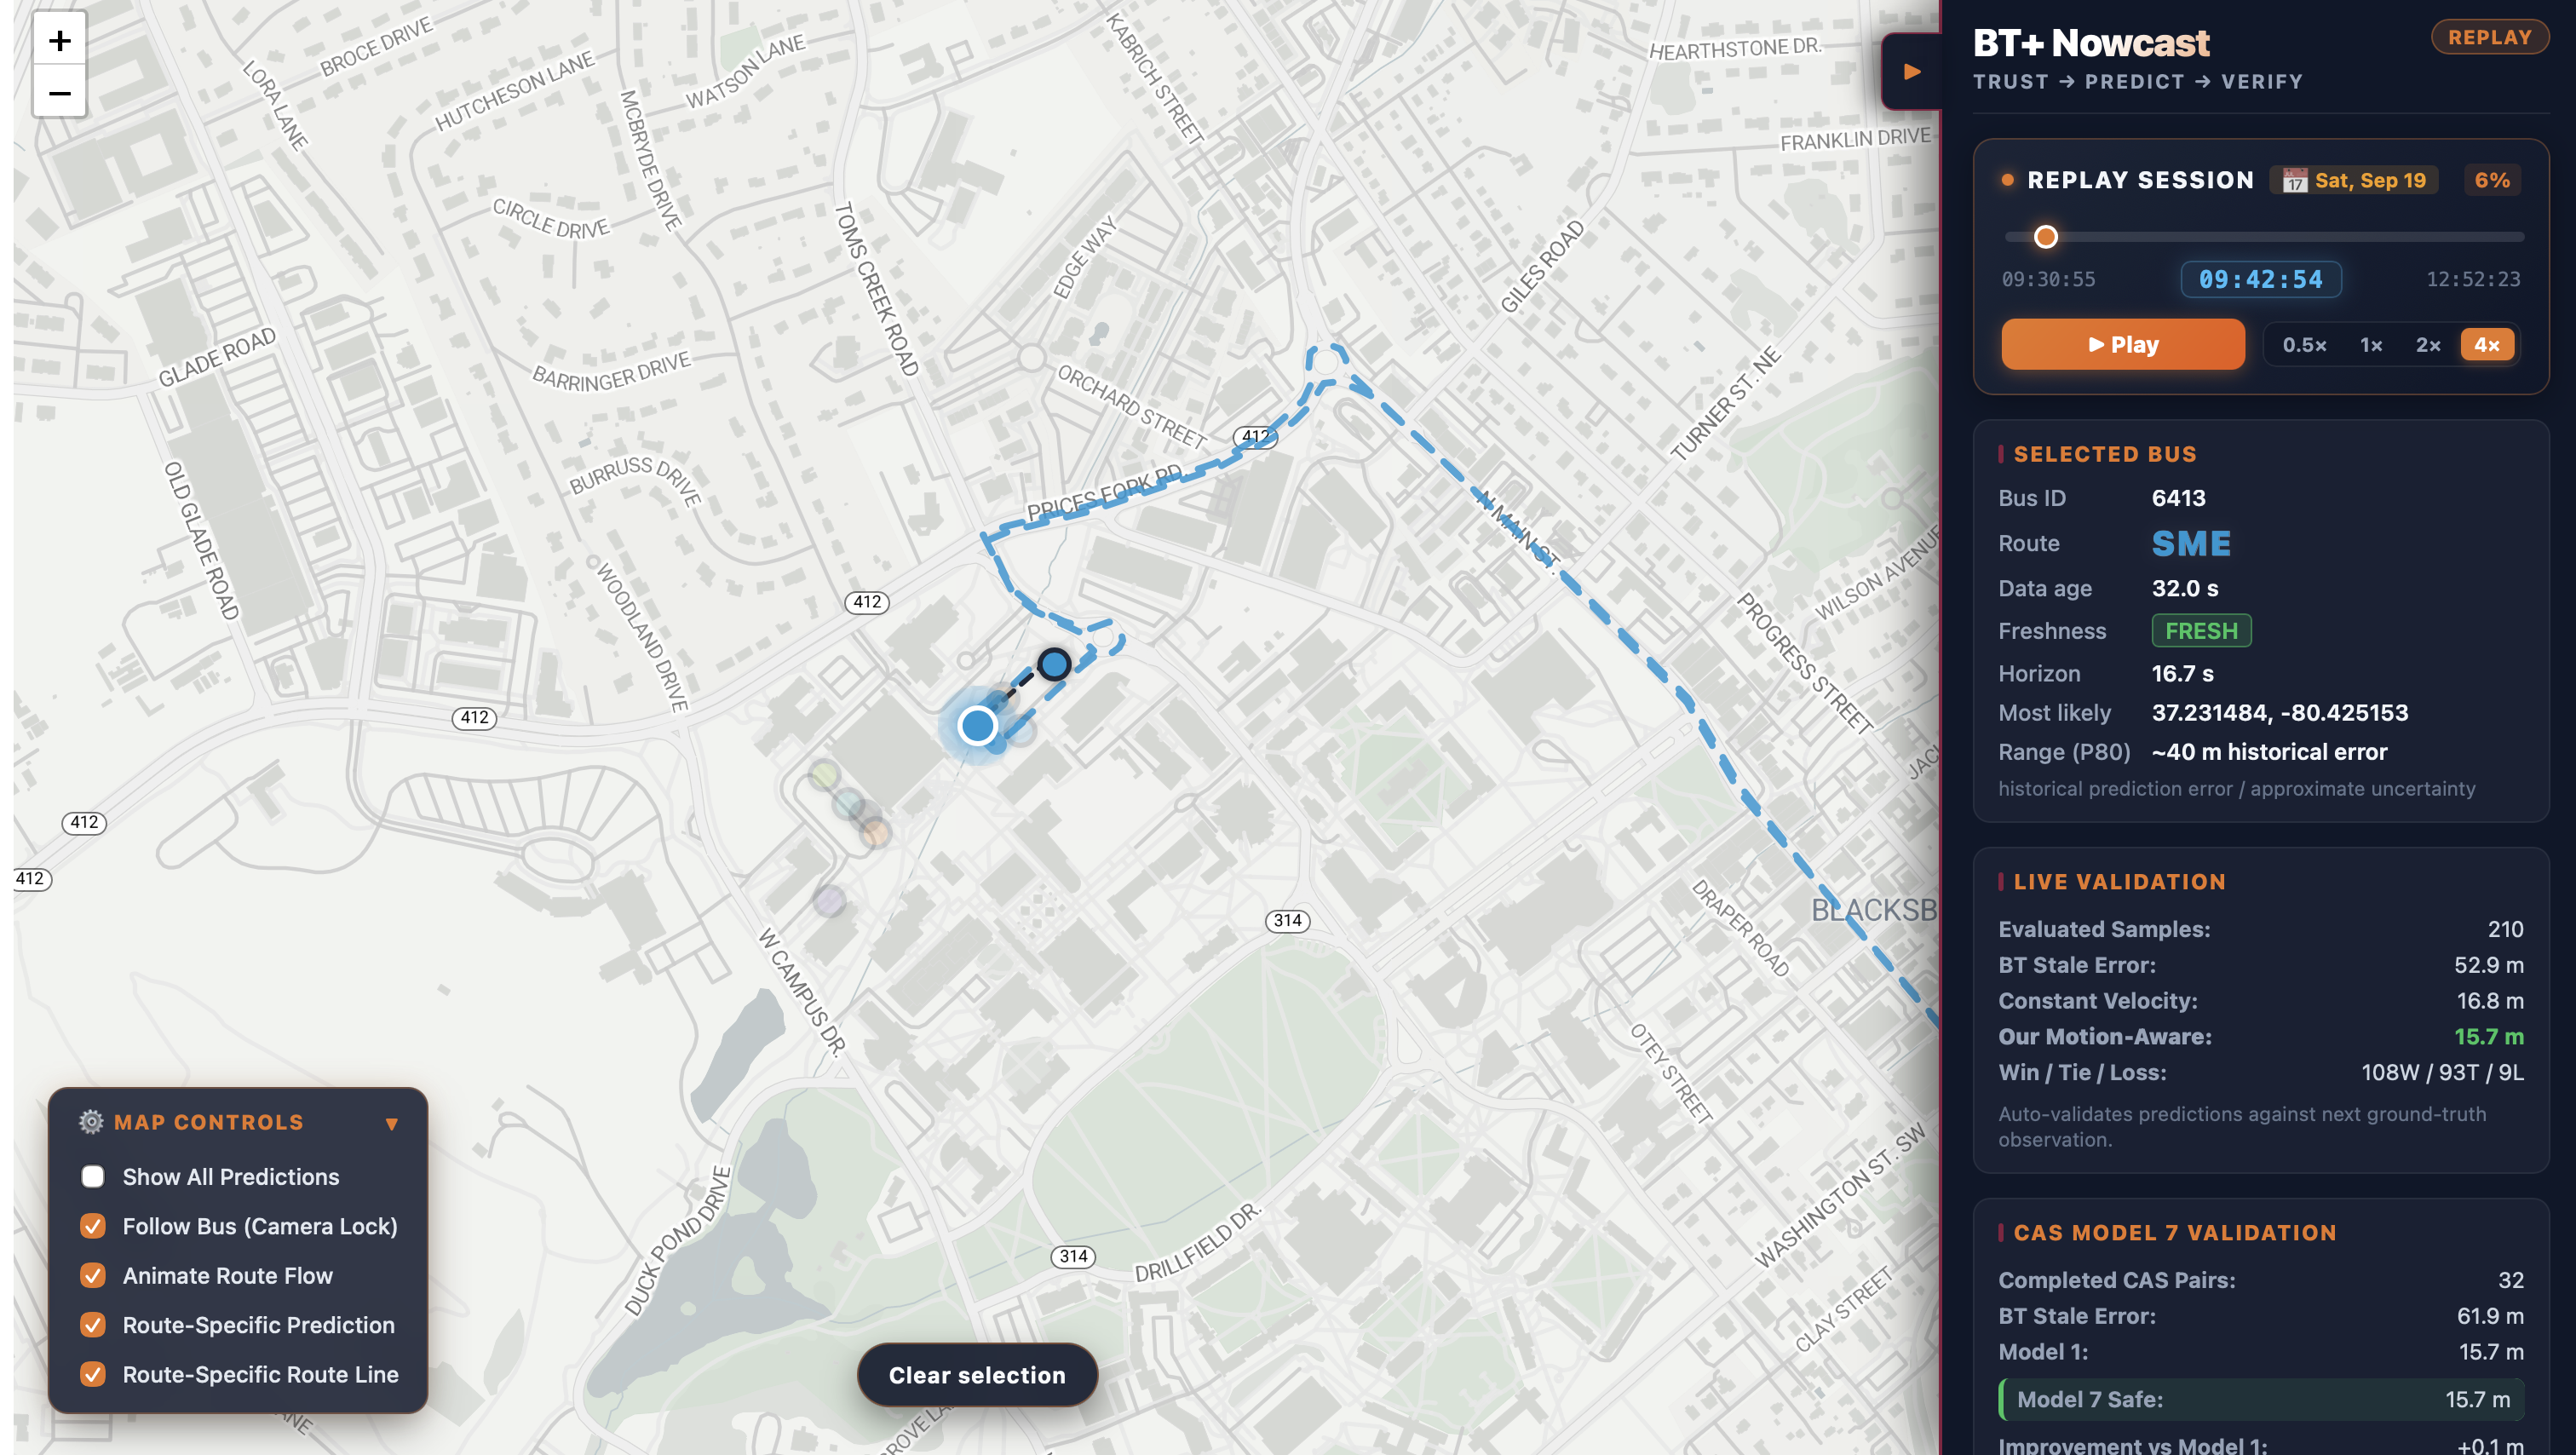
An overall look (Live Mode)
-
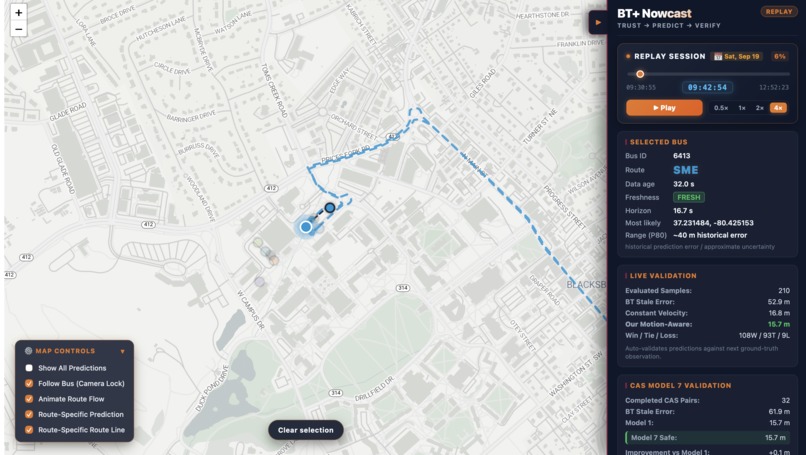
An overall look (Replay Mode for Dev Test)
-
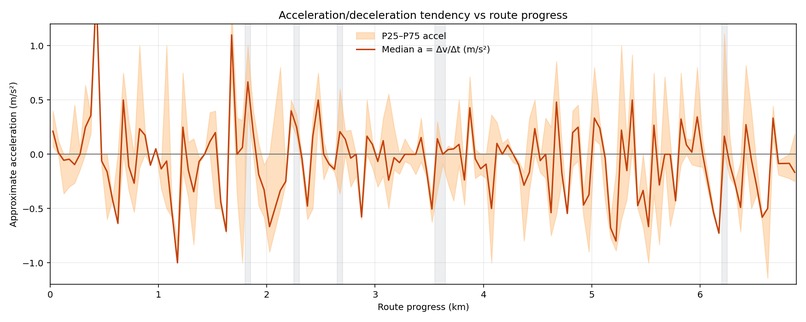
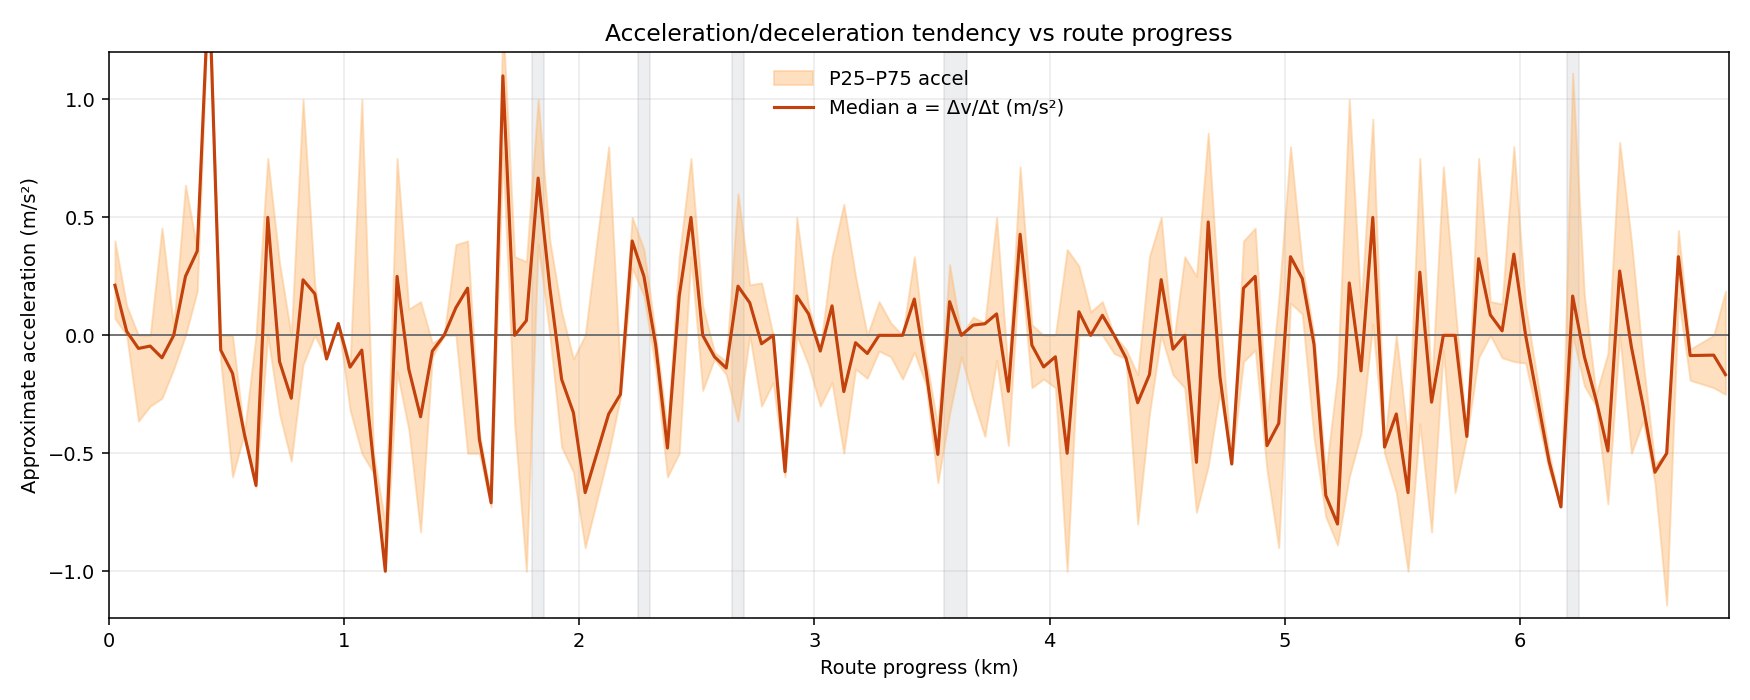
A statistical acceration-progress graph of CAS during 9-11am on Friday
Inspiration
Real-time transit maps create an expectation: if you can see a bus on the map, you should know where it is right now. But in the current BT app, a "real-time" bus location is still an observation from the past. When an update becomes delayed or stale, the marker can remain behind the bus's actual position. For a rider deciding whether to leave a building, cross campus, or wait at a stop, those seconds matter.
We built BT+ around a simple idea: BT tells you where the bus was. We estimate where it is now — and show you how much to trust that estimate. Our design follows three steps: Trust → Predict → Verify.
What it does
BT+ consumes live Blacksburg Transit vehicle data and combines it with GTFS route information to produce a route-aware estimate of a bus's current position.
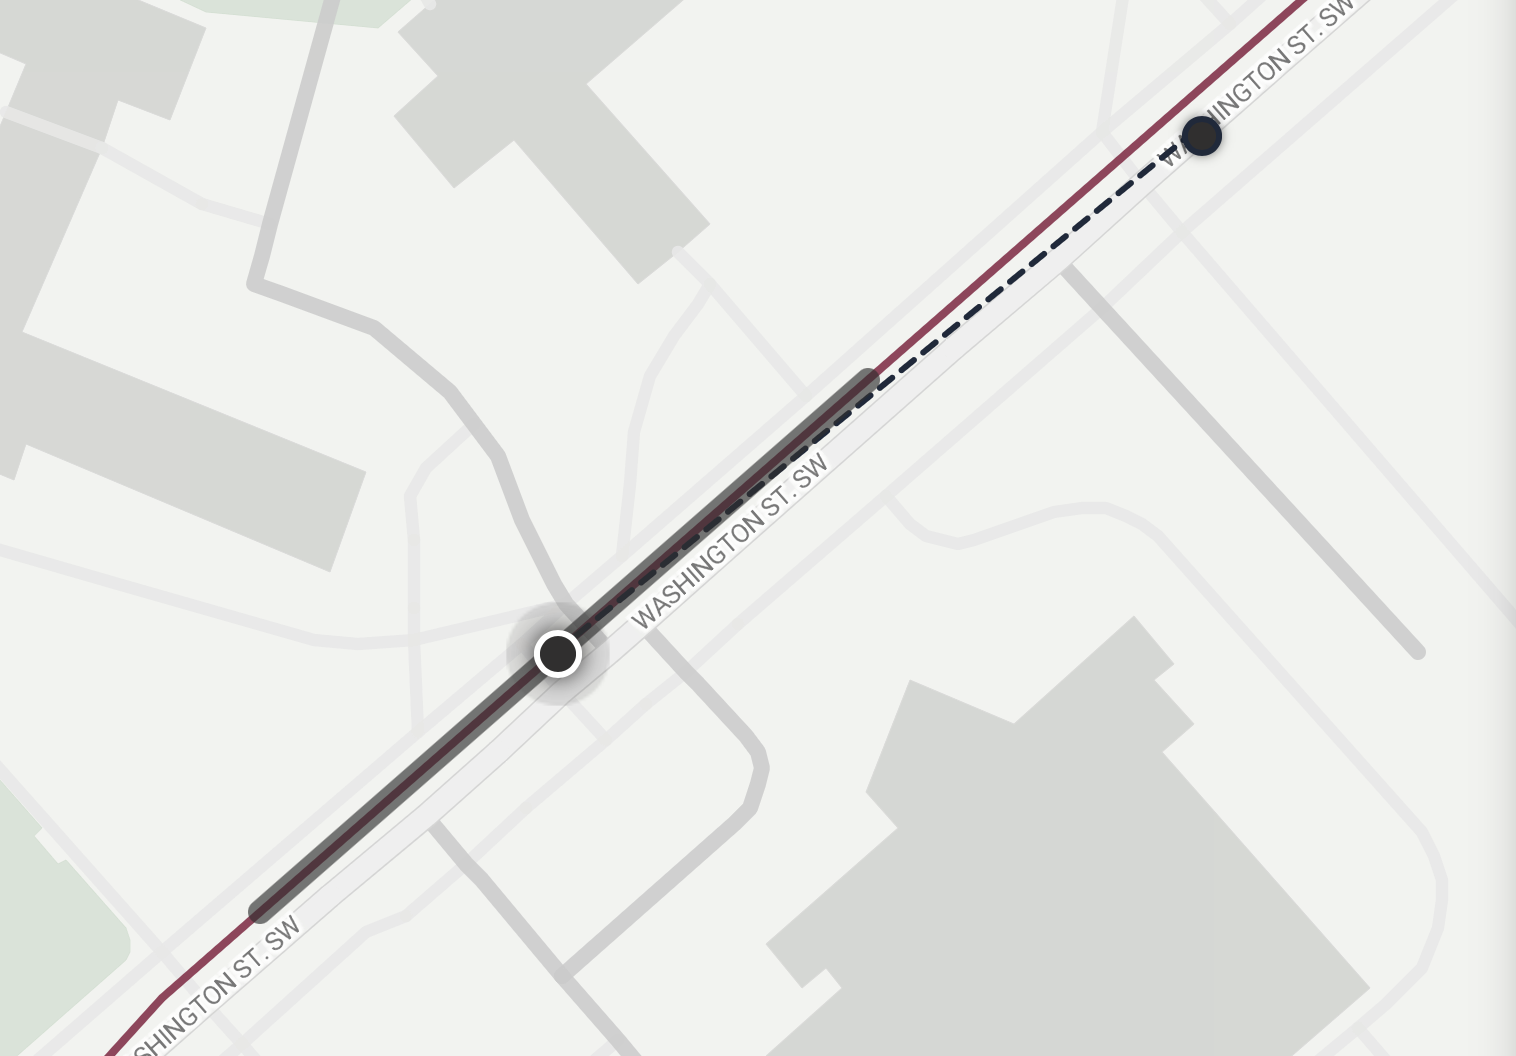
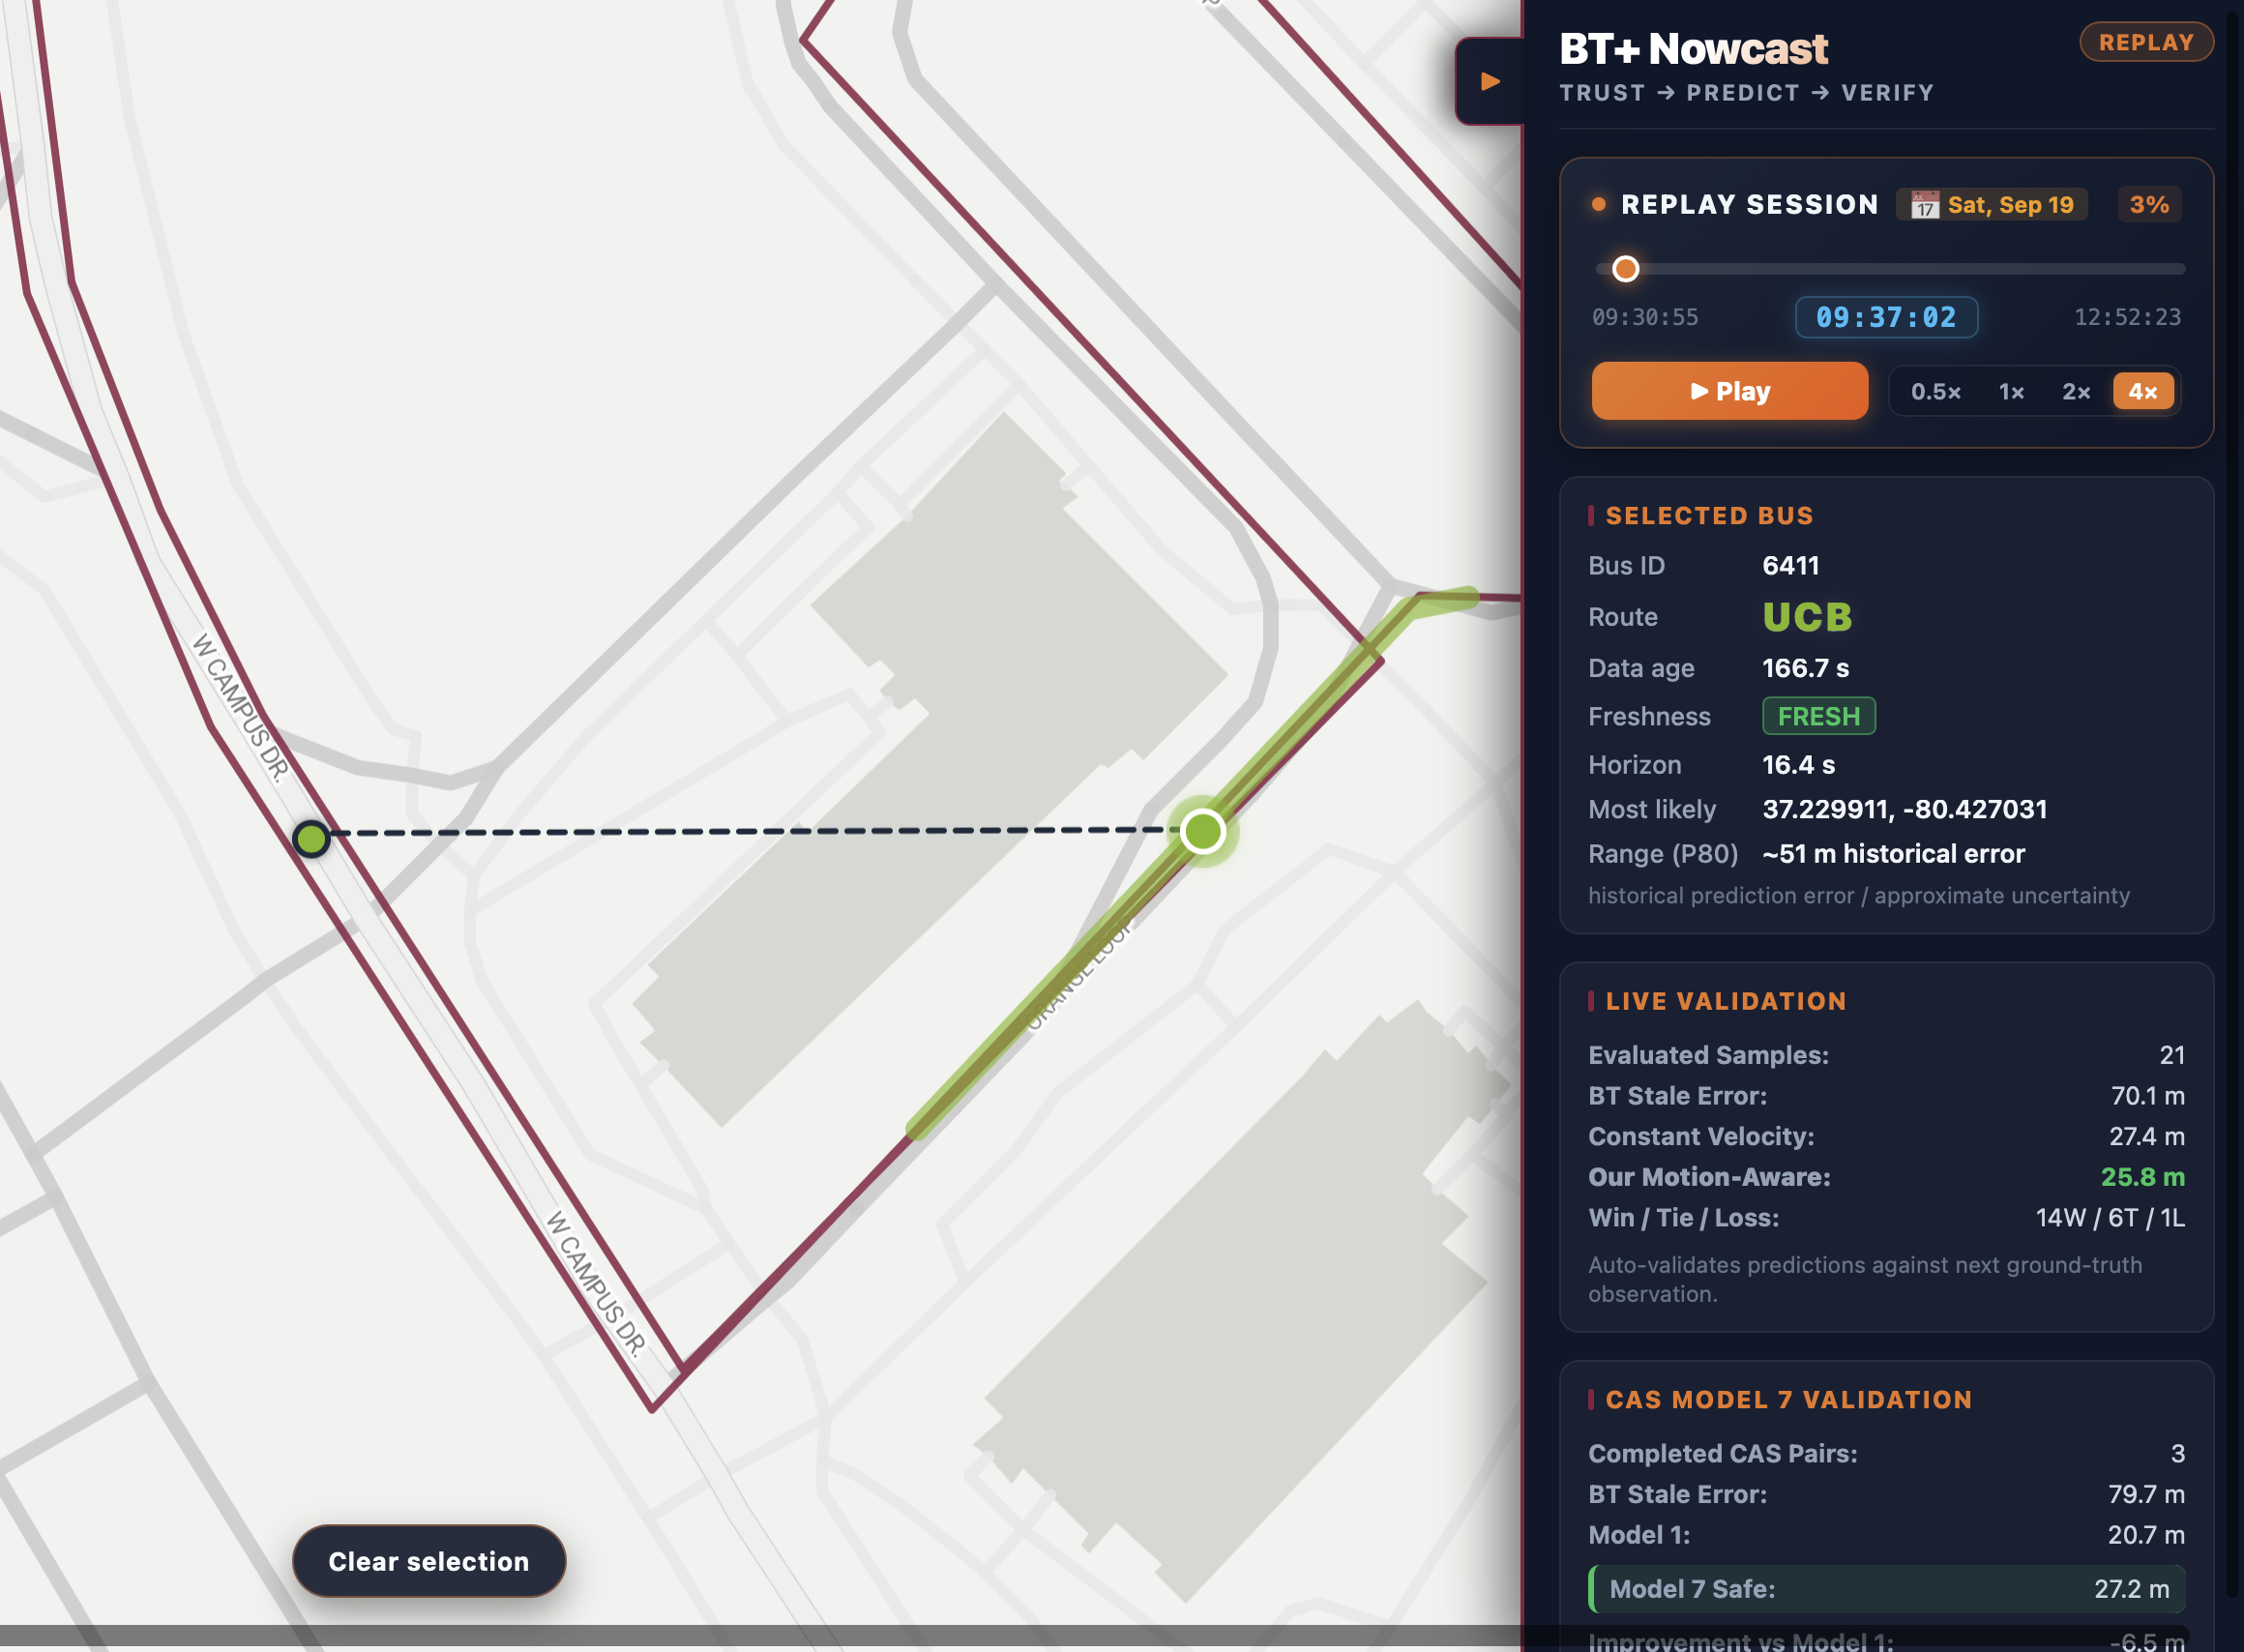
Instead of treating every reported GPS coordinate as equally current, BT+ tracks the age of the latest observation and distinguishes between the original reported position and our predicted position.
For moving buses, our baseline predictor:
- map-matches the reported location onto its GTFS route,
- determines directed progress along the route,
- projects the bus forward using its reported speed and the age of the observation.
We then add a motion-aware residual model that predicts how much this constant-velocity estimate is likely to over- or undershoot. The model is a gradient-boosted tree trained on historical bus observations using features such as recent realized motion, reported speed, prediction horizon, route progress, and distance to scheduled stops.
Rather than replacing the physics-based baseline, the learned model only predicts a correction to it.
For safety, BT+ applies only 50% of the learned correction, a value selected through nested cross-validation to reduce harmful over-corrections. The learned correction is currently restricted to the CAS route, as we trained our model on CAS data; other routes automatically fall back to the route-aware constant-velocity model.
BT+ also communicates uncertainty using historical prediction errors instead of presenting a predicted location as exact.
How we built it
The backend is built with Node.js and JavaScript. It continuously retrieves live Blacksburg Transit observations and joins them with static GTFS route, trip, stop, and shape data.
We implemented our own directed GTFS map-matching and route-progress system. Predictions are represented as progress along route geometry rather than unconstrained latitude/longitude extrapolation, keeping predicted buses on their actual routes.
Our motion-aware predictor uses a HistGradientBoostingRegressor trained offline in Python. We exported the trained tree ensemble and implemented inference in JavaScript so the production backend can run the model directly without a Python service.
We verified the JavaScript implementation against Python-generated parity fixtures and obtained exact numerical parity on our test cases.
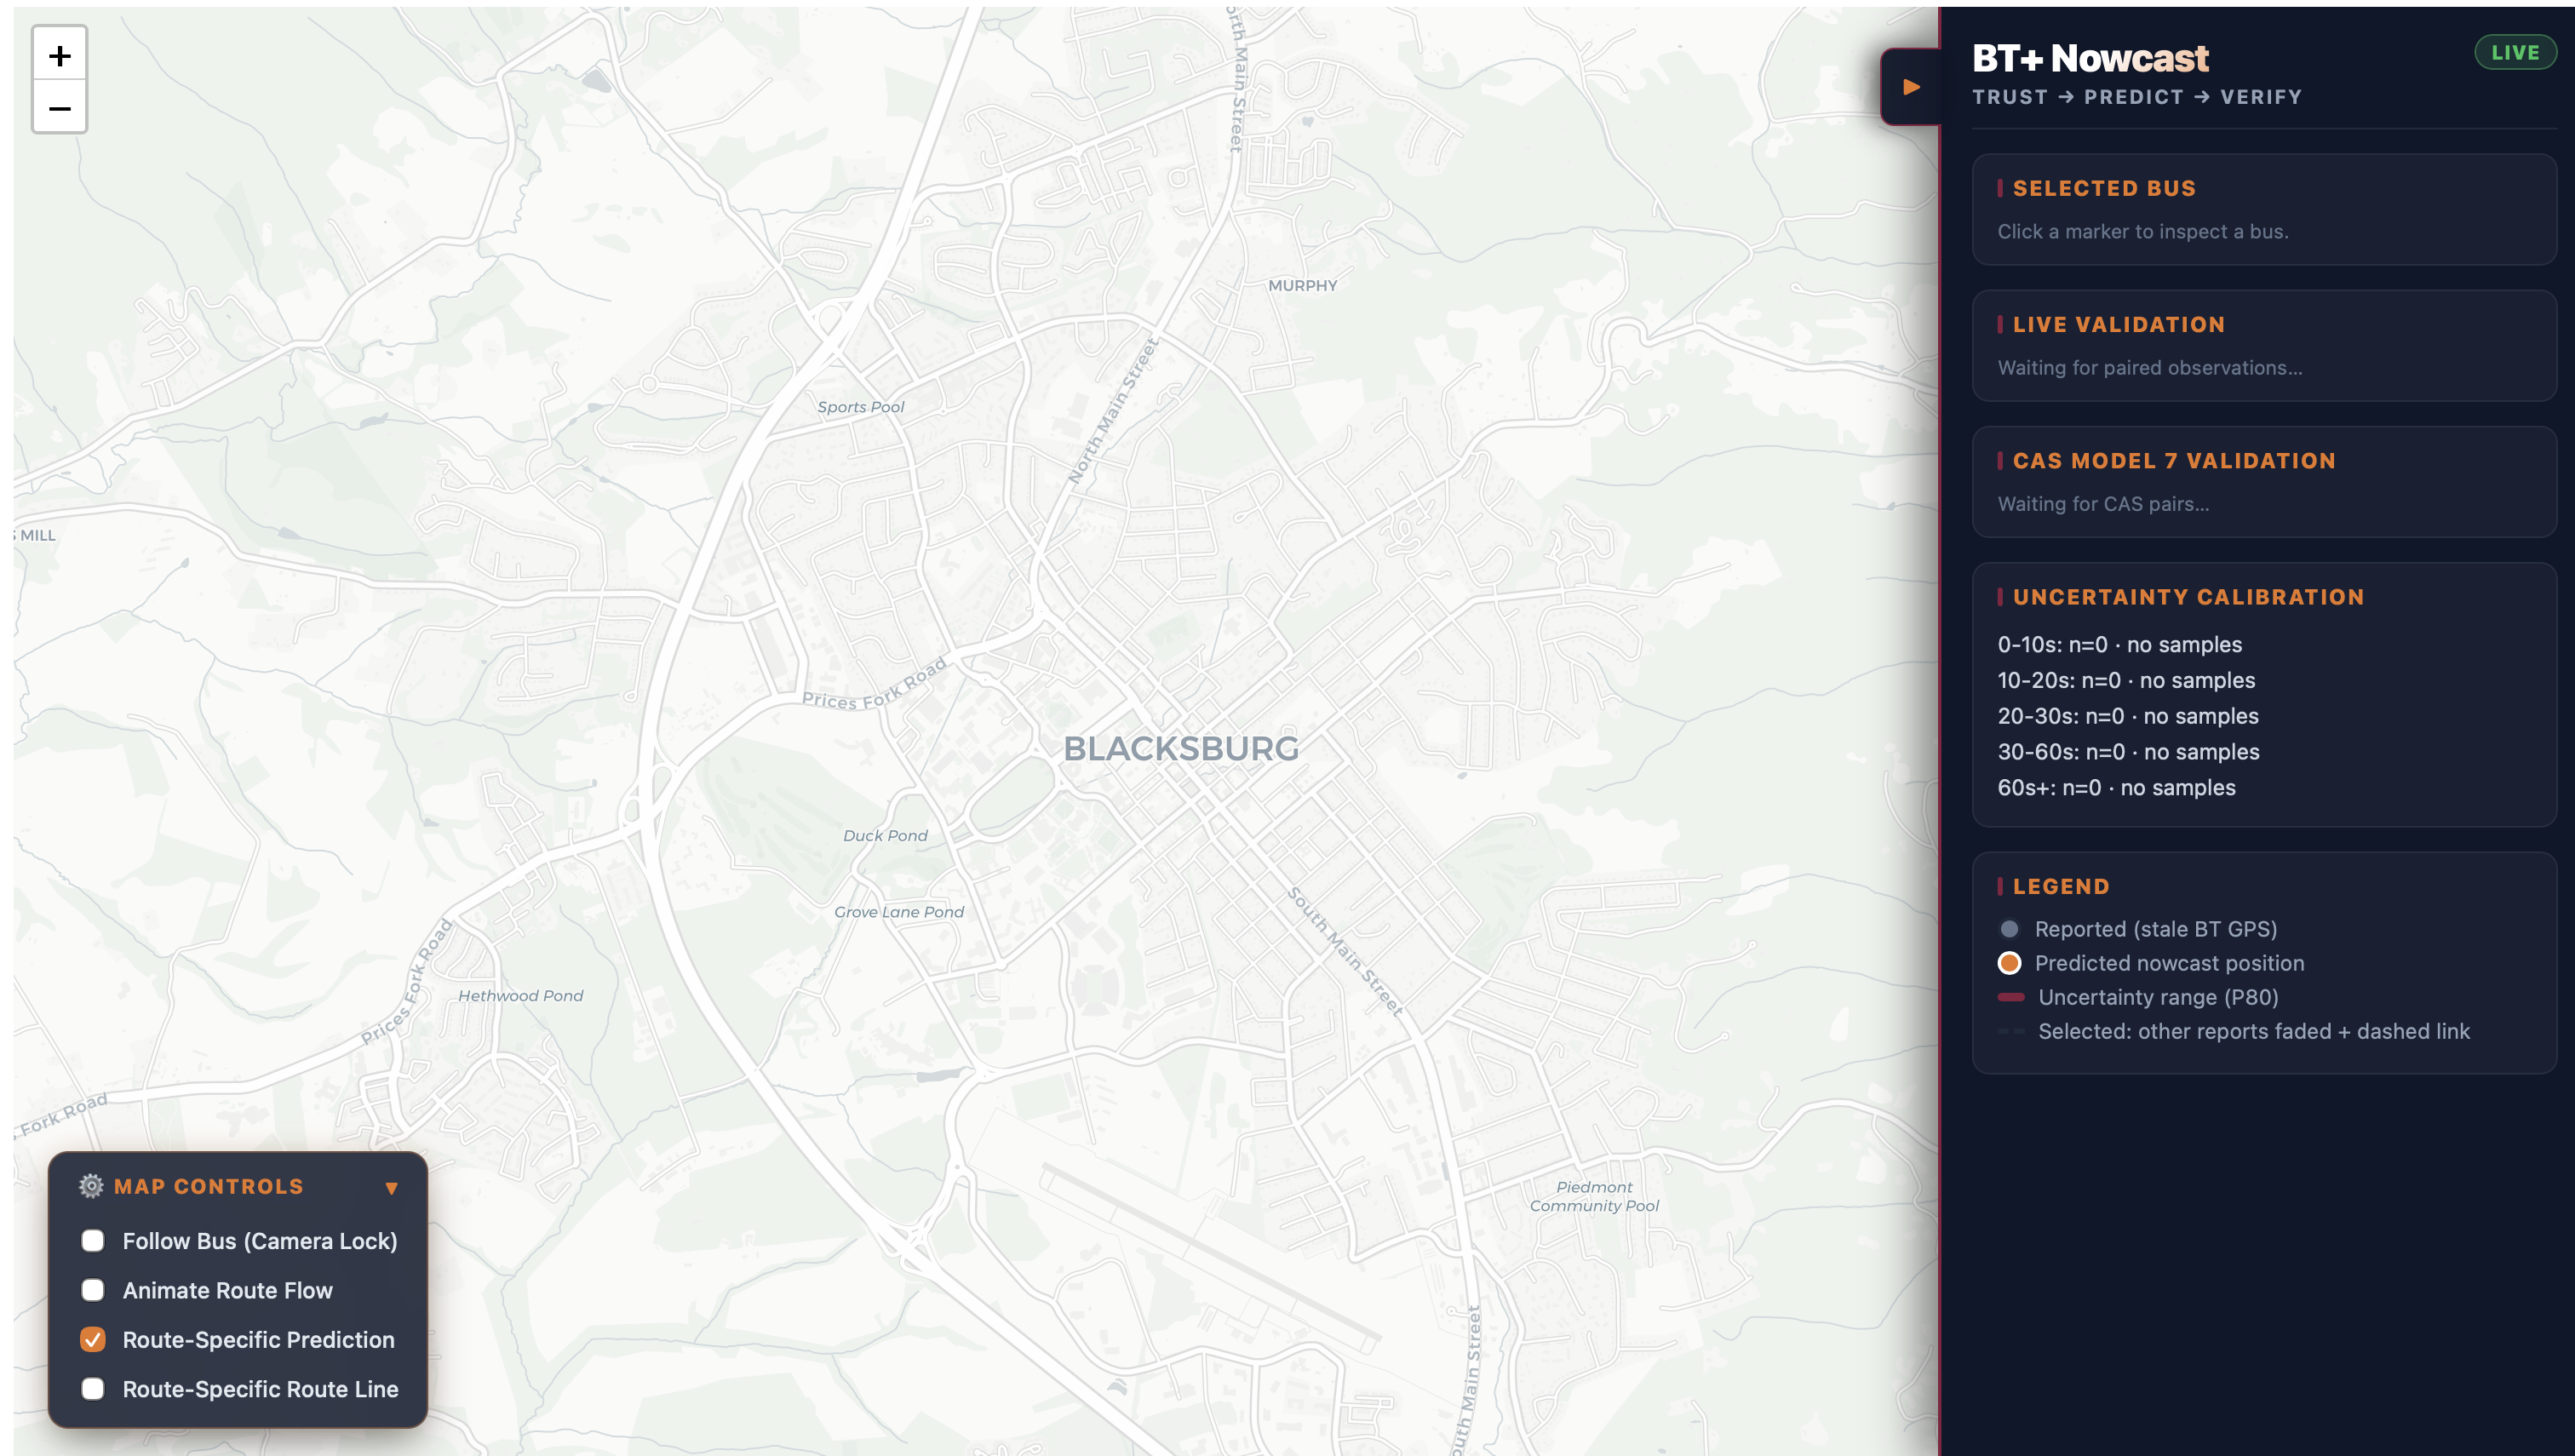
The backend streams state to the frontend using Server-Sent Events (SSE). The frontend uses React, Vite, and Leaflet to visualize reported and predicted bus positions, route geometry, observation age, and prediction uncertainty.
We also built a replay and validation pipeline. A prediction is made using only information available at that moment; when the next real transit observation arrives, BT+ automatically compares the earlier prediction with the newly observed position.
This lets us continuously answer a critical question:
Did predicting the bus actually help?
Validation
We evaluated the learned residual model using leave-one-trip-out cross-validation on CAS bus data. Each fold trained on other bus passes and tested on an entire unseen pass, avoiding random splits between highly correlated neighboring observations.
Across the observed prediction horizons, the motion-aware model improved the constant-velocity baseline while preserving an exact hold behavior for buses reported at very low speeds.
We also maintain live and replay-based validation so predictions can be compared against later transit observations rather than judged only by how convincing they look on a map.
Challenges we ran into
The main challenge is with the prediction model. We tested several approaches based on route position, historical speed patterns, and stop behavior. Some looked promising conceptually but failed when evaluated on held-out bus passes. Route position could tell us where buses usually slow down, but not whether a particular bus was actually entering that motion phase.
That led us to a simpler architecture: keep a strong route-aware physical baseline and use machine learning only to predict its residual error.
Another challenge was dealing with loop routes, route direction, stale observations, GPS snapping, trip changes, and missing motion history without allowing predictions to jump backward or onto the wrong part of a route.
Finally, we had to separate what the system knows now from information that only becomes available later. Future GPS observations are used for verification, never as prediction inputs.
Accomplishments that we're proud of
- Built an end-to-end live transit prediction pipeline using real Blacksburg Transit data.
- Implemented directed GTFS map-matching and route-constrained prediction.
- Built a gradient-boosted residual model that improves a strong constant-velocity baseline on held-out CAS bus passes.
- Implemented the trained Python model directly in JavaScript with exact parity testing.
- Added explicit fallbacks so the learned model is only used within its validated route scope.
- Built replay and automatic future-observation validation instead of relying only on visual demos.
- Designed BT+ around transparent uncertainty rather than pretending every prediction is exact.
What we learned
The most important lesson was that prediction quality is not just about choosing a more sophisticated model.
A simple baseline, careful evaluation, and clear fallbacks can matter more than model complexity. Recent realized motion turned out to be much more useful than trying to memorize where buses usually accelerate or brake.
We also learned to treat uncertainty and validation as product features. A transit prediction is much more useful when riders can see not only where the system thinks the bus is, but also how old the underlying information is and how reliable similar predictions have historically been.
What's next for BT+
Our current learned correction is deliberately limited to the CAS route because that is the route represented in our training data.
The next step is to collect data across additional Blacksburg Transit routes and evaluate a network-wide model using route-level holdouts. We also want to improve uncertainty calibration using signed out-of-sample prediction errors and evaluate predictions against denser independent location data. Where data access permits, we could also incorporate real-time traffic conditions and traffic signal status as additional prediction features.
The long-term goal is simple: make real-time transit maps honest about the gap between the last observation and the present.

Log in or sign up for Devpost to join the conversation.