-
-
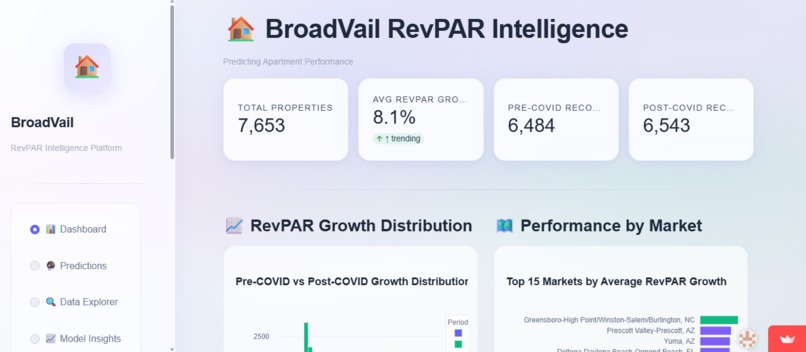
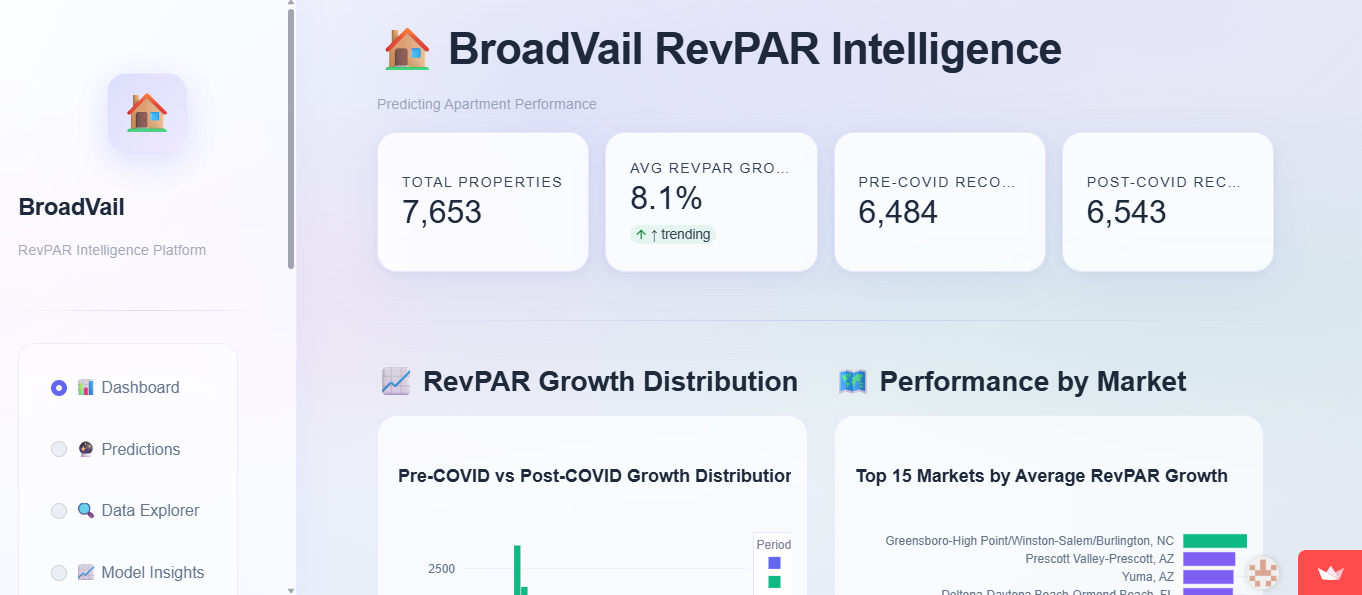
BroadVail RevPAR Intelligence Dashboard
Inspiration
The project started with the Rice Datathon 2026 Finance Track challenge: predict which multifamily properties outperform peers on RevPAR growth. The "15-minute city" concept—that walkable neighborhoods with nearby amenities improve quality of life—was a natural lens. COVID reshaped renter preferences, making local amenities more important than downtown proximity. This project tests whether data supports that shift and whether we can quantify it. The challenge had two goals:
- Predict which properties outperform peers
- Identify which feature combinations explain outperformance This aligned with our interest in applying machine learning to real estate and urban planning.
What it does
BroadVail RevPAR Intelligence Platform predicts RevPAR growth for multifamily properties using machine learning. It:
- Predicts growth: Generates pre-COVID (2015–2020) and post-COVID (2022–2025) growth predictions for each property
- Ranks properties: Assigns quartile rankings (1–4) to identify top performers
- Explains drivers: Analyzes feature importance to show which factors drive outperformance
- Provides insights: Delivers actionable insights for investors, urban planners, and renters The system processes 8,997 properties and automatically fills all required columns using verified formulas: $$\text{RevPAR Growth} = \frac{\text{RevPAR}{t_2} - \text{RevPAR}{t_1}}{\text{RevPAR}{t_1}}$$ $$\text{RevPAR}{t_2} = \text{RevPAR}{t_1} \times (1 + \text{Predicted Growth})$$ It includes an interactive Streamlit dashboard for exploration and a production-ready prediction pipeline.
How we built it
- Data preparation We started with 996 properties across multiple markets, with data for pre-COVID (2015–2020) and post-COVID (2022–2025). Steps: Missing value handling: Median imputation for numeric, 'Unknown' for categorical Multi-phase buildings: Handled same UBID with different year built Outlier treatment: Clipping at 1st/99th percentiles Target creation: Based on time_window_tag (pre/post COVID)
- Feature engineering We created 62 derived features from 40+ raw features, resulting in 134 total features:
- Amenity density: Count / trade area size $$\text{Amenity Density} = \frac{\text{Amenity Count}}{\text{Drivetime Area}}$$
- Amenity ratios: Quality indicators like sit-down restaurant ratio $$\text{Sit-down Ratio} = \frac{\text{Sit-down Restaurants}}{\text{Total Restaurants}}$$
- Composite scores: AARP metrics for proximity, transit, health, housing
- Building features: Age, renovation status, size indicators
- Supply/demand: Growth rates, new units entering market
- Affordability: Rent-to-mortgage ratio, rent advantage indicators
- Time-based: Pre/post-COVID indicators, time window tags
Model development We tested multiple approaches: Baseline: Ridge regression (RMSE: 0.1337, R²: 56.0%) XGBoost: RMSE: 0.1095, R²: 70.5% LightGBM: RMSE: 0.1104, R²: 70.0% Ensemble: Weighted average (XGBoost: 60%, LightGBM: 40%) Final ensemble performance: RMSE: 0.1092 (18.3% improvement over baseline) R²: 70.6% MAE: 0.0788
Cross-validation strategy We used GroupKFold with 5 folds, grouped by UBID to prevent data leakage. This ensures the same property never appears in both train and validation sets.
Production system We built: Automated training pipeline (train.py) Prediction generation script (generate_full_submission.py) Feature importance analysis (analyze_feature_importance.py) Interactive Streamlit dashboard Documentation and reproducibility scripts
Challenges we ran into
- Data quality and missing values Many properties had missing amenity data, especially in suburban areas. We used median imputation for numeric features and 'Unknown' for categorical, but this may have reduced signal in amenity-poor areas.
- Preventing data leakage Initial cross-validation allowed the same property (UBID) in both train and validation sets, inflating performance. Switching to GroupKFold grouped by UBID fixed this and gave realistic estimates.
- Feature engineering complexity With 134 features, identifying the most important was hard. We categorized features (property characteristics, neighborhood context, amenities, time period) and used feature importance from the ensemble model to focus on the top drivers.
- Model selection and ensemble weighting XGBoost and LightGBM performed similarly. We tested multiple ensemble weights and chose 60/40 based on cross-validation performance.
- Counterfactual predictions We needed separate predictions for pre- and post-COVID periods. We used the time_window_tag feature to create counterfactual scenarios, allowing the model to predict how properties would perform in different time periods.
- Scale and performance Scoring 8,997 properties required efficient inference. We optimized the pipeline to generate predictions in ~30 seconds while maintaining accuracy.
Accomplishments that we're proud of
- Model performance: Achieved 70.6% R² with an 18.3% RMSE improvement over baseline
- Feature insights: Identified that property characteristics (21.1%), neighborhood context (6.0%), time period effects (4.7%), and amenities (1.0%) combine to explain growth patterns
- Optimal drivetime: Found that 10-minute drivetime radius provides best predictive power (RMSE: 0.1091), supporting the "15-minute city" concept
- Production-ready system: Built a complete pipeline with web interface, automated scripts, and comprehensive documentation
- Comprehensive analysis: Scored 8,997 properties with all required columns filled and formulas verified
- Time period insights: Discovered that only 20% of properties remained in the same performance quartile between pre- and post-COVID periods, showing a structural market shift
What we learned
- Time period effects dominate: Pre/post-COVID indicators account for about 67% of prediction importance. The market shifted structurally: only 20% of properties stayed in the same performance quartile between pre- and post-COVID periods. This suggests COVID changed what drives property performance.
- Property characteristics matter most- a. Feature importance shows:
- Property characteristics: 21.1% of predictive power
- Neighborhood context: 6.0%
- Time period effects: 4.7%
- Amenities: 1.0% b. The top predictors were:
- Average rent levels (importance: 198.8)
- Number of units (177.2)
- Year built (166.4)
- Average mortgage (137.6)
Area per unit (137.2)
The 10-minute drivetime is optimal Testing 10-, 15-, and 30-minute radii showed 10 minutes provided the best predictive power (RMSE: 0.1091 vs 0.1092 for 15 minutes). This supports the "15-minute city" idea, with a slight edge to a tighter radius.
Amenities have subtle but real impact While amenities contribute only 1% of predictive power, the sit-down restaurant ratio was the most important amenity feature. This suggests quality and type of amenities matter, not just quantity.
Post-COVID market dynamics Post-COVID growth averaged 14.8% (range: -19% to +58%), compared to pre-COVID mean of 2.0% (range: -21% to +44%). This shows a strong recovery and structural shift in market dynamics.
What's next for BroadVail RevPAR Intelligence
- Expand dataset: Include more recent data and additional markets to improve accuracy and relevance
- External indicators: Explore economic indicators (employment, GDP, interest rates) to enhance predictions
- Real-time capabilities: Build real-time prediction APIs for live property analysis
- Quartile reshuffling: Investigate why 80% of properties changed quartiles between periods and its impact on long-term strategies
- Advanced features: Incorporate satellite imagery, foot traffic data, and social media sentiment
- Model refinement: Experiment with deep learning and time series models to capture temporal patterns
- User experience: Enhance the Streamlit dashboard with interactive maps, property comparisons, and scenario analysis
- Deployment: Deploy as a cloud service for investors and property managers
Built With
- api
- lightgbm
- lightgbm;-data-processing:-pandas
- matplotlib
- numpy
- openai
- pandas
- plotly
- python
- scikit-learn
- seaborn
- streamlit
- web;-dashboard:-streamlit;-visualization:-plotly
- xgboost

Log in or sign up for Devpost to join the conversation.