-
-
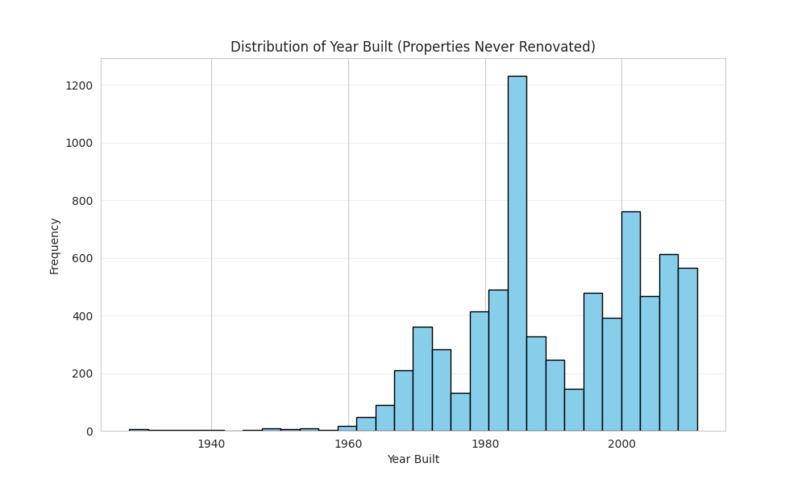
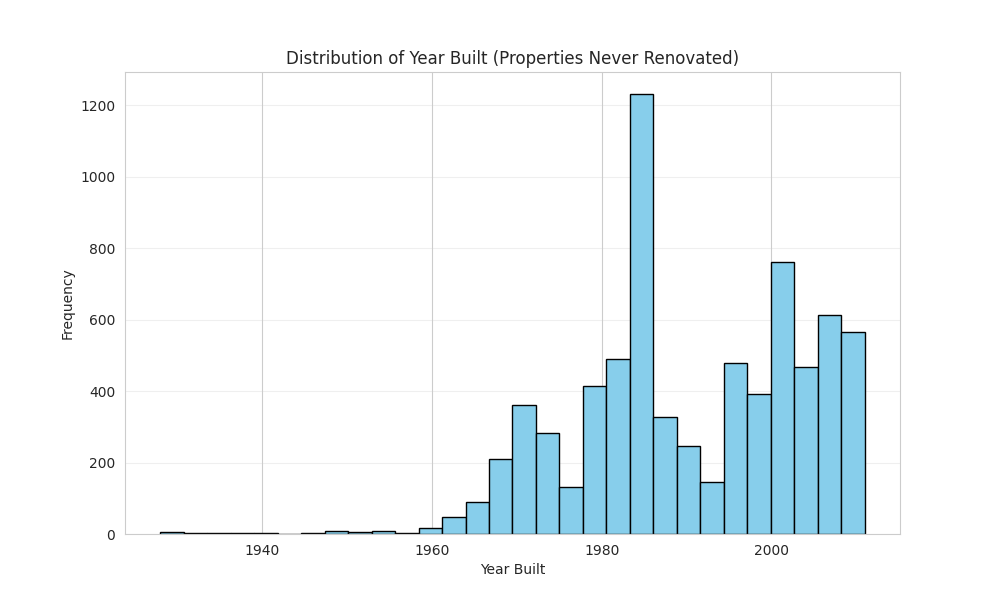
Histogram of Build Year among Houses that were not Rebuilt
-
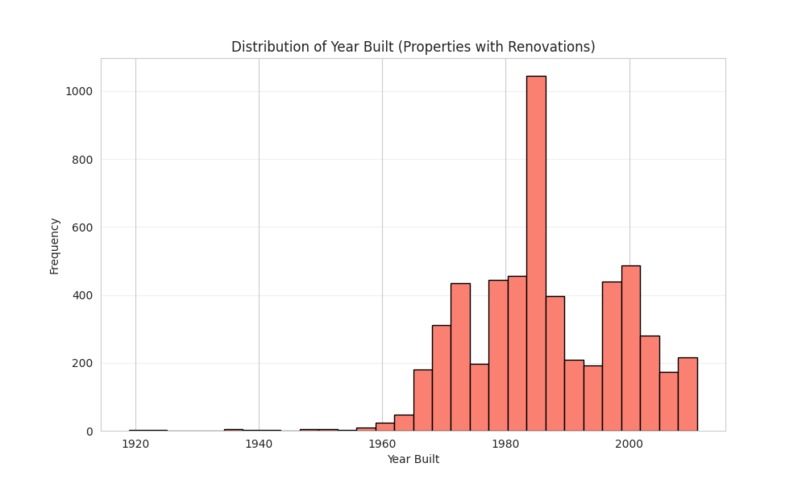
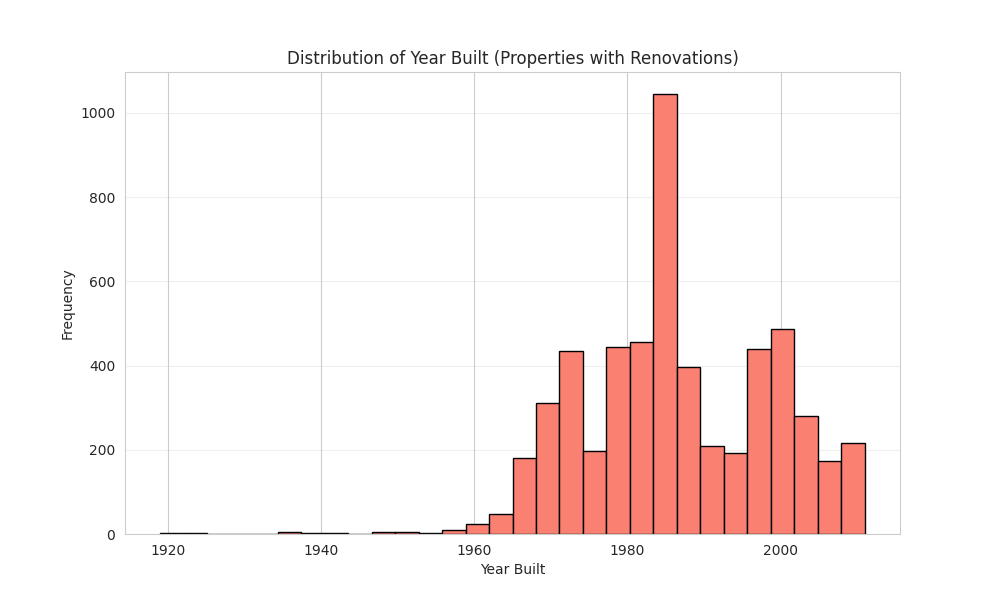
Histogram of Build Year among Houses that were Rebuilt
-
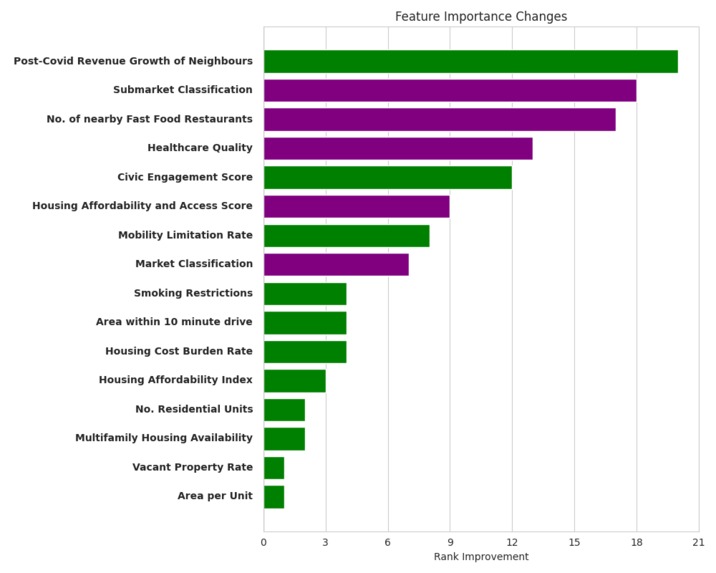
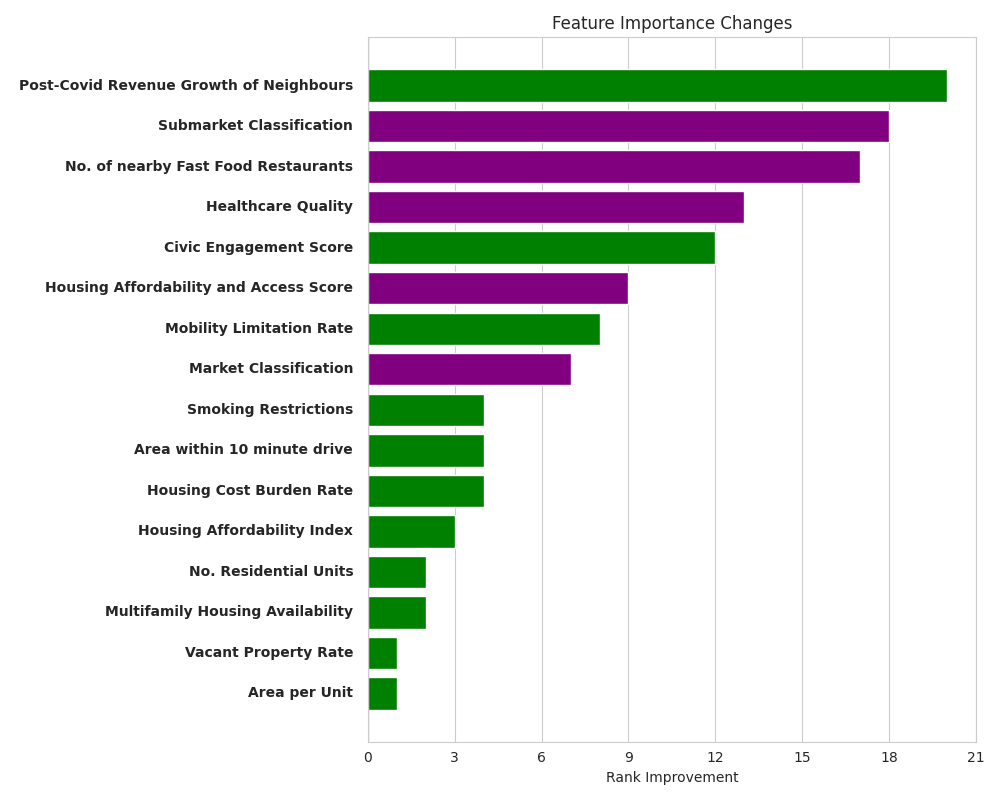
Rank Increases among top 20 features Post Covid relative to Pre Covid
-
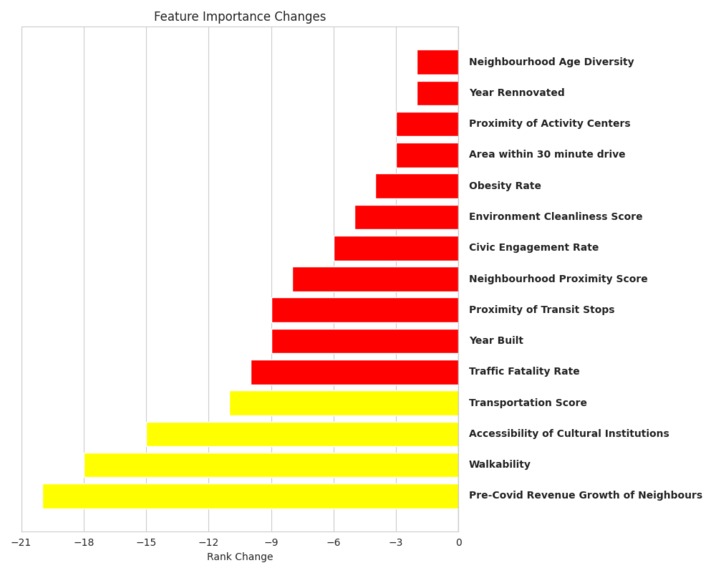
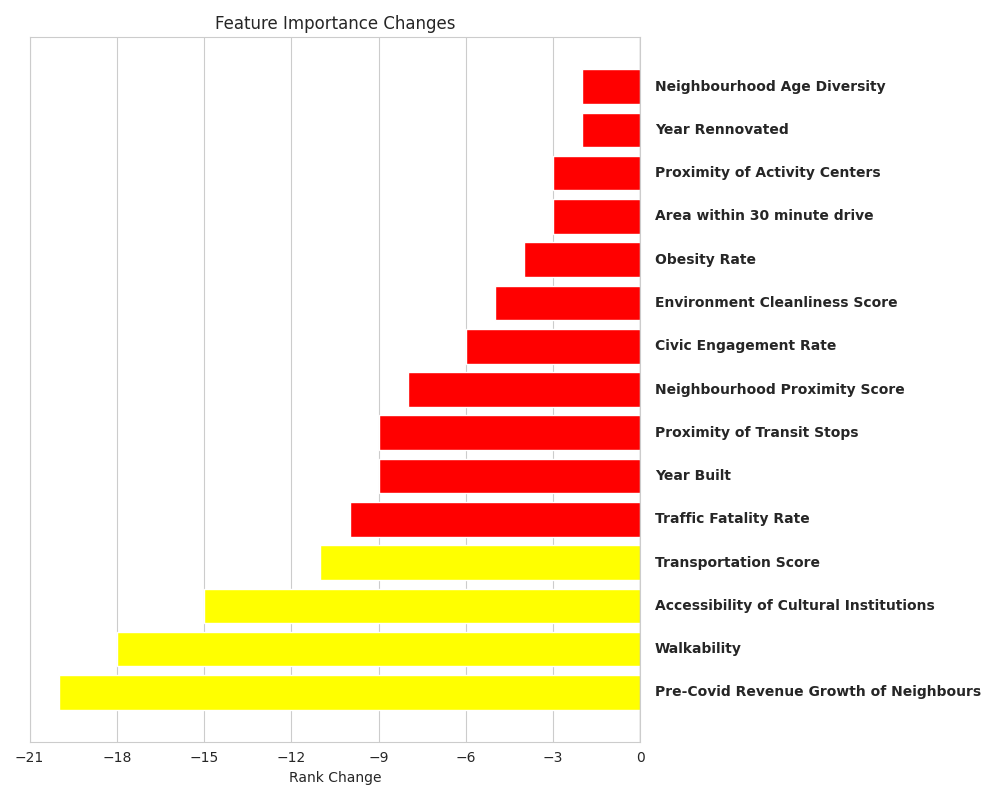
Rank Decreases among top 20 features Post Covid relative to Pre Covid
-
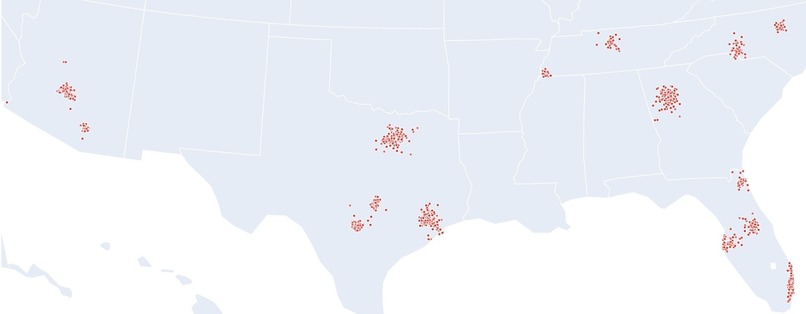
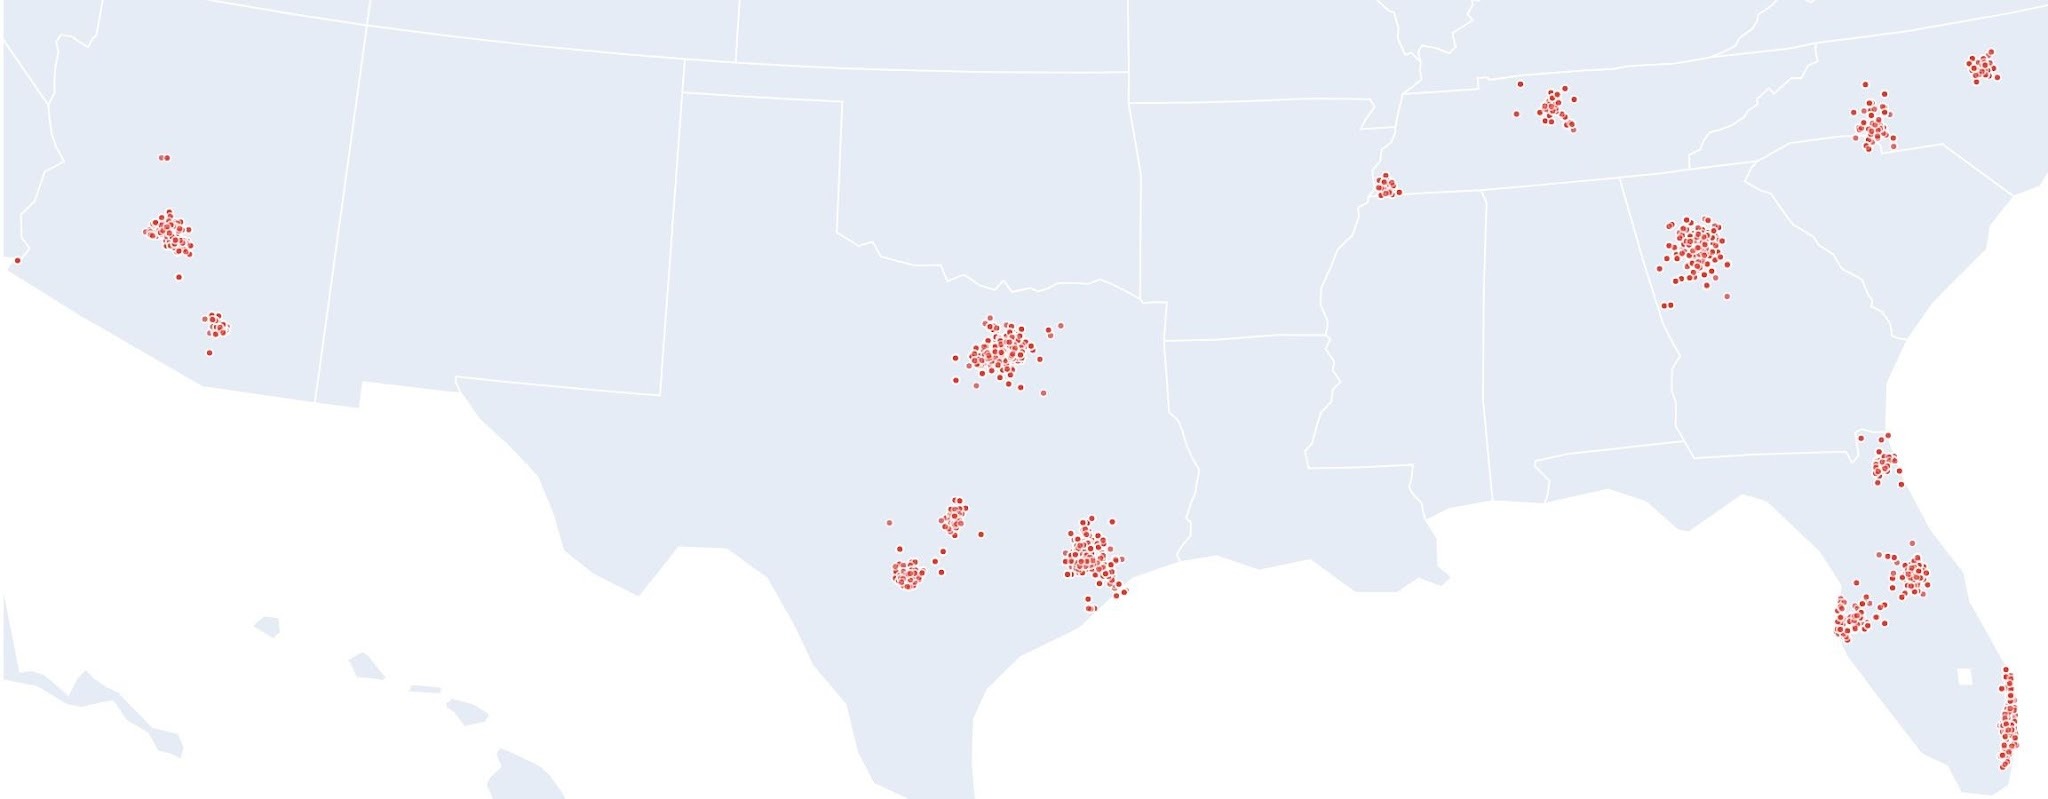
Apartment Locations in Testing Dataset
-
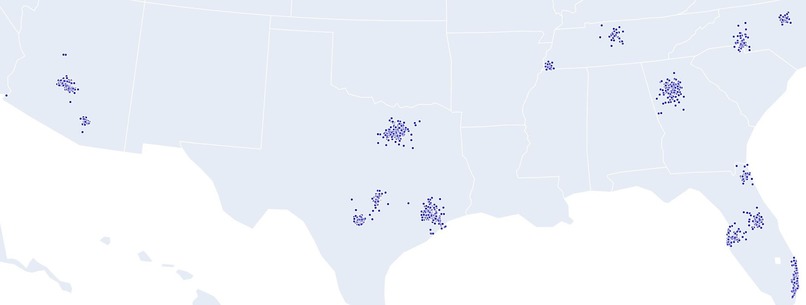
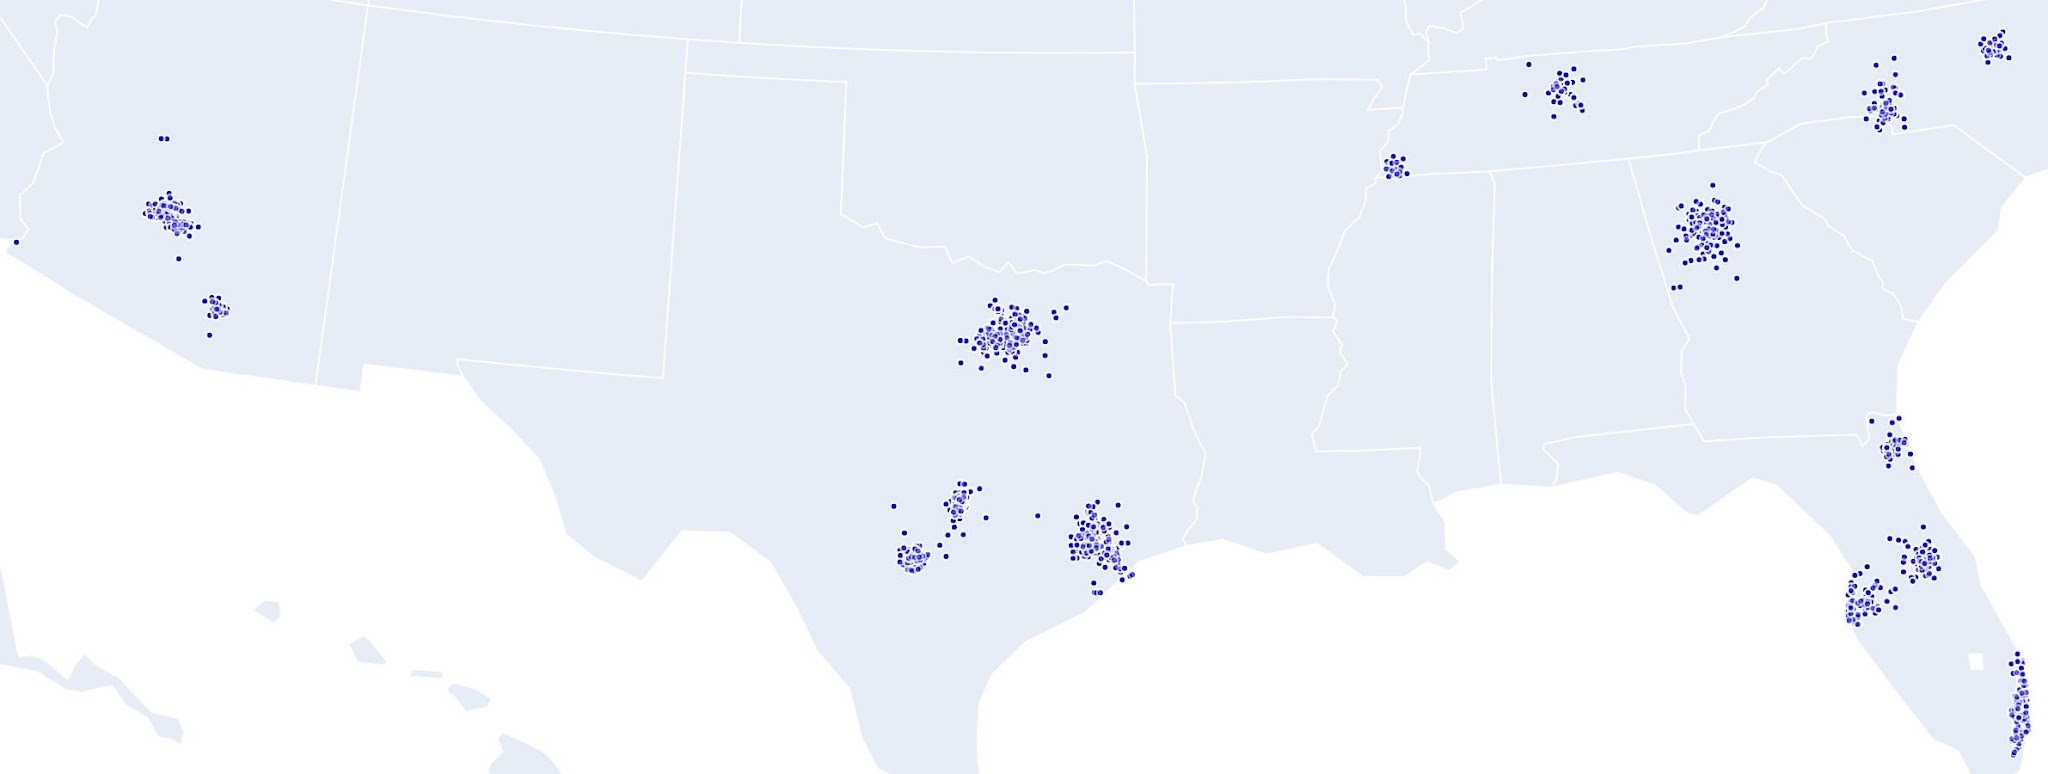
Apartment Locations in Training Dataset
Inspiration
The COVID-19 altered the intersection of work and life, redefining the priorities behind residential location choices. As commutes shortened, remote work expanded, and daily needs became more localized, long-standing assumptions about what makes a neighborhood valuable began to shift. These changes created a natural experiment in how apartment markets respond to evolving renter preferences. We were inspired by the challenge of using data to capture this transformation. By examining apartment revenue growth across Pre- and Post-COVID timelines, we set out to understand not only which properties outperformed, but why. Juxtaposing these two economic chapters allowed us to move beyond static, location-based analysis and instead explore how accessibility, amenities, and neighborhood context interact under different definitions of “local.”
What it does
Our project aims to predict apartment revenue growth by modeling how locational, neighborhood, and economic factors such as access to amenities like schools, grocery stores, and healthcare interact across Pre- and Post-COVID markets. In doing so, the model helps identify which properties are likely to outperform their peers and how the drivers of success have shifted over time.
How we built it
We built our project using a combination of data preprocessing, feature engineering, and machine learning techniques.
Data Wrangling
Dropped Columns:
Removed high-cardinality location fields (City, State, Market) in favor of Zip Code to maintain granularity and reduce redundancy without overfitting. We also dropped some redundant labels for the area to remove collinearities. Finally, we dropped all features related to RevPAR to prevent data leakage
Imputing:
We plotted a histogram of build year for buildings with missing renovation year and compared to a histogram for buildings without missing renovation year. Since a large chunk of buildings with missing renovation year were built post 2000, we concluded that these buildings probably were never rebuilt. We decided to impute the build year as the renovation year instead of dropping the renovation year feature entirely. We also handled "infinite" growth cases (where baseline was zero) by capping using the dataset maximum. For all other missing numerical data, we imputed them with the dataset mean. This ensured that after the numerical columns where scaled these filled values wouldn't be anomalously larger or smaller but will be set to 0.
Encoding
For high cardinality categorical features with an obvious progression (e.g. Market Classification), we decided to use Ordinal Encoding. A+ was assigned 1, A was assigned 2 etc For missing values, we imputed them with the mean of the (now numerical) column to ensure that it would be set to 0 after it was scaled. For other categorical features, we encoded them with a OneHotEncoder
K Nearest Neighbours
When visualizing the geographic distribution of our dataset, we noticed that the apartments were clustered together. Thus, we decided to capture spatial relationships by taking the RevPAR growth of the 5 nearest neighbors by Euclidean distance and storing it in a new feature.
Scaling
For numerical data with the scope of Trade Area, we decided to scale them separately using the means of the Trade Area. This was because it didn't make sense to compare the number of amenities within a 10 minute drive to the number of amenities within a 30 minute drive. For other numerical data, we scaled them using the mean of the combined dataset. This ensured that all numbers were compared with a single mean rather than 3 different means.
Models
Feature Selection
We used a GridSearch with 10-Fold Cross Validation to tune the number of trees and the maximum depth of a Random Forest Model. We then extracted the top 20 features from this model in order to trim our dataset and reduce the noise. The precise top 20 features can be seen in the images below
Neural Network
We trained a neural network for 500 epochs with early stopping to avoid overfitting. We also tuned hyperparameters, in particular, we tried including all features vs. just the top 20 ones, and 8 different architectures. We got an RMSE of 0.081 and 0.0786 for Pre and Post COVID RevPAR growth respectively.
Random Forest
After trimming the dataset to the top 20 drivers, we performed another GridSearch to tune the hyperparameters of the Random Forest model. The RMSE for Pre and Post COVID RevPAR growth was 0.0671 and 0.0583 respectively
XGBoost
We wanted to capture the subtle patterns lost when we trimmed the dataset to the top 20 features. Thus, we pivoted to a XGBRegressor suited to handling high dimensional datasets. Using a GridSearch to tune the learning rate, number of estimators and maximum depth allowed us to further reduce for Pre and Post COVID RevPAR growth to 0.0593 and 0.0553 respectively
Ensemble
Finally, we combined the outputs of the best performing neural network, random forest, and XGBoost models and performed a ridge regression on those outputs. This allowed us to capture patterns that individual models may have missed. It was tuned via 5-fold cross validation, and we got our best RMSE of 0.0573 and 0.0542 on pre and post COVID revenue growth respectively.
Findings
Pre and Post Covid Shifts
- Tenant preferences have shifted toward "essential utility," with access to healthcare and access to food becoming dominant drivers.
- Rising importance of housing affordability also reflects increased financial insecurity after Covid.
- Increased emphasis on Market and Submarket classification of housing implies increased value placed on apartment quality
- Pre-COVID growth trajectories are not predictive of current neighborhood performance and failed to enter the top 20 most important factors in predicting Post-Covid growth.
- The rise of hybrid work models has significantly devalued traditional transport metrics like Walkability
- Tenant preferences have shifted from "lifestyle" amenities in the form of Cultural Institutions and Activity Centers. ### Insights Dominance of Short-term Growth Trends: Apartment performance is correlated with immediate neighbourhood momentum rather than historical growth trajectories. Devaluation of transit metrics: Rise of hybrid work arrangements has eroded the premium placed on transit proximity. Amenity Shift: Tenants are increasingly valuing "essential utility" amenities like Healthcare and Food rather than "lifestyle" amenities like Cultural Institutions. Economic volatility: Post-Covid economic instability has placed increased importance on housing affordability.
Challenges we ran into
One of our main challenges was managing irregular and incomplete data, including inconsistencies across property-level records and time windows. We also faced concerns around potential distributional differences between training and testing sets, particularly for drive-time, which required weighting and validation to ensure comparability. Balancing model performance with interpretability was another key challenge, especially when comparing results across Pre and Post-COVID periods.
Neighbourhood Signals AI
Introduction
We are proud to have moved beyond static analysis by animating our findings through a real-time dashboard. By coupling our predictive engine with a live interface, we’ve created a 'living' model that continuously interprets the friction between historical trends and today's volatile market reality.
Tech Stack:
Frontend: Streamlit ML Models: scikit-learn (Random Forest) AI: Google Gemini AI Database: MongoDB Atlas Python: 3.11+
What we learned
We found that rigorous preprocessing and feature engineering are essential for handling market volatility. Using ensemble methods helped stabilize our predictions, while analyzing feature importance provided a practical way to see which variables actually influenced the results.
What's next for Neighborhood Signals: Predicting RevPAR Winners
Neighbourhood Signals AI: Improvements to the intuitiveness of the UI and the deployment of our dashboard to cloud computing services like GCP and AWS are the next major steps on our roadmap. Cross-Market Validation: We want to integrate expanded datasets from Northern U.S. apartments to verify model performance across diverse regulatory and economic environments. Granular Signal Extraction: Mitigate noise from broader market by developing models for localized housing submarkets to identify local drivers.


Log in or sign up for Devpost to join the conversation.