-
-
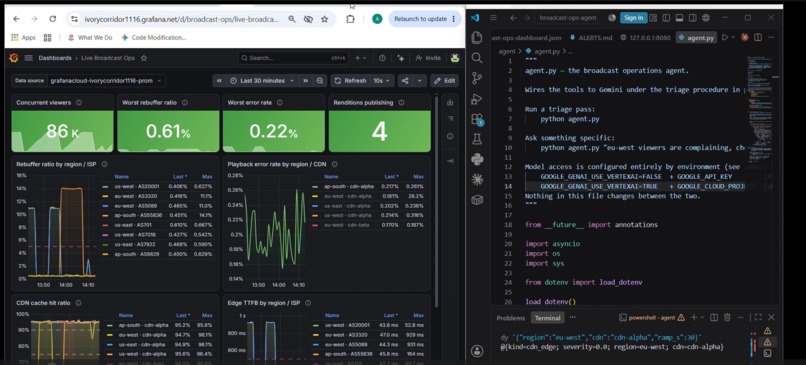
Dashboard & Terminal
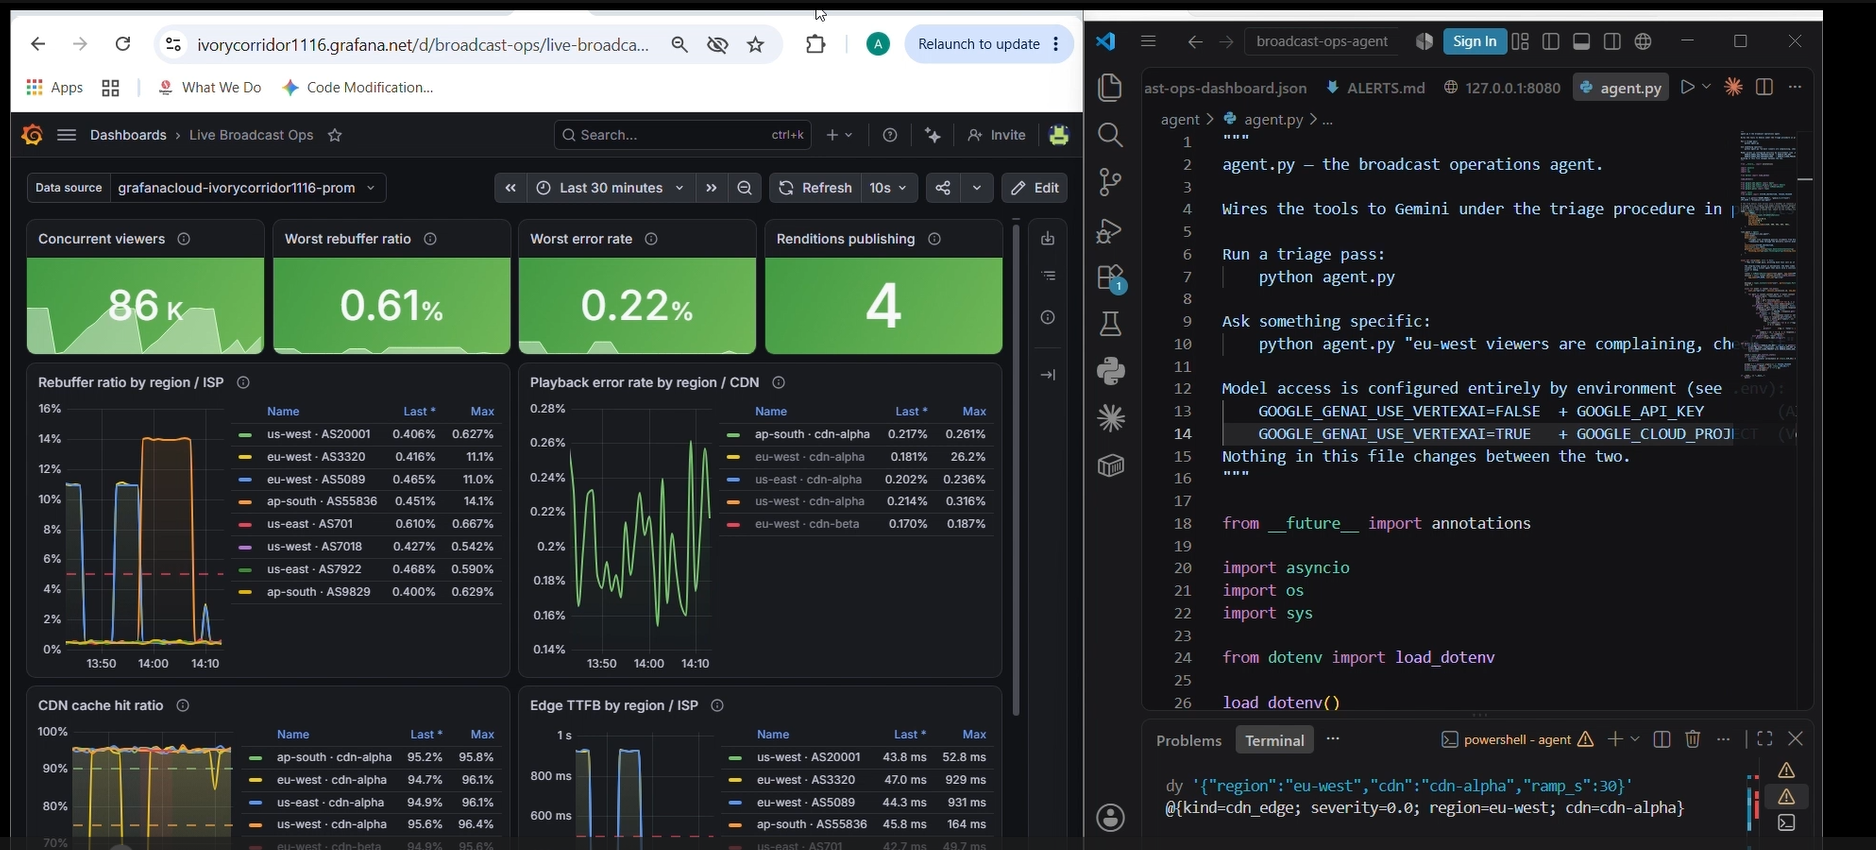
Inspiration
During a live event, "video is buffering" is the only signal a control room gets first — and it's a symptom, not a diagnosis. A CDN edge failure, a slow origin, a dead encoder rung, a congested ISP, and a traffic surge all produce it. The remediation for each is different, and applying the wrong one moves healthy traffic for nothing.
So the interesting problem in broadcast operations isn't fixing faults. It's distinguishing between faults that look identical, fast, while an audience is leaving. That's a diagnostic problem, and diagnosis is something an agent can genuinely do well — provided it reasons from evidence rather than from vibes.
What it does
The agent watches a live streaming event through Grafana. When an alert fires, it runs a deterministic triage procedure:
Reads the current delivery configuration so it never acts on stale telemetry Scopes which regions and ISPs are affected Splits availability failures from quality failures using playback error rate Runs the discriminating query for each candidate fault class Remediates through the delivery control plane — CDN failover, origin switch, or ABR ladder change Waits for telemetry to reflect the change, then verifies against real numbers Publishes an incident brief citing every query and value behind the diagnosis
It handles five fault classes, each with a distinct metric fingerprint:
Fault Rebuffer Errors Cache hit Origin TTFB Blast radius CDN edge failure up up collapses normal one region + one CDN Origin failure up up normal spikes every region Encoder degradation up flat normal normal one rendition down Last-mile ISP up flat normal normal one ASN only Capacity surge up flat normal normal all ASNs, viewers spike
It also knows when not to act. Last-mile ISP congestion cannot be fixed from the control plane, so the agent diagnoses it, states plainly that no action is possible, names the ASN, and escalates to the crew. And if a region has already been failed over, it identifies the lingering metrics as stale and declines to "fix" a problem that no longer exists rather than claiming credit for a no-op.
When it drops a rendition to stabilise playback, the incident brief reports the resulting bitrate loss. It reports bad news about its own fixes.
How we built it
Simulator — A FastAPI service modelling a live event across four regions, two CDNs, two origins, eight ISPs and a four-rung ABR ladder. It exposes five injectable fault scenarios and, critically, a control plane the agent can act on: remediation genuinely changes the simulated world, so recovery on the dashboard is real rather than staged. Deployed to Cloud Run.
Telemetry — The simulator pushes OTLP metrics directly to Grafana Cloud every 15 seconds. No collector or scrape agent, so it behaves identically on a laptop and in a container.
Observability — An 11-panel Grafana dashboard laid out in the agent's own triage order, and three alert rules. Rebuffering is deliberately grouped by ASN rather than region: a last-mile fault affects one ISP while its sibling stays clean, and grouping only by region averages that signal away entirely.
Agent — Google's Agent Development Kit with Gemini 3.6 Flash on Vertex AI, running at high thinking level for reliable multi-step tool use. Seven tools: two read-only PromQL queries against Grafana's hosted Prometheus, four control-plane actions, and a wait primitive. Tools return structured errors rather than raising, so a failure is something the model can reason about and escalate instead of a crash.
Challenges we ran into
Stale series nearly made the agent dishonest. After a CDN failover, Prometheus keeps reporting the vacated CDN's last values for about five minutes. The agent read those ghosts as a live fault, ran a failover that was a no-op, and wrote a brief claiming it had fixed something. Caught it by reading a transcript carefully rather than trusting the summary. Fixed by emitting a stream_cdn_active gauge, having the agent cross-reference routing before diagnosing, and adding an explicit rule that a no-op is not a fix.
Making each fault distinguishable was the actual design work. All five raise rebuffering. The simulator had to be built so that every fault differs from every other in at least one directly queryable signal — otherwise the triage tree can't be deterministic and the agent is just guessing convincingly.
Verification timing. The agent originally verified immediately after acting and read pre-change values, making a successful fix look like a failure. Added an explicit wait step before verification.
Telemetry taking down the service. A brief DNS failure made the OTLP exporter compute a negative retry deadline and crash the simulator. Wrapped the exporter so export failures can never stop the service. Telemetry is a nice-to-have; the simulator staying up is not.
Accomplishments that we're proud of
Two refusal cases. The last-mile ISP scenario, where no control-plane action can help — and the stale-telemetry case, where the agent checks whether the problem is still real before claiming a fix. Both were verified end to end against live Grafana data.
Every diagnosis cites the queries and values that produced it. Nothing in the incident briefs is asserted without evidence.
The whole thing is reproducible. Anyone can hit the hosted simulator, inject a fault, and watch the dashboard react.
What we learned
That an agent's usefulness is bounded by how well the problem is instrumented. The triage tree only works because the simulator emits signals that actually discriminate between faults — most of the design effort went into the metrics, not the prompt.
And that the correctness bugs worth catching don't announce themselves. The agent's stale-series failure produced a confident, well-formatted, entirely wrong incident brief. Only reading the raw transcript surfaced it.
What's next for Broadcast Ops Agent — incident triage for live streaming
Multi-fault triage — real incidents rarely arrive one at a time. Learning thresholds from historical baselines rather than fixed constants. Reading Loki logs alongside metrics for richer evidence in briefs. And a confidence score on each diagnosis, so borderline cases escalate to a human instead of being acted on.

Log in or sign up for Devpost to join the conversation.