Inspiration
https://www.loom.com/share/90e5fbcee63a45bb93435f0f20848b85
Most hackathon projects ship a demo and call it done. We asked a different question: what happens after git push?
What happens when 500 users hit your app at once? What happens when the database chokes mid-request? How does your team know something is broken at 3 AM — and what do they actually do about it?
That curiosity drove us to build not just a URL shortener, but the entire production infrastructure around it — load balancing, observability, alerting, chaos testing, and documented failure modes. The app is the easy part. Keeping it alive is the real engineering.
What We Built
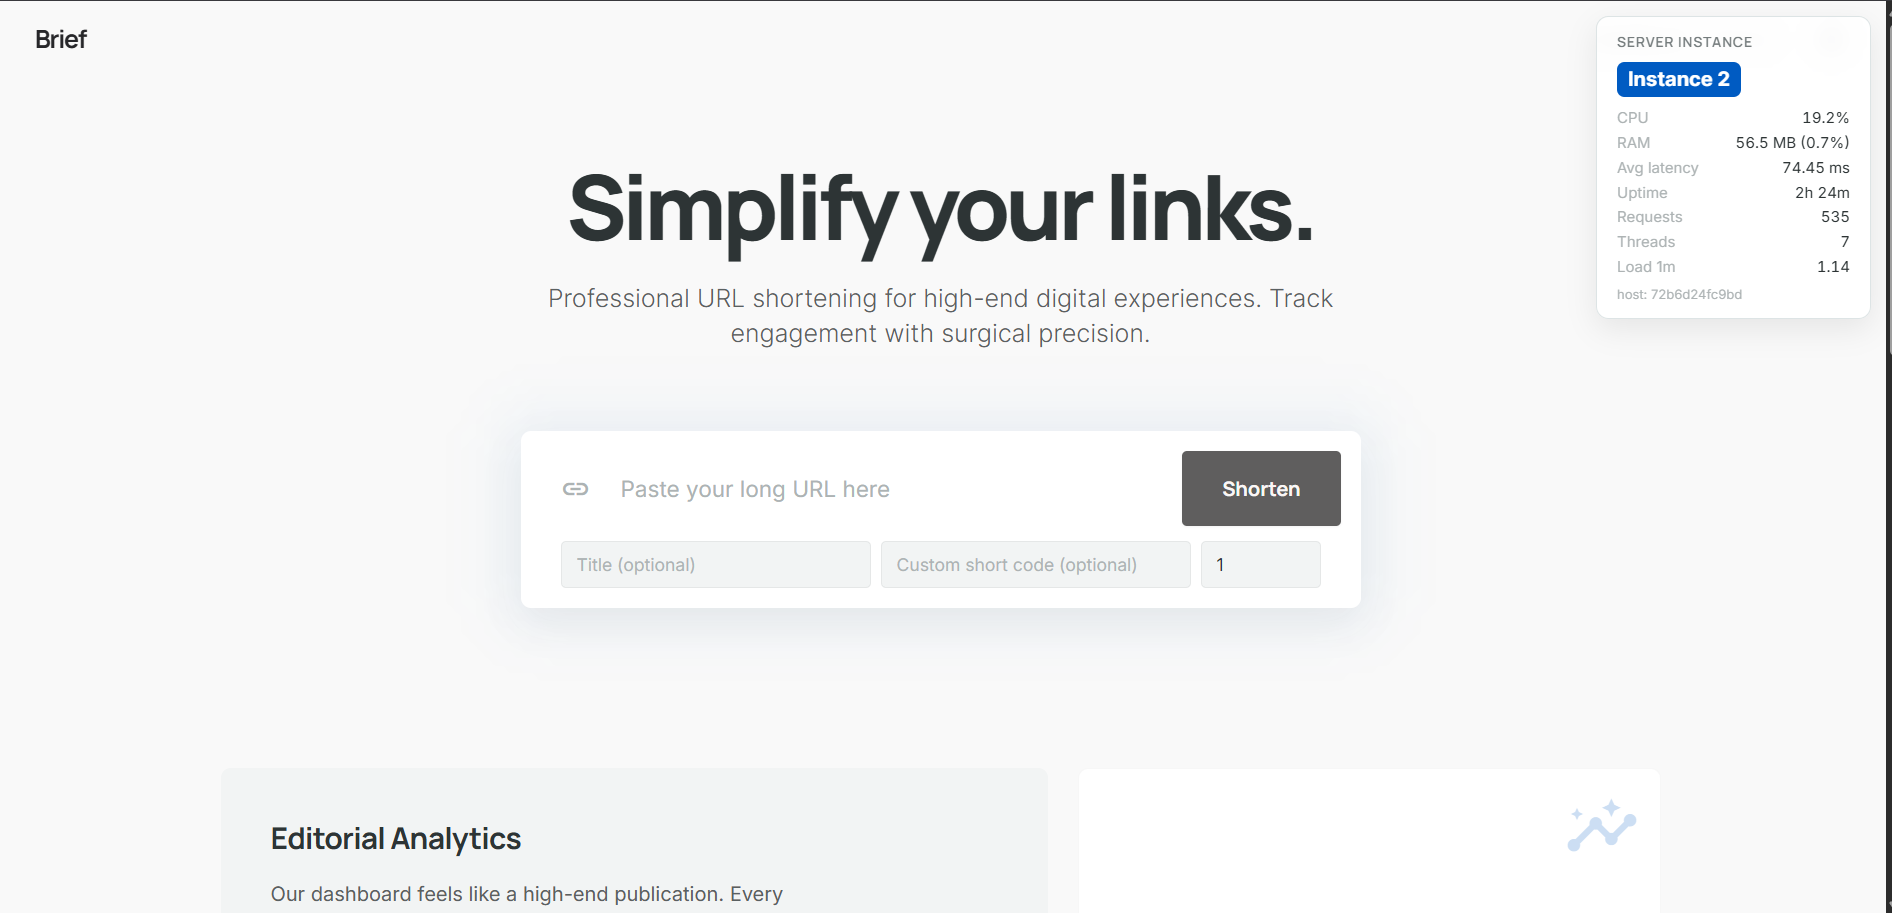
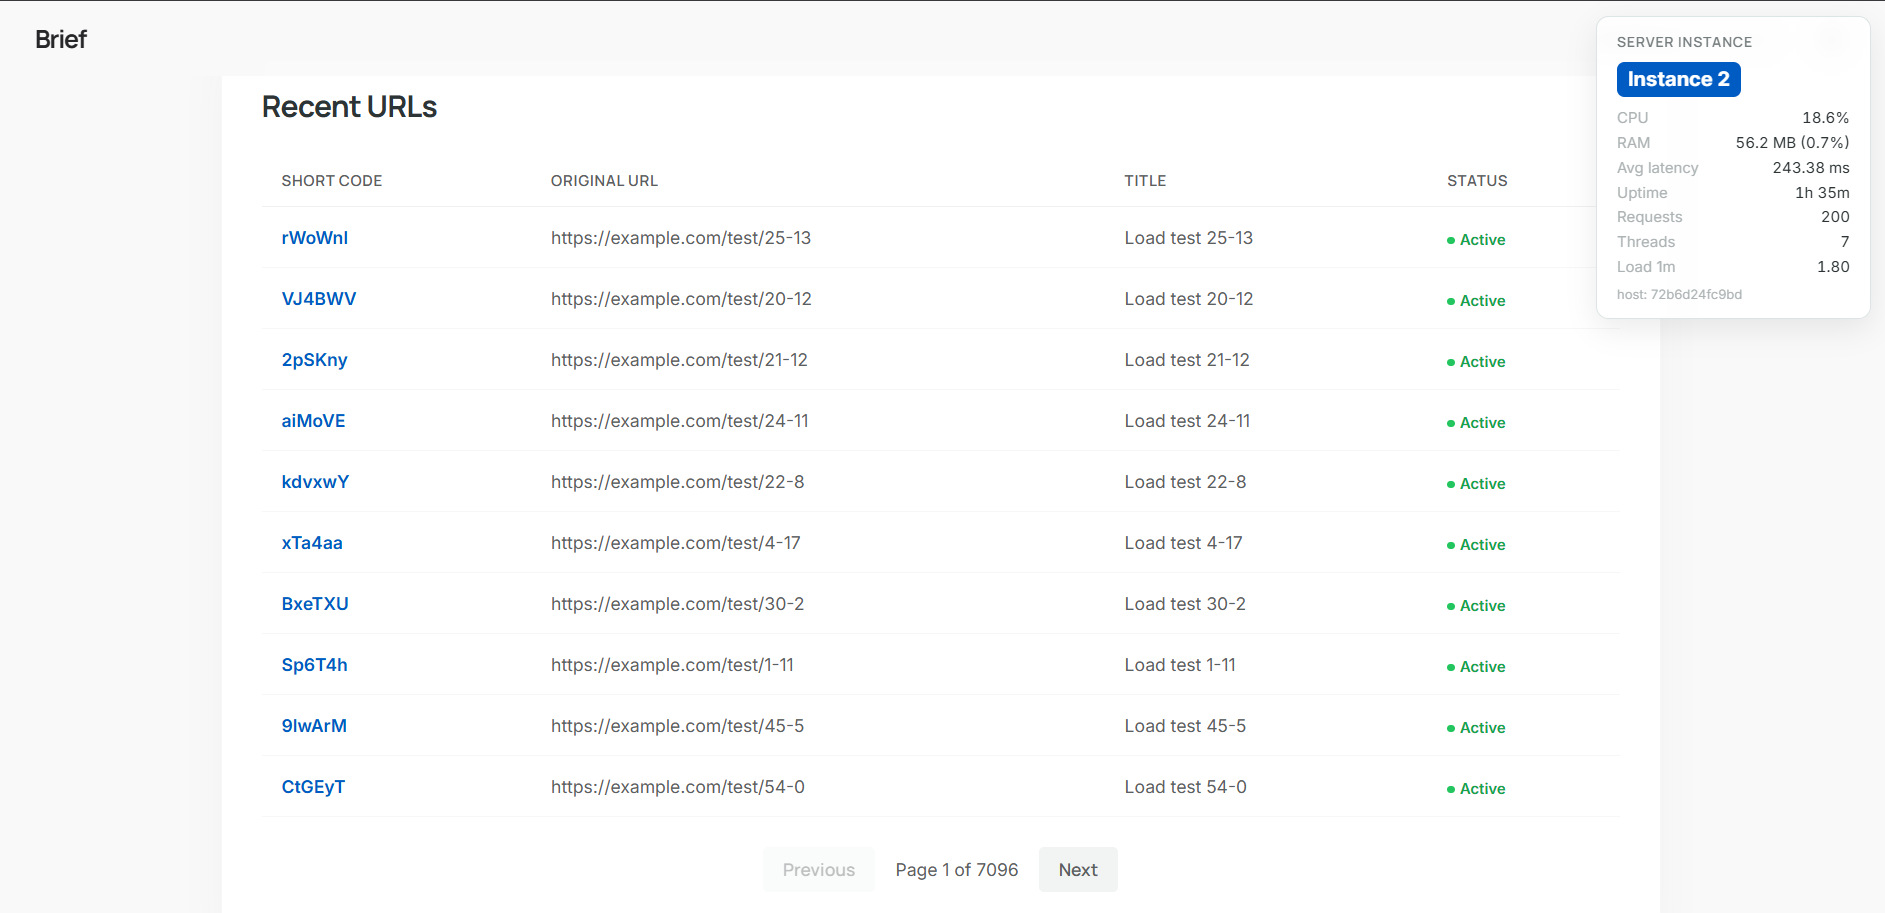
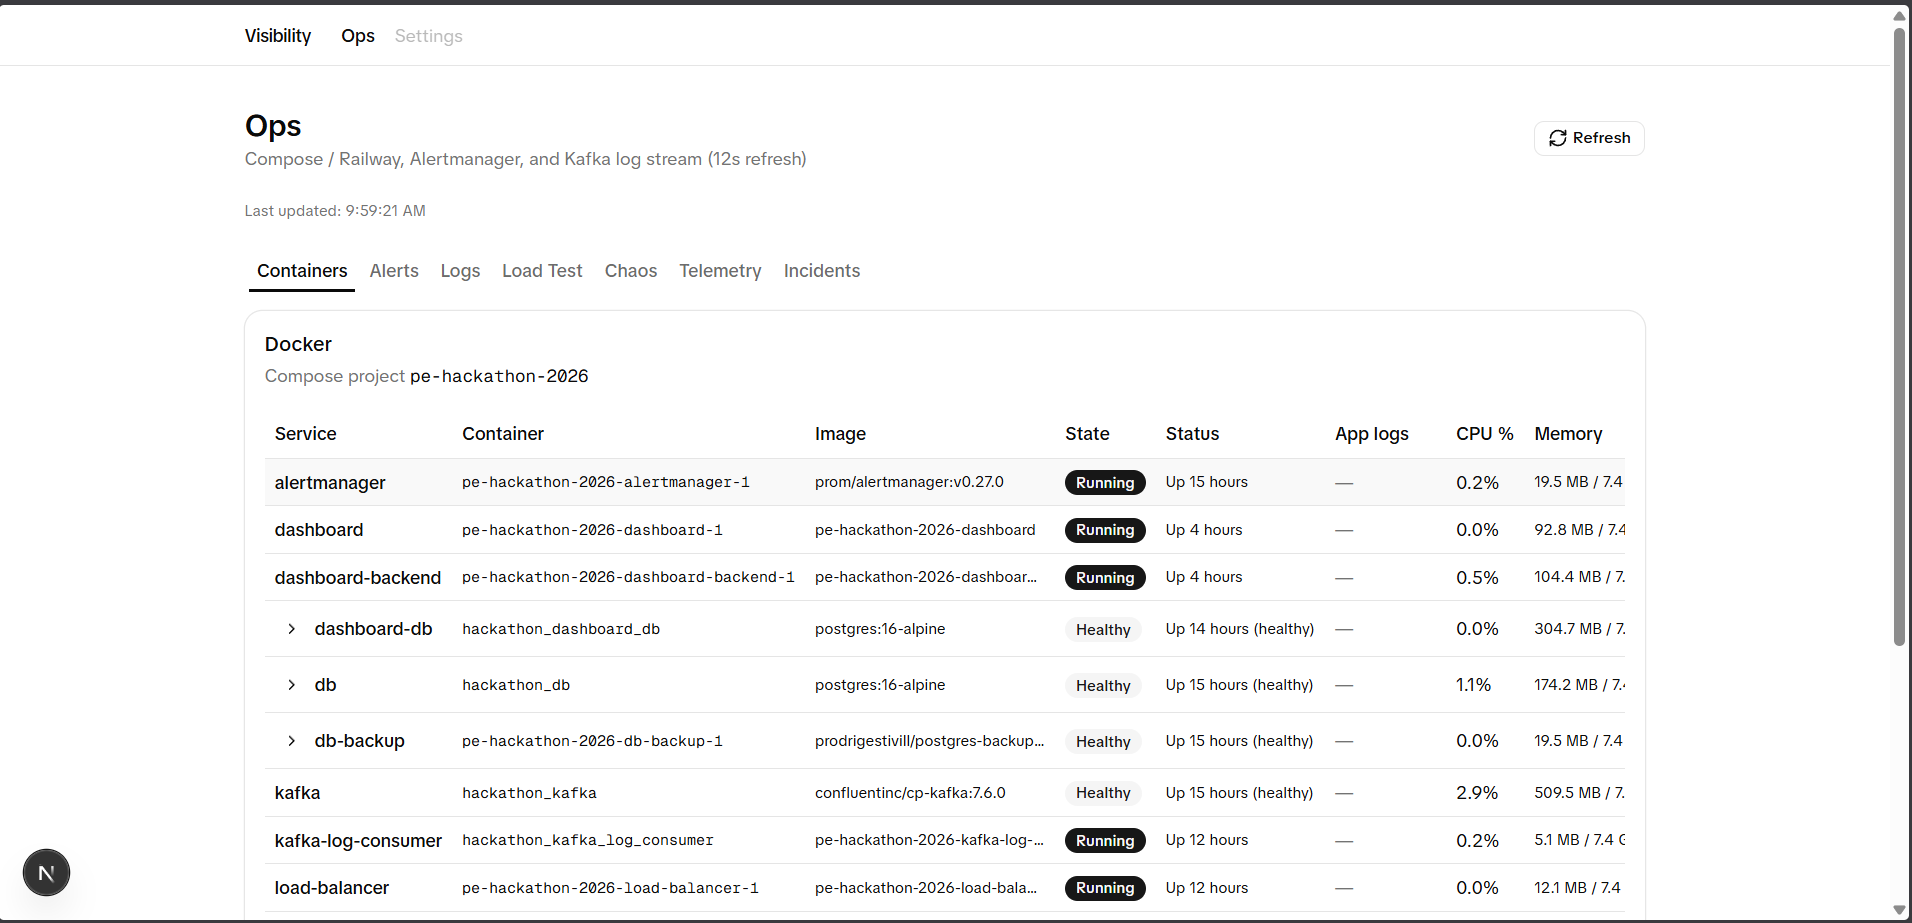
A fully instrumented, production-grade URL shortener running as a distributed system — 12+ containers orchestrated with a single docker compose up --build -d.
The Core System
- Two stateless Flask API replicas behind an NGINX load balancer using
least_connscheduling, with Redis caching and PostgreSQL persistence - Kafka event streaming pipeline — every HTTP request emits structured JSON, consumed independently by three services: log printer, dashboard backend, and Discord alerter, using isolated consumer groups
- Circuit breakers on database access with separated health semantics:
/livefor liveness/readyfor readiness/healthfor human inspection
The Observability Stack
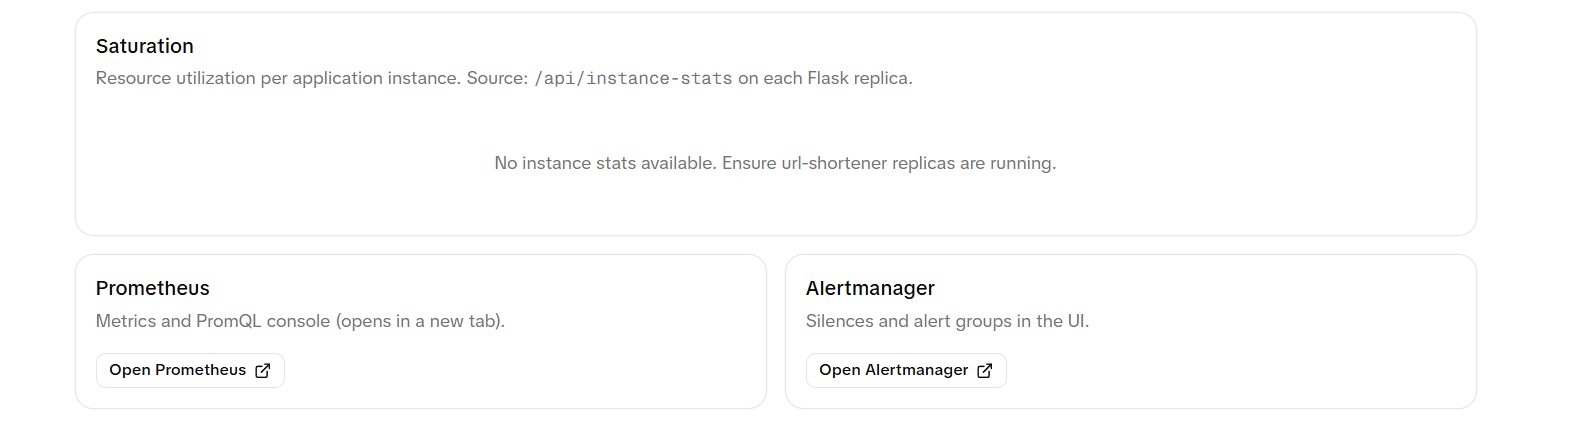
- Prometheus scraping per-replica metrics directly, not through the load balancer, so time series stay disaggregated
- Alertmanager routing SLO-style alerts
- A real-time Next.js ops dashboard with tabs for:
- live Kafka-streamed logs
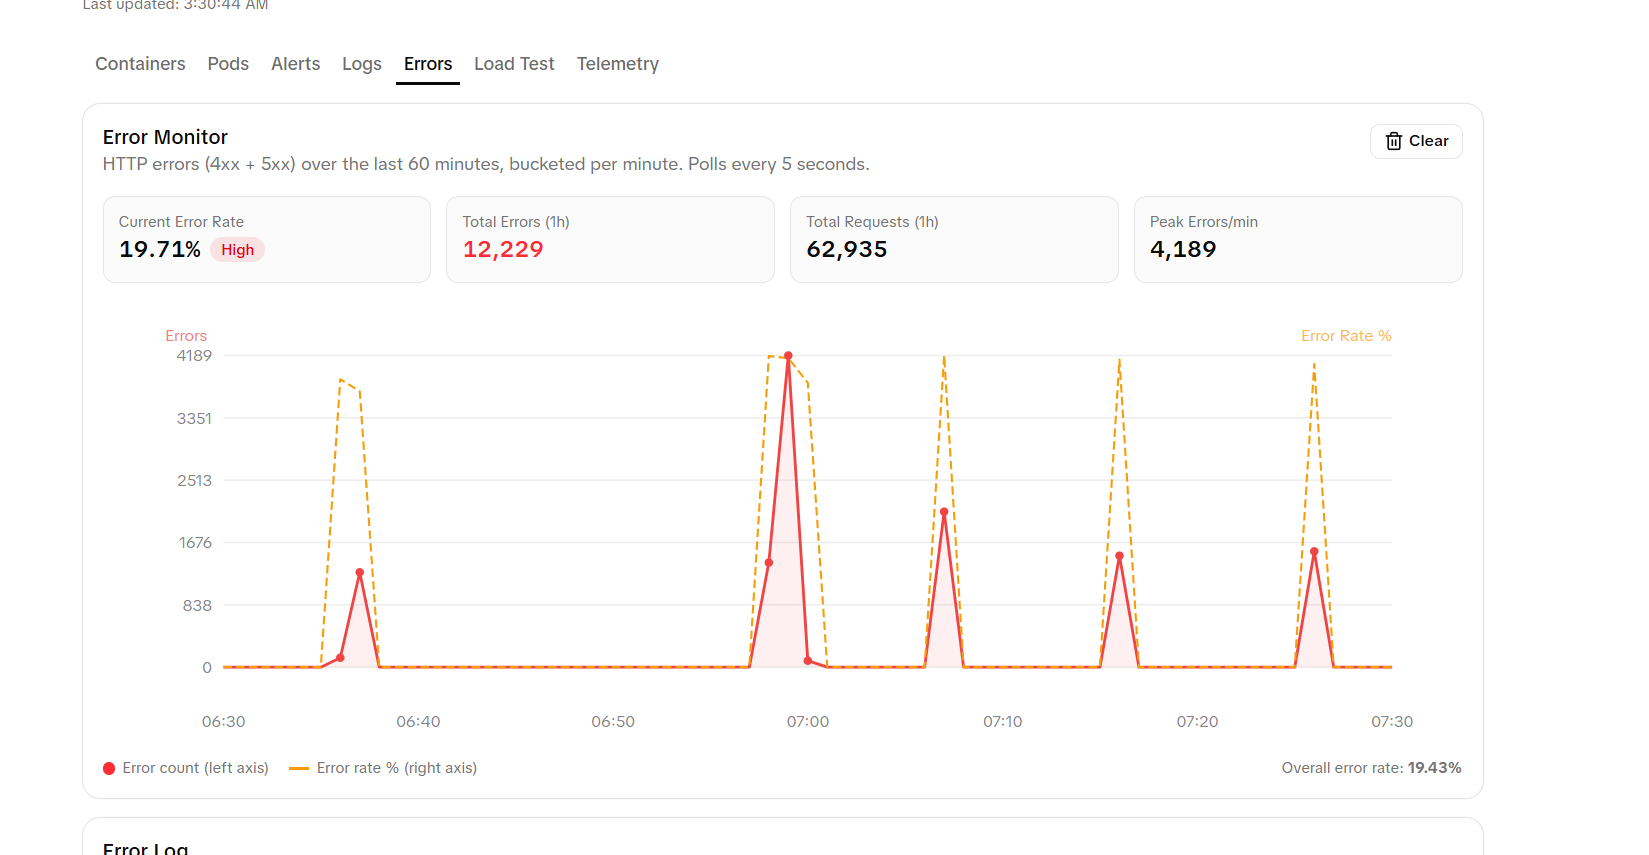
- error analytics with DB-backed bucketing
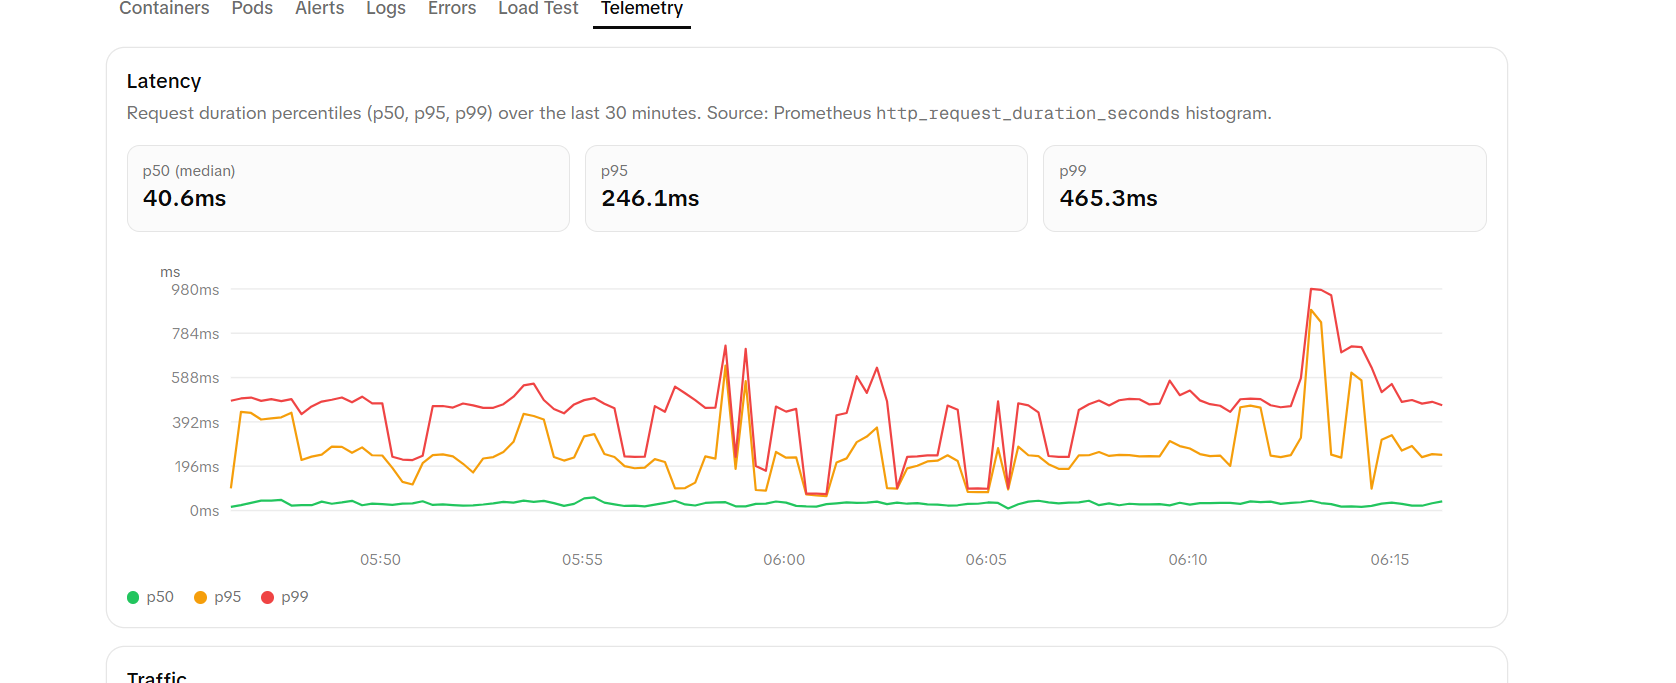
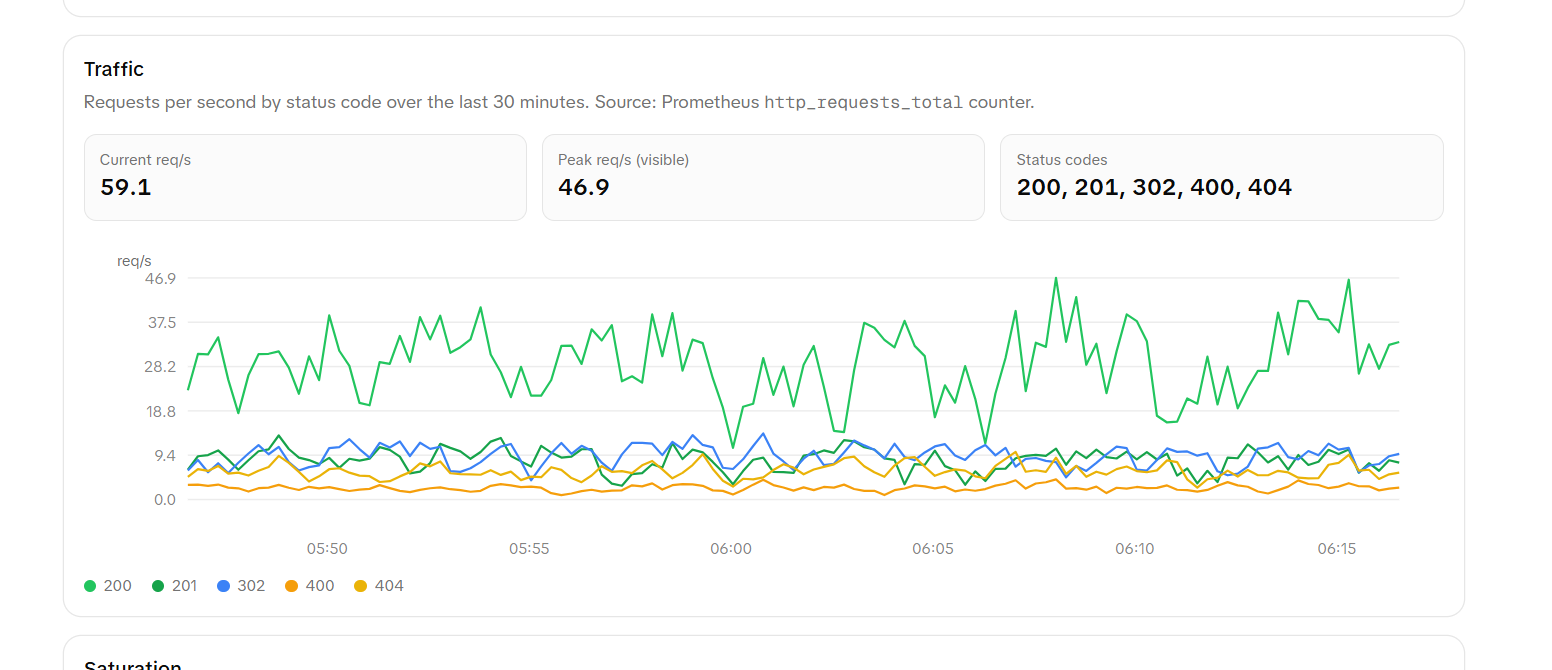
- golden signals telemetry: latency, traffic, errors, and saturation
- k6 load testing runnable from the UI
- incident timeline with persistent event tracking
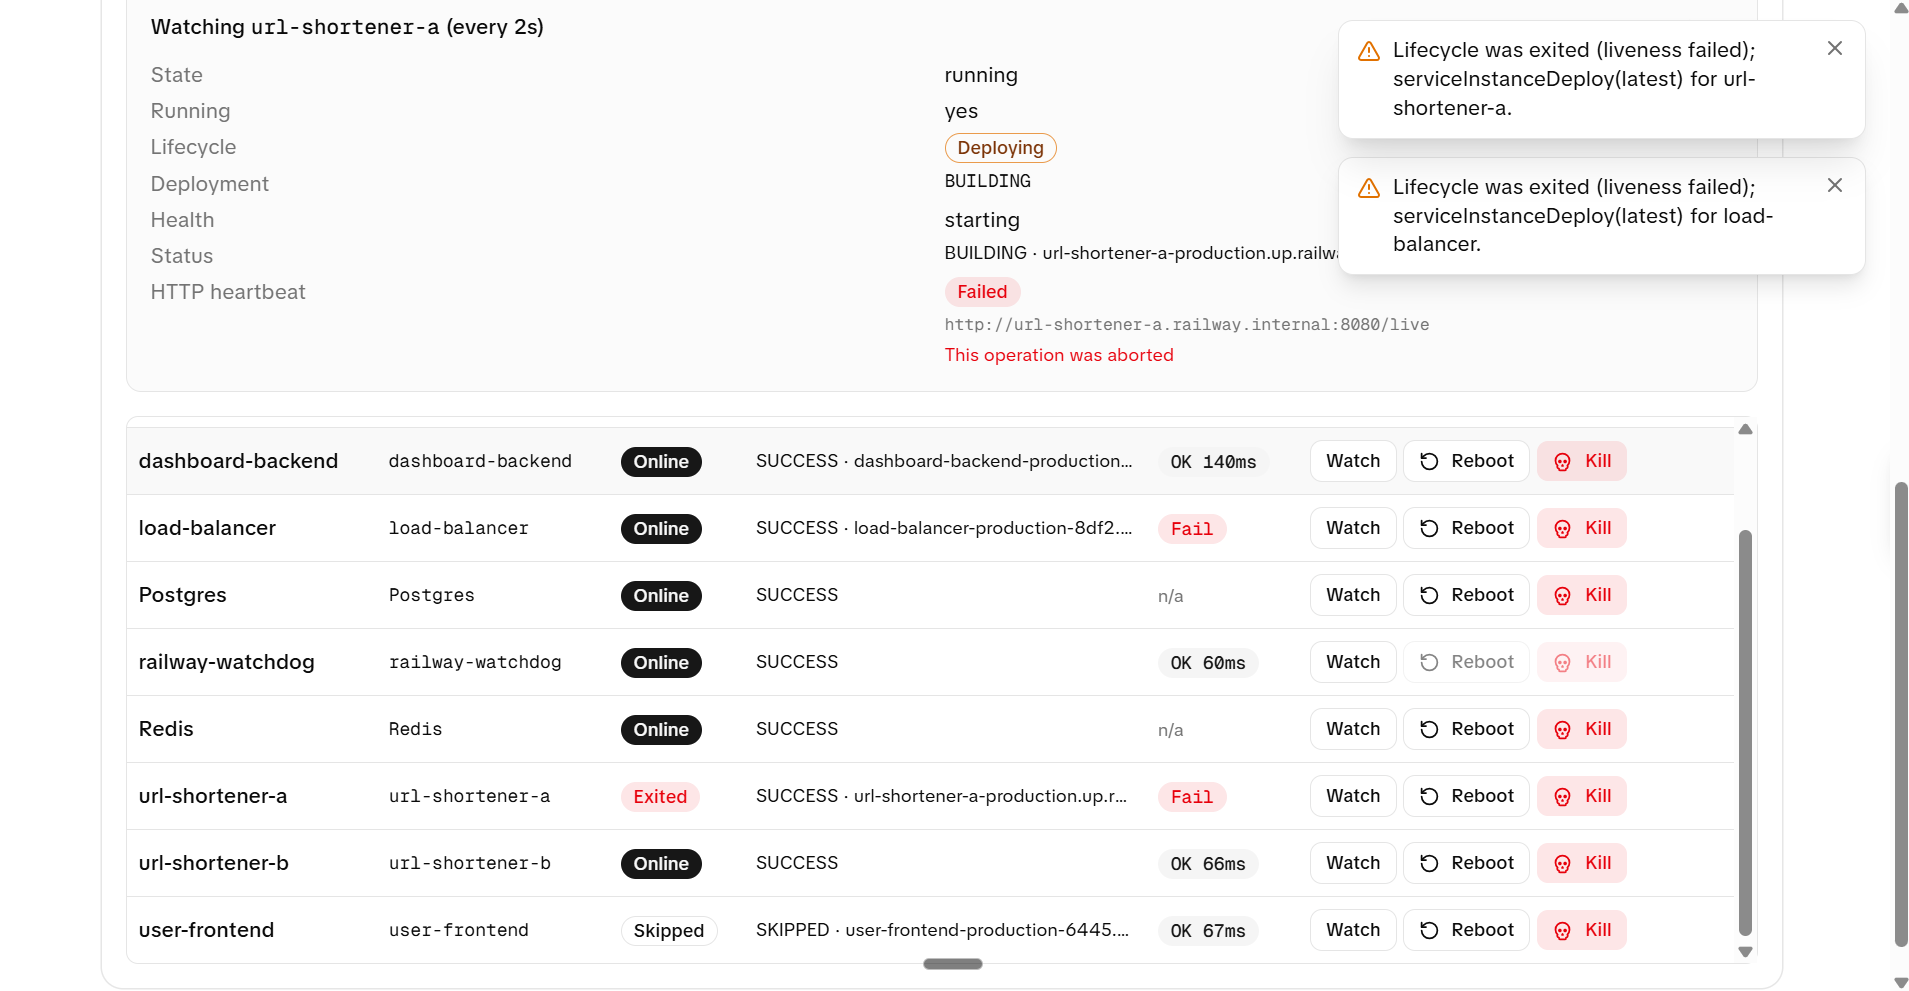
- chaos panel for killing and restarting containers live
- Dual-path Discord alerting:
- Kafka consumer for per-request alerts such as
5xx,ERROR, andCRITICAL - Alertmanager for aggregated rule-based alerts such as p99 latency, 5xx rate, and target availability
- Kafka consumer for per-request alerts such as
The Reliability Layer
- Docker restart policies plus a custom
compose-watchdogservice that polls the Docker API and auto-restarts crashed or unhealthy containers, because Docker Desktop'srestart: alwaysproved unreliable afterdocker kill - Documented failure modes for every component — we can kill any container in the stack and show exactly what happens, how the system degrades, and how it recovers
- Graceful frontend error handling with context-aware friendly messages that parse backend error strings instead of showing generic
"500 Internal Server Error"
Beyond Local
- TLS support with self-signed certs and HSTS
- HA edge configuration with a second NGINX instance
- Railway cloud deployment with private networking and environment-driven wiring
- Automated daily database backups with 7-day retention
- IP ban escalation system:
- warning
- hourly bans
- permanent ban
- Admin API for ban management
How We Built It
We started with the URL shortener as the core service, then layered production concerns on top iteratively — each layer informed by the problems the previous one revealed.
Reliability first
- health probes
- circuit breakers around DB calls
X-Request-IDtracing through NGINX and middlewarerestart: alwayspolicies
Observability
- Kafka log pipeline
- Prometheus metrics on every endpoint
- structured JSON logging
Alerting
- Prometheus alert rules for:
- 5xx rate
- p99 latency
- rate limiting
- scrape health
- Alertmanager routes to Discord
- Separate Kafka-driven alerts for per-request anomalies
- Prometheus alert rules for:
The dashboard
- FastAPI backend consuming Kafka into an in-memory ring buffer and PostgreSQL
- Next.js frontend with auto-polling
- Separate dashboard DB from app DB so observability load does not starve the product
Load testing
- k6 scripts at:
- bronze: 50 users
- silver: 200 users
- gold: 500 users
- chaos presets
- Runnable from the dashboard UI with live stats streaming
- k6 scripts at:
Documentation
- architecture diagrams
- API docs
- deploy guides
- troubleshooting notes with real bugs we hit
- technical decision log
- failure mode documentation
- runbooks
- capacity plan
Challenges We Ran Into
Kafka Consumer Group Coordination
Getting three independent consumers — log printer, dashboard backend, and Discord alerter — to each receive every message required understanding consumer group isolation. Each consumer needs its own group ID or they steal each other's offsets.
Database Connection Pool Exhaustion
Under 500 concurrent users, Peewee's connection pool saturated. We diagnosed this using our own dashboard's error analytics and golden signals, then fixed it with connection limits plus Redis caching, reducing DB load by ~60–80%.
Discord Webhook Rate Limiting
Cloudflare blocks requests without a custom User-Agent header with error 1010, and Discord's own rate limits required per-second throttling in the alerter.
Docker Desktop Restart Reliability
restart: always does not always work after docker kill on Windows and Mac, which exposed a real Docker Desktop reliability issue. We built a custom watchdog service as a reliable self-healing layer.
DB Connection Leak in Dashboard Backend
The FastAPI backend gradually consumed all Postgres connections. Functions opened connections but did not release them on exceptions. We fixed this with try/finally in all DB functions — a classic bug that only surfaces under sustained load.
What We Learned
- Observability is a product, not a feature. The dashboard, alerting pipeline, and log infrastructure took as much effort as the app itself. That is the point — production engineering is the work that happens after the feature ships.
- Alert fatigue is real. We learned to alert only when a human needs to act — SLO breaches and sustained error rates, not individual 404s.
- Load testing reveals what code review cannot. k6 at 500 VUs surfaced connection pool limits, serialization overhead, and NGINX buffering behavior that no amount of reading code would have found.
- Document your failures before they happen. Writing runbooks and failure mode docs forced us to understand our system’s behavior under every kill path — edge, replica, database, broker, and observability.
- The boring infrastructure is the hard part. Health check semantics, restart policies, cache invalidation strategies, and consumer group isolation are not glamorous, but they are what separate a demo from a system you would trust at 3 AM.
Built With
- alertmanager
- apache-kafka
- discord-webhooks
- docker
- fastapi
- flask
- grafana
- javascript
- k6
- next.js
- nginx
- peewee-orm
- peewee-orm-typescript-?-next.js
- postgresql
- prometheus
- python
- react
- redis
- typescript


Log in or sign up for Devpost to join the conversation.