
Bridge
Financial resilience infrastructure for unexpected expenses
Let's face it, life today, if you are not super wealthy, can be hard, as more than half (57%global )(and for Americans ~65%) of the workforce lives paycheck to paycheck. There needs to be a solution of some sort for those that do not have immediate cash on hand.
Bridge is a financial resilience platform that helps people navigate unexpected essential expenses through structured support, personalized recovery planning, and savings rebuilding, funded by the organizations that already serve them.
1. The Problem
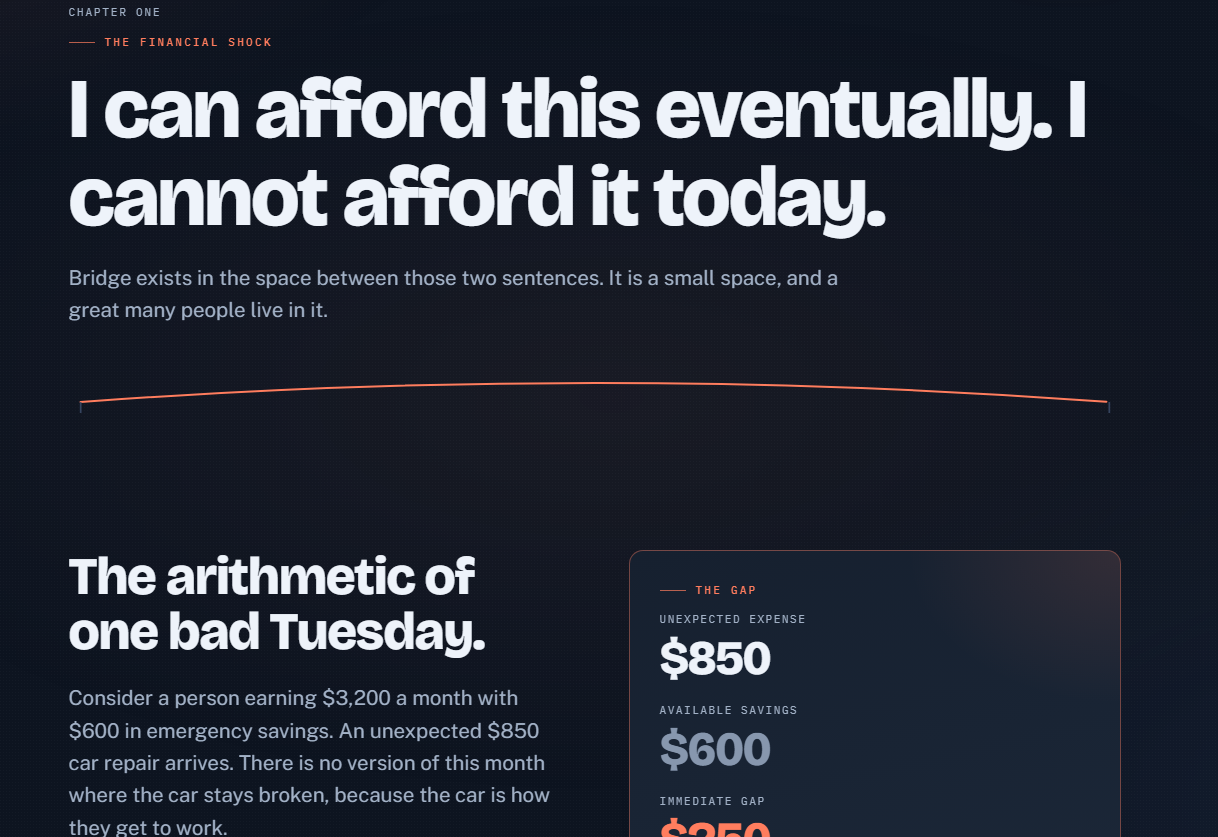
A person earns $3,200 a month, has $650 saved, and needs an $850 car repair to get to work.
Savings cover $650. A $200 gap remains, and it has to be filled today.
Here is the part that matters. The $850 is not the problem. This person can absorb $850 eventually. What they cannot do is absorb it this week without emptying a buffer that took months to build. The real question is not "can they afford it?" but "how do they recover without creating a second problem?"
Who this affects
People with income but no liquidity, which is a different situation from being bad with money. Hourly workers, salaried employees, students, families, freelancers, anyone with variable income, anyone without family to call. Income can be steady and still arrive unevenly. A person can do everything a budgeting app recommends and stay one repair away from a hard year.
37% of US adults could not cover a $400 emergency with cash or its equivalent, and 12% could not pay it at all (Federal Reserve, 2025 data). 60% of households had a financial shock in the past year, with a median cost around $2,000 (Pew, 2015).
Why it matters
A shock absorbed badly leaves a household weaker than before, so the next one lands harder:
Emergency → savings gone → missed payment → fees and high-cost credit → debt pressure → no buffer rebuilt → greater vulnerability to the next shock
The cost of an emergency is mostly the second emergency. Intervening at the moment of the shock is the only point where intervening is cheap.
Why existing options fall short
Every option solves part of the problem. None was built for this job.
| Option | The gap |
|---|---|
| Emergency savings | The ideal answer, missing at the exact moment it is needed |
| Credit cards | Turn one expense into an open-ended monthly obligation |
| Overdrafts | Median $35 fee, and 79% of fees are paid by the 9% who incur them repeatedly |
| Payday credit | Median 391% APR, borrowers indebted a median 199 days a year |
| Traditional loans | Too slow, too large. Few lenders will lend $250 for eight weeks |
| Employer assistance | Real, but fragmented and heavy to administer |
| Budgeting apps | Describe the emergency accurately, then stop |
Fee and APR figures: CFPB.
Three structural reasons they fail:
- They optimize for the wrong question. Credit asks "can this person repay?" A lender can succeed completely while its customer ends the year worse off, and nothing in the model registers that as failure.
- Nobody owns the whole journey. Relief, assessment, planning and savings are four separate industries. The person has to assemble the path themselves, at the moment they have least capacity to do so.
- The business models reward dependency. A product funded by interest from vulnerable users grows when its users stay vulnerable. That is arithmetic, not bad faith, and it pulls every such product toward keeping people in the system.
2. The Solution
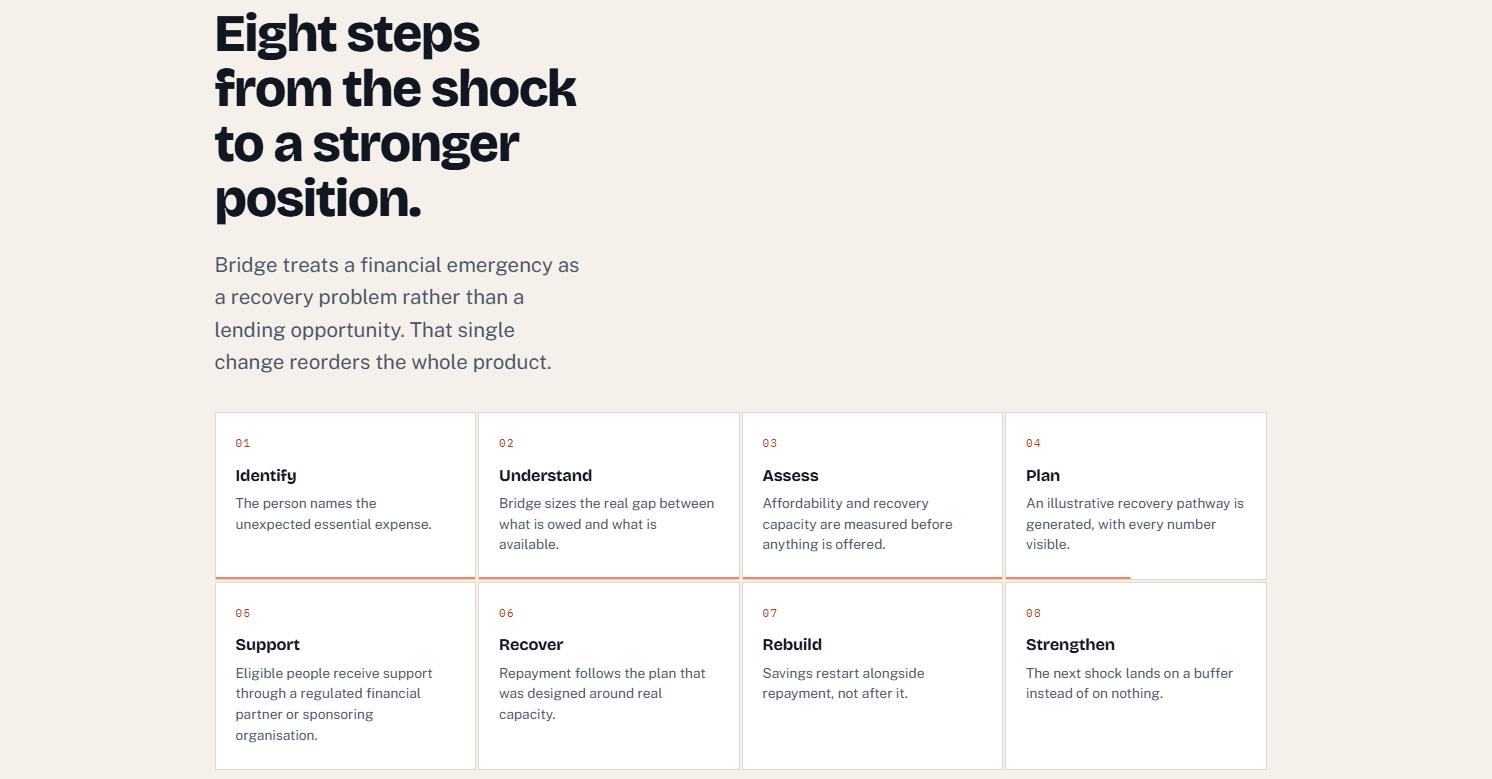
Bridge treats a financial emergency as a recovery problem rather than a lending opportunity, and reaches people through an organization they already trust: their employer, university, credit union or a community nonprofit.
The whole product comes from adding one question:
| Credit asks | Bridge adds |
|---|---|
| "Can this person repay?" | "What would help this person recover?" |
| Produces a loan, a rate, a schedule | Produces support sized to the gap, a plan sized to real capacity, a savings restart, and a way to tell whether it worked |
How it works
Identify → Understand → Assess → Plan → Support → Recover → Rebuild → Strengthen
The order is the product. Assessment happens before support. Rebuilding starts before repayment finishes.
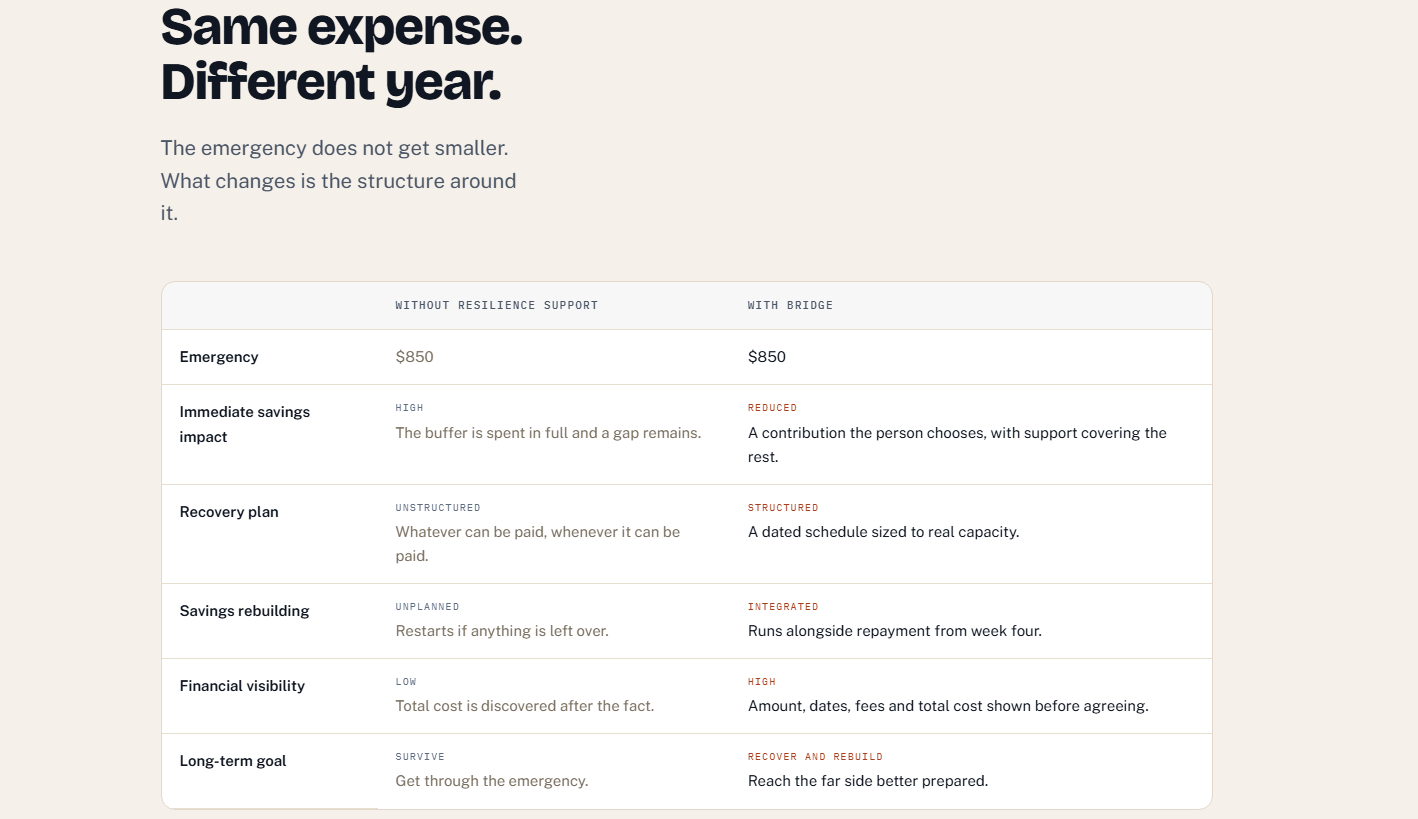
The same emergency, two years
Illustrative scenario. Maya is fictional and exists only to demonstrate the product.
| Without Bridge | With Bridge | |
|---|---|---|
| Emergency | $850 | $850 |
| Savings spent | $650 (all of it) | $100 contribution |
| Remaining gap | $200, on credit | $750 covered by support |
| Recovery | Unstructured | 12 weeks at $62.50/week |
| Savings rebuilding | If anything is left over | $10/week from week four |
| Fees | Overdraft, late fees, interest | $0 |
| Buffer after 12 weeks | Still at zero | $640, and rising |
The emergency does not shrink. The structure around it changes, and so does where the person stands twelve weeks later.
Guardrails, built in
Affordability tested first. Every number visible before agreeing. No hidden fees. No automatic refinancing. Repeated use triggers human review, never a bigger limit. And a Resilience Profile that reads six dimensions of exposure, clearly framed as a planning tool: it is not a credit score and does not represent a lending decision.
3. What Makes It Different
The components are ordinary. The combination, the sequence, and the incentives are not.
A business model that cannot profit from dependency. Three pools of money stay structurally separate: participant money, program capital, and Bridge revenue. Bridge is paid only from institutional contracts, never from interest on an emergency. That separation is why the product can honestly be optimized for people needing it less over time. A model funded by interest cannot make that claim.
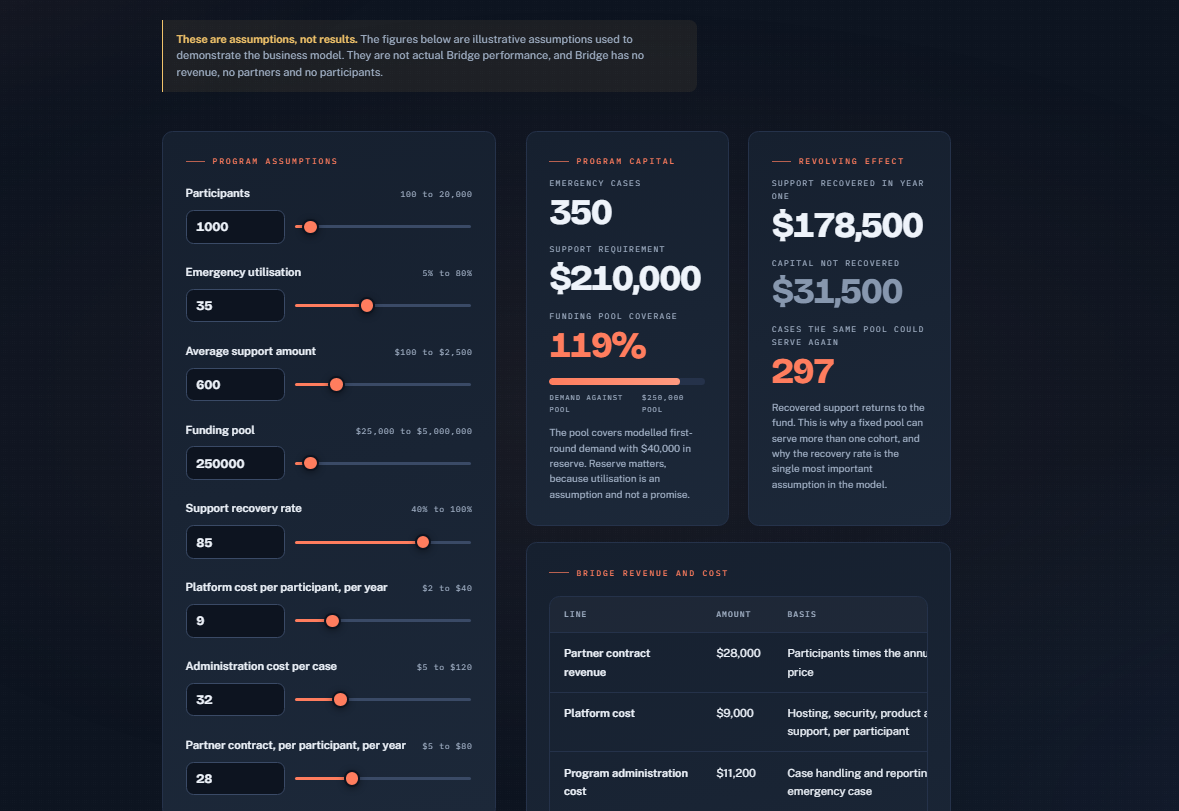
A revolving fund, not a grant pool. Recovered support returns to the fund and serves the next person. In the illustrative pilot, a $250,000 fund covering $210,000 of demand at an 85% recovery rate returns $178,500, enough for roughly 297 more cases with no new sponsorship.
Measurement that can catch its own failure. Six outcome indicators, and one of them is repeat dependence, watched as a warning rather than growth. A product like this can fail by succeeding commercially. Naming that metric up front is a structural commitment against it.
Distribution through existing trust. Bridge does not acquire users; it deploys through organizations that already serve them. This fixes discovery at the moment of need, borrows established trust for a sensitive conversation, and adds a fraud check a cold signup cannot. It matters: 65% of students report not knowing what support is available to them (Hope Center, 2023-24).
A prototype that argues against itself. When savings comfortably cover the expense, the simulator says no support is needed. When the numbers do not fit an affordable plan, it routes to review or referral, not a larger amount. A sales tool would not do that.
4. What's Included
A twelve-page interactive website that is both the presentation and a working prototype. Plain HTML, CSS and JavaScript. No framework, 596 KB, works without JavaScript.
| Material | Where |
|---|---|
| Interactive financial model | Shock Simulator: four inputs, live gap sizing, 18-month trajectory, full recovery plan |
| Product design and mockups | Participant dashboard and partner dashboard, both interactive |
| Business model | Full Business Model Canvas, five revenue streams, three-pool structure |
| Financial model | Eight-input institutional program model with sustainability verdict |
| Market research | Twelve statistics, each with source, year and link |
| Process diagrams | Journey map, fund flow, impact framework, recovery timeline |
| Concept presentation | Twelve-slide deck, plus a guided 90-second Judge Mode on every page |
| Strategy and design docs | Roadmap, risk register, compliance and privacy, full design package |
5. Making It Real
Users. Participants arrive on a bad day, usually on a phone. Sponsoring organizations want a measurable program instead of an ad hoc hardship process. A regulated financial partner carries the licenses; Bridge would never hold or move money on its own account.
Implementation. Four phases, twelve months to a go or no-go decision:
| Phase | Timing | Focus |
|---|---|---|
| Research | 0 to 3 months | Users, behavior, partners, regulation by jurisdiction, risk |
| Pilot | 3 to 6 months | One employer, one university, one nonprofit. Small and closely watched |
| Optimization | 6 to 12 months | Fix what the pilot exposed |
| Expansion | 12 months+ | Scale only where the outcome measures held |
Phase two decides everything. A pilot with good repayment and poor savings rebuilding would mean Bridge had built a small loan with extra steps. Better to learn that in month six.
Resources. A regulated financial partner, jurisdiction-specific compliance review, security and fraud controls, human support for complex cases, a measurement framework in place before day one, and sponsor-funded program capital ($250,000 for 1,000 participants in the illustrative model).
Main risks, and answers.
| Risk | Mitigation |
|---|---|
| Over-borrowing | Emergency-use limits; repeat use triggers review and human contact, not a larger limit |
| Regulatory complexity | Regulated partners, legal review per jurisdiction, deliberately narrow first pilot |
| Insufficient funding | Diversified sponsors, published limits, capital that revolves |
| Inability to repay | Affordability tested before support; hardship pathways; referral where the numbers do not work |
| Low adoption | Surfaced at the moment of need inside an existing relationship |
Honest conditions. Organizations must fund a pool whose best outcome is people no longer needing it. Repayment must hold without pressure tactics. Regulators must be satisfied this is meaningfully different from small-dollar credit with better branding. The Resilience Profile must survive contact with research. None of these is settled.
Expected outcomes. Illustrative pilot targets, not results. 1,000 participants, 350 emergency cases, 85% recovery completion, 72% savings rebuilding, 15% repeat support (lower is better). Targets are set so that failure is visible: 40% recovery would mean the design is wrong, not that the metric needs rewording.
In One Line
The measure is not "money was distributed." It is "the person recovered."
Don't just help people survive the emergency. Help them become stronger after it.
Bridge · Emergency → Recovery → Resilience
With this overview, it would be best to see the visual representation by going to the website: https://bridgefinance.rf.gd/
Built With
- aria
- css-animations
- css-custom-properties
- css-grid
- css3
- data-visualization
- flexbox
- html5
- intersection-observer
- javascript
- matchmedia
- node.js
- prefers-reduced-motion
- progressive-enhancement
- requestanimationframe
- responsive-design
- scroll-driven-animation
- semantic-html
- static-site
- svg
- vanilla-javascript
- wcag
- web-accessibility

Log in or sign up for Devpost to join the conversation.