-
-
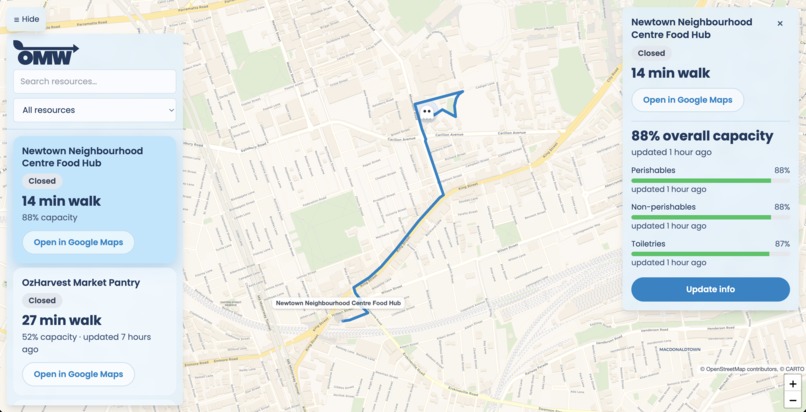
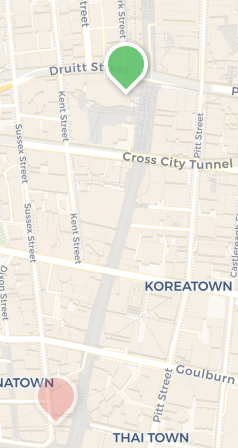
Sidebar sorted by walking distance, a real foot route to the selected pantry, and per-category stock with its own last-updated time.
-
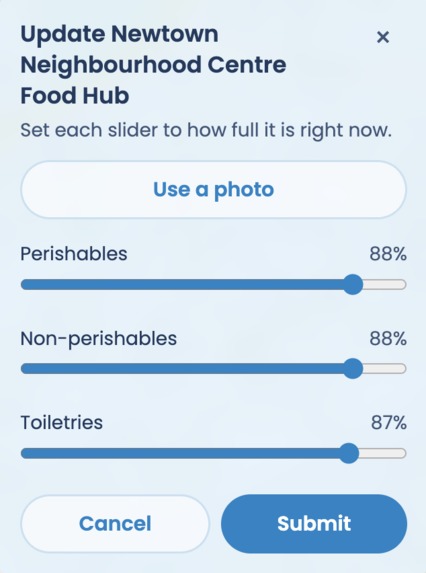
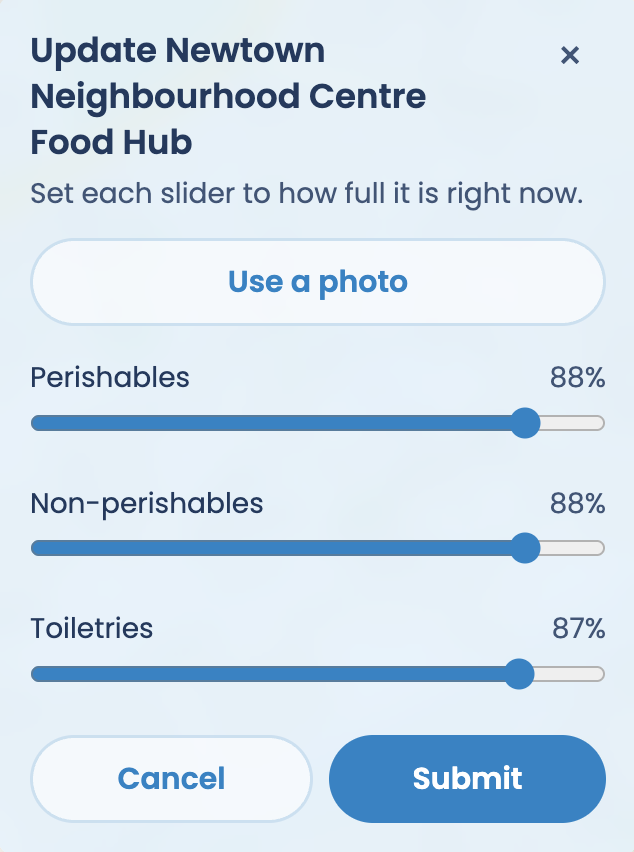
Three sliders, or photograph the shelves to pre-fill them. The human always confirms before anything is submitted.
-
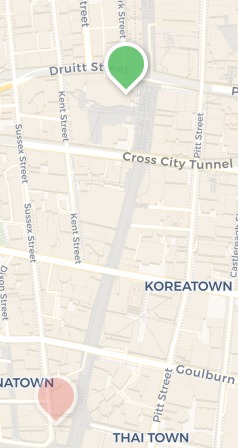
Colour is status, opacity is confidence. Fresh reports render solid, ageing ones fade.
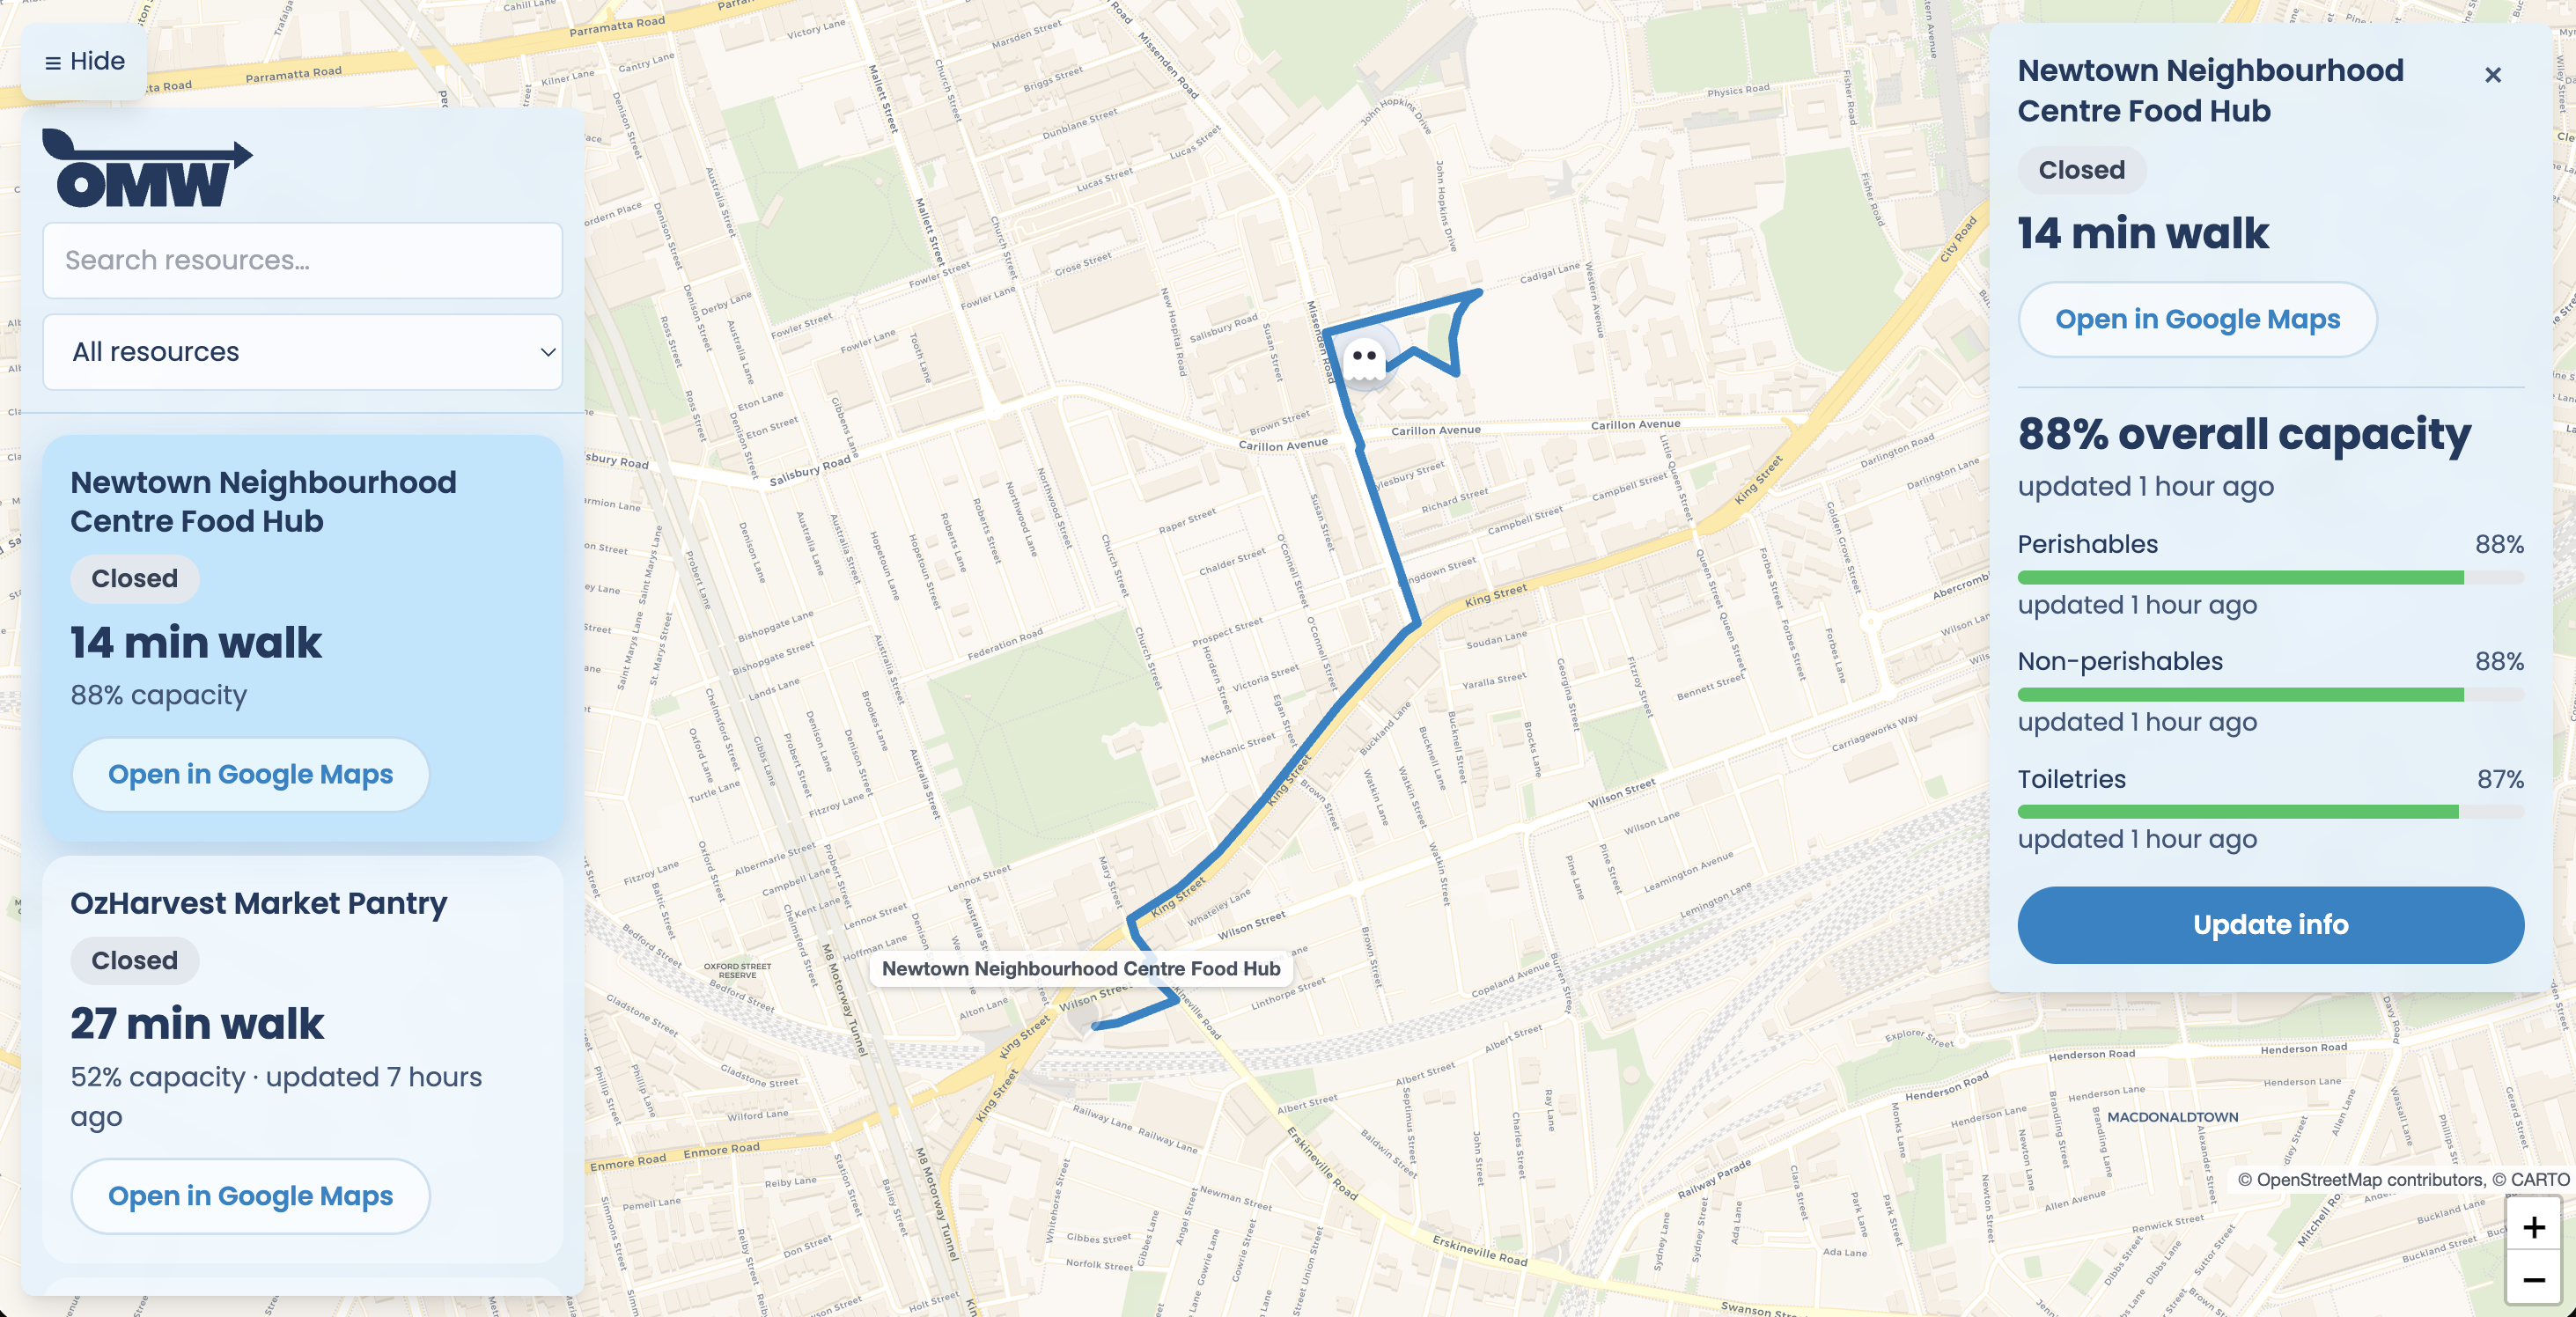

On my way
Developed for the 2026 SYNCS Hackathon by Gordon Jiang, Ian Wang, Jacob Fong, Kevin Liu, and Mungo Cullen.
Inspiration
If you need a food bank in Sydney today, what you can find is a directory. Directories are useful but they only tell you where pantries are and when they're open. It does not tell you whether there is anything left on the shelves when you get there.
If you have a car and a free afternoon, an empty pantry is an minor inconvenience. If you do not, it is a two hour round trip and a fare you could not really spare, for nothing. Opening hours are not the same thing as availability, and the people who most need that difference are the ones least able to absorb the cost of getting it wrong.
The theme was blocks that make up the world. The blocks holding a city together at the bottom are not the buildings, they are the people quietly keeping each other fed. OMW is an attempt to let those people see each other's work in real time, helping communities share underutilised resources more efficiently.
What it does
OMW is a live map of community food resources in Sydney. Crowdsourced with assistance from computer vision, and aware of how old and accurate its own information is.
- Every nearby food bank, shelter and free wifi point on a full-viewport map.
- A sidebar sorted by walking distance, showing whether each place is open right now, how full it is, how long ago someone actually checked, and how long it takes to walk there.
- Real walking routes drawn on the map, achieved with the openrouteservice api.
- A detail panel breaking stock into categories and displaying their estimated levels and last updated times.
- Visual signs to convey how confident are program is with data - if there has been no reports in a while, we inform the user rather than giving them potentially inaccurate data thanks to our confidence algorithm.
- A ten second update flow. A user only has to upload a photo, and the data input sliders are pre-filled with an opportunity to modify before submitted.
- Computer vision using a custom-trained model to assist in pre-filling sliders and automatically identifing which items are the most in stock, saving users time.
Technical achievements
Computer vision
- To solve the issue of it being time-consuming for users to enter data for crowdsourcing, we only require them to upload a singular photo which is analysed quickly and efficiently.
- When the photo is uploaded, we process it using a custom vision model trained on SKU-110K which excels at identifying stock to detect bounding boxes and crop images of each individual product
- Then, we pass these images into the Gemini 3.5 Flash lite API to instantly estimate stock levels of different product categories and extract featured items in a single JSON payload, before displaying this in the GUI.
- This is a relatively lightweight pipline, making use of computer vision and a lightweight multimodal LLM.

Confidence algorithm
Contained in confidence.py. Every report decays exponentially, with a half-life set per resource type: around two hours for pantry stock, one hour for shelter beds, and seven days for free wifi, because wifi does not run out.
Confidence in a report of age \( \Delta t \) is:
$$c(\Delta t) = 2^{-\Delta t / t_{1/2}}$$
Marker opacity on the map is driven directly by \( c \), so the map visibly forgets. Below \( c = 0.2 \) we stop claiming to know and the marker drops to grey with the status reading unknown. A resource nobody has reported on sits at confidence zero and renders faded, which means you can see what the app does not know without opening anything.
New reports are not written over the old ones. They are blended with the existing estimate, weighted by how much confidence that estimate still has:
$$v_{\text{new}} = \frac{c_{\text{old}} \cdot v_{\text{old}} + v_{\text{report}}}{c_{\text{old}} + 1}$$
The behaviour falls straight out of the algebra. As \( c_{\text{old}} \to 0 \), a fresh report simply wins. At \( c_{\text{old}} = 1 \), two equally trusted values meet exactly halfway. A single stale outlier can never yank the number around. That module has 33 passing unit tests.
Challenges faced and accomplishments that we're proud of
- Training the computer vision model took a large chunk of time after several attempts with local and cloud computing but we powered through with a (thankfully) functional and accurate model
- Staying within free-tier API key limits!
Deciding what not to build
We had a crowdsourced crime and danger overlay planned, and we cut it. Two reasons. It contradicts the product, because food banks cluster in exactly the suburbs such an overlay would shade red, and we would have been telling people the help they need sits somewhere frightening. And recorded-crime data does not measure danger. It measures reporting rates and who gets policed. We replaced it with objective attributes people can verify for themselves: free wifi, bathroom access, opening hours.


Log in or sign up for Devpost to join the conversation.