-
-

Responsive mobile planning experience
-
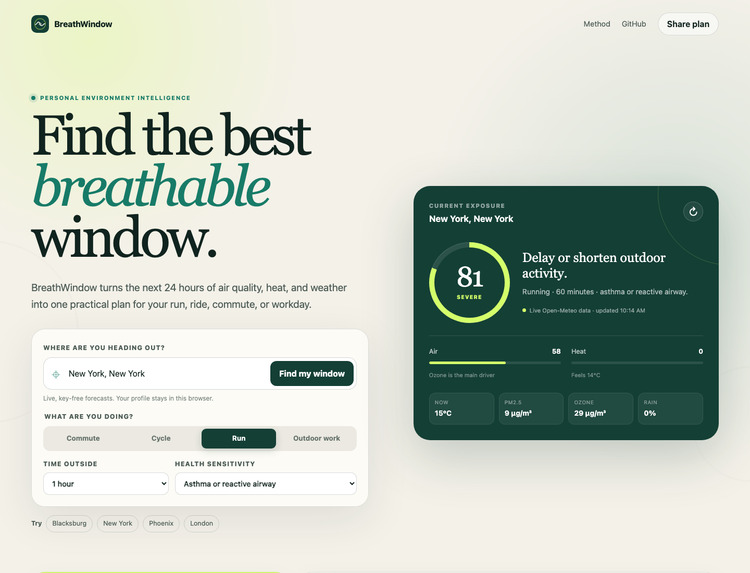
Personal exposure score, live conditions, and activity profile
-
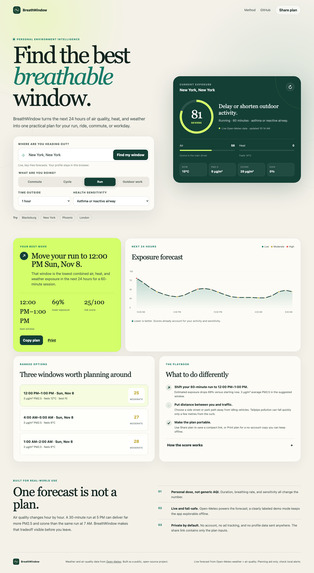
Ranked outdoor windows and actionable exposure playbook

The problem
Most air-quality apps answer a city-level question: How is the air today? People need a personal, time-specific answer: When can I safely take this 30-minute run, walk, or work session outside?
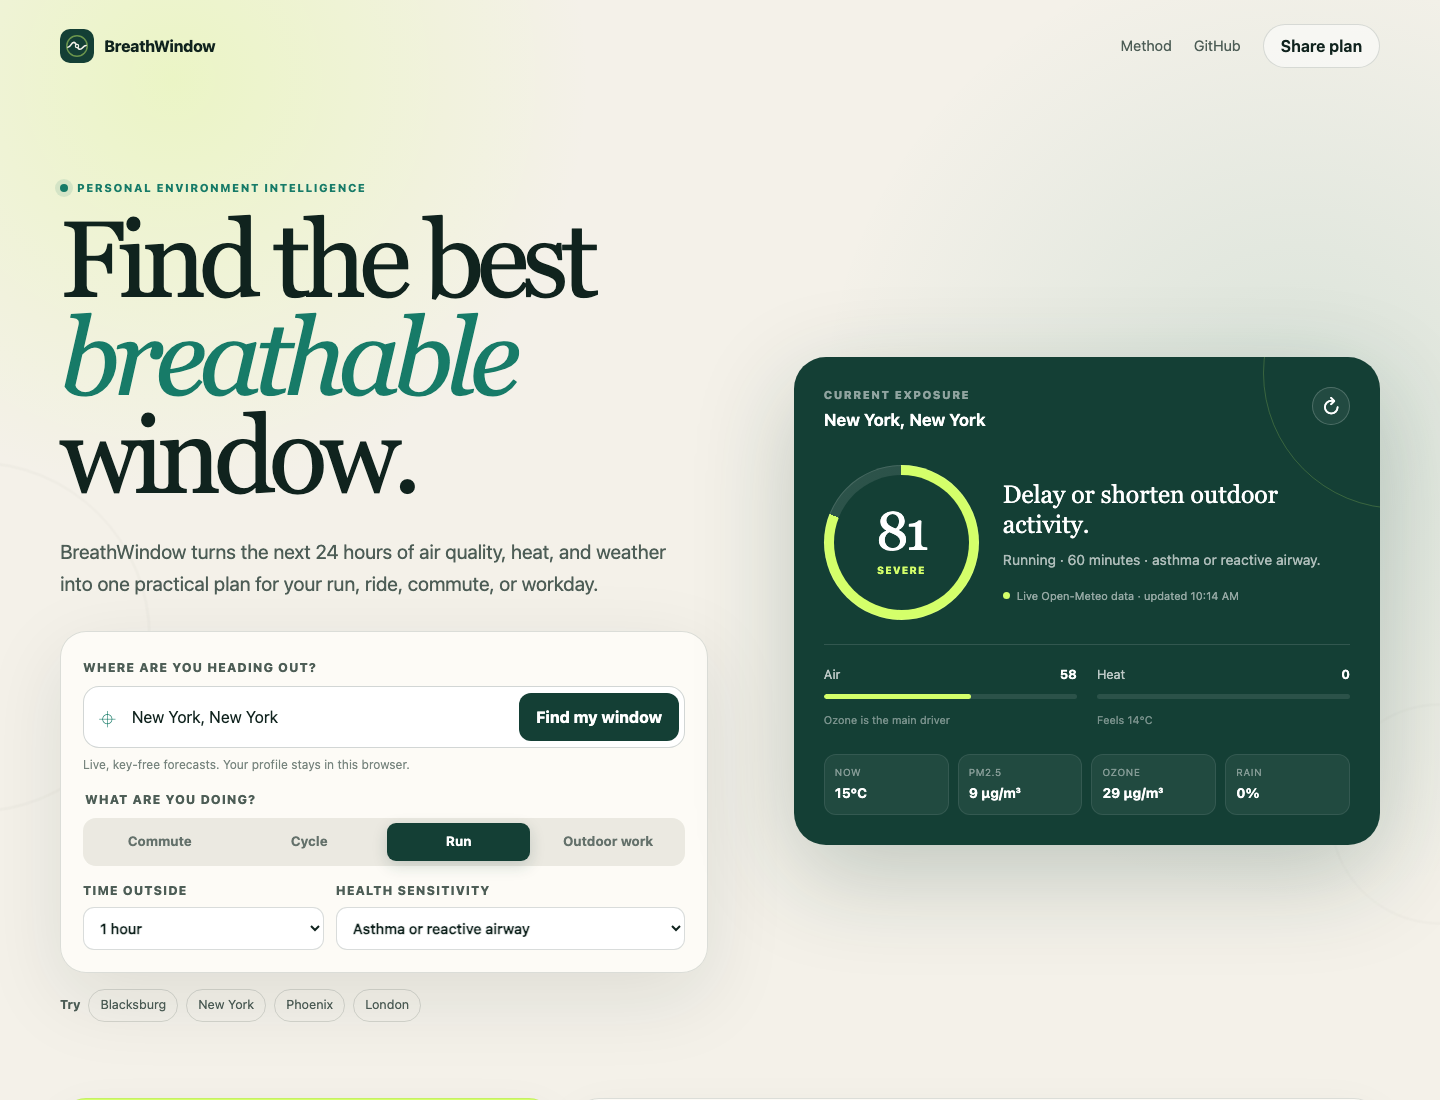
Air quality, ozone, heat, and weather change hour by hour. Exposure also changes with how hard a person is breathing, how long they stay out, and their health sensitivity. BreathWindow combines those factors into one practical 24-hour plan.
What it does
BreathWindow accepts a city, activity, duration, and optional health sensitivity, then:
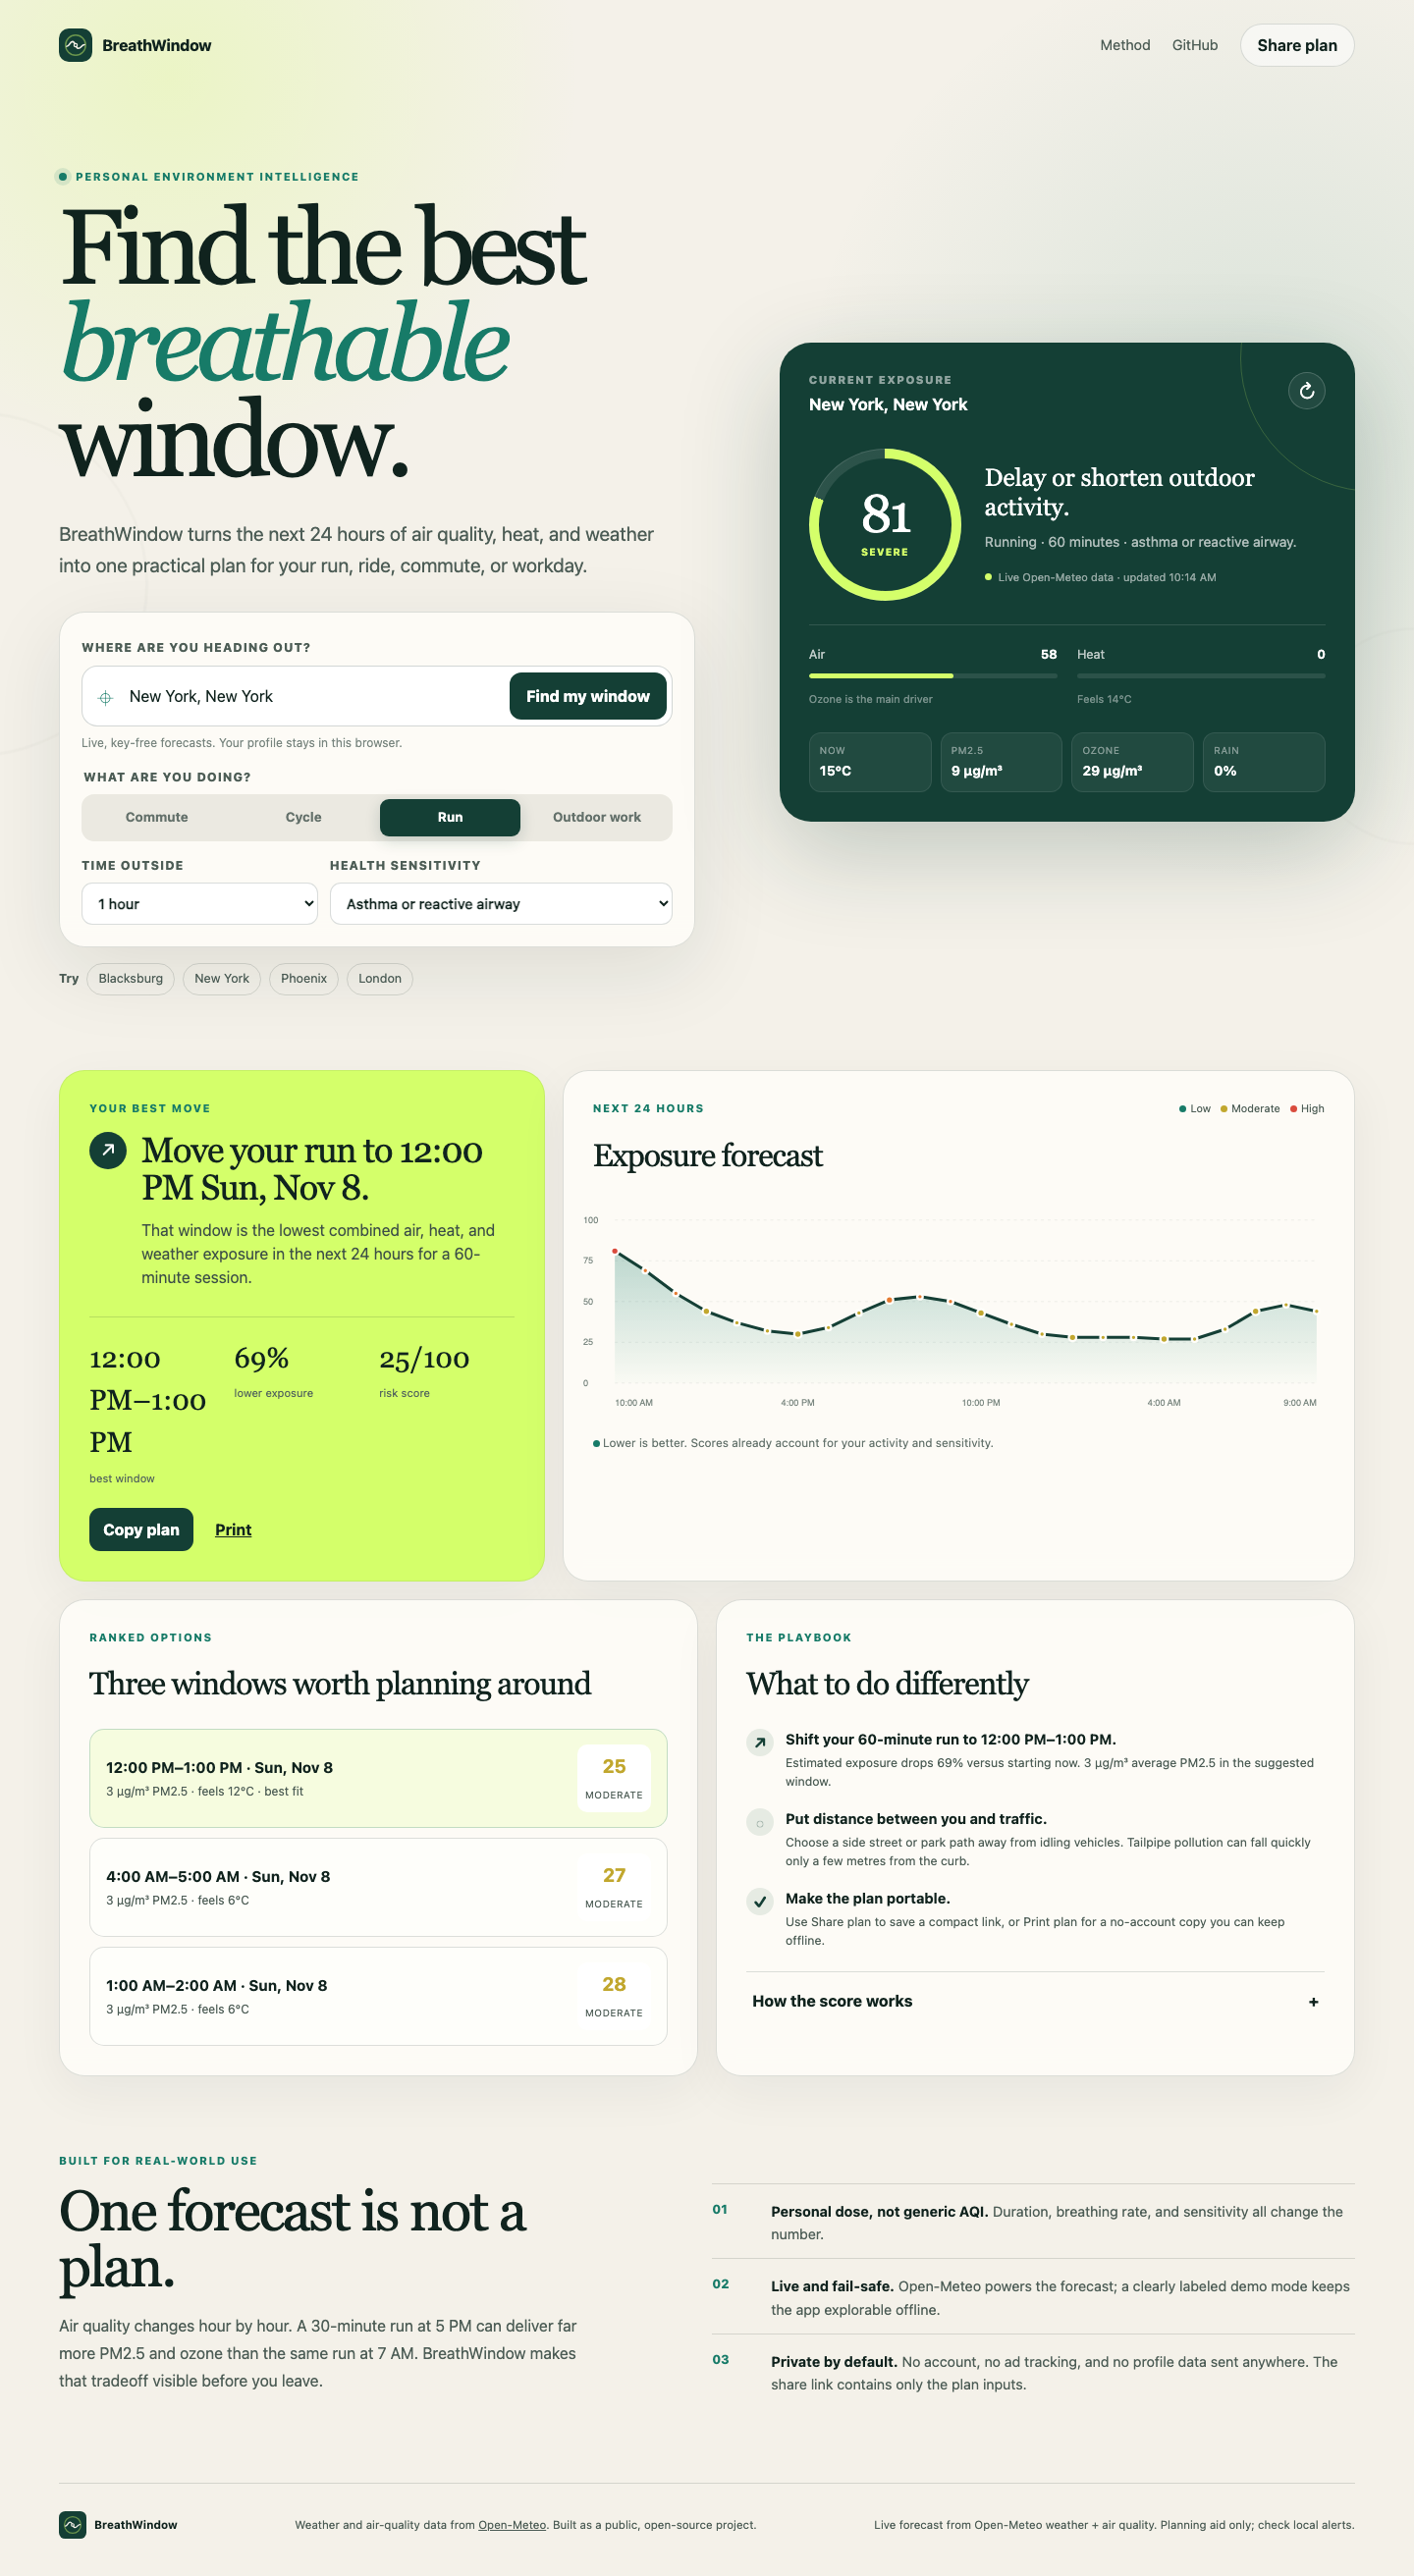
- Fetches live hourly air-quality and weather forecasts from Open-Meteo.
- Estimates personal PM2.5 and ozone dose using activity-specific breathing rates.
- Adds apparent-heat, rain, and wind stress.
- Ranks three non-overlapping lower-exposure windows in the next 24 hours.
- Visualizes the full forecast and explains the dominant risk driver.
- Generates an actionable playbook for timing, route, heat, and rain.
- Copies a shareable plan and provides a print-friendly view.
- Falls back to a clearly labeled sample scenario if the live API is unavailable.
- Installs as an offline-capable progressive web app.
Why impact matters
The app is designed for people making ordinary but consequential decisions: someone with asthma choosing when to run, a parent planning recess, an outdoor worker scheduling a shift, or a commuter deciding whether to walk or take transit. Instead of a generic daily label, BreathWindow makes the next safe window visible.
How it works
The scoring model in src/model.js is deliberately inspectable and tested. It scales pollutant exposure by minutes outside and ventilation rate, scores PM2.5 and ozone separately, adds apparent heat and weather stress, applies a sensitivity multiplier, and then ranks adjacent hourly windows.
Weather and air-quality data are requested concurrently and merged by hourly timestamp. Requests contain only selected coordinates and forecast fields. Health selections remain in the browser. The shareable URL contains only city coordinates and planning inputs.
Technical details
- Dependency-free HTML, CSS, and ES modules.
- Live Open-Meteo weather, air-quality, and geocoding APIs.
- Custom SVG exposure chart with per-hour metadata.
- Service worker and web app manifest for offline shell/installability.
- Deterministic Node test suite for model boundaries, heat index, window ranking, and forecast selection.
- Responsive, keyboard-accessible interface with reduced-motion and print modes.
- Deployed free on GitHub Pages.
Challenges
The hardest part was making a transparent personal exposure score without implying medical certainty. I separated the score into visible air, heat, and weather components, kept the calculation inspectable, and presented it as a planning aid rather than a clinical recommendation. I also designed the app to remain usable when a live forecast request fails.
What I learned
The useful unit is not a citywide AQI number but a time-specific exposure window. Small changes in duration and exertion can change the ranking substantially. Clear explanations and fallback behavior matter as much as the forecast itself.
Future plans
- Add route-level exposure comparisons.
- Support saved profiles and recurring plans.
- Add pollen and wildfire-smoke layers.
- Publish sensor-calibration notes and model validation data.
- Add multilingual public-health guidance.
Links
- Live app: https://bgrubbs1.github.io/breathwindow/
- Source code and setup: https://github.com/bgrubbs1/breathwindow
- Demo video: https://bgrubbs1.github.io/breathwindow/docs/breathwindow-demo.mp4
Forecast data from Open-Meteo. BreathWindow is a planning aid, not a medical device; users should follow local public-health alerts and clinical advice.
Built With
- css3
- github
- html5
- javascript
- node.js-test-runner
- open-meteo
- progressive-web-app
- service-workers
- web-apis
