Inspiration
I live near Houston, where summer ozone days are routine. The American Lung Association's State of the Air 2026 ranks the Houston-Pasadena metro 6th worst in the U.S. for ozone, and Harris County averaged 43.3 weighted unhealthy ozone days a year in 2022–2024. At the same time, about 4.8 million U.S. children (6.7%) have asthma, and 47% of them had at least one asthma attack in the past year (CDC, 2023 NHIS).
Families with asthma usually get a paper asthma action plan from their doctor (green, yellow and red zones). EPA's advice for bad-ozone days for people with asthma is literally "follow your asthma action plan and keep quick-relief medicine handy." But the plan is in a drawer and the forecast is in a different app, so they almost never meet the night before, when there's still time to move practice indoors or take the pre-exercise medicine the doctor already prescribed.
What it does
BreatheEasy puts the plan and tomorrow's air on one screen:
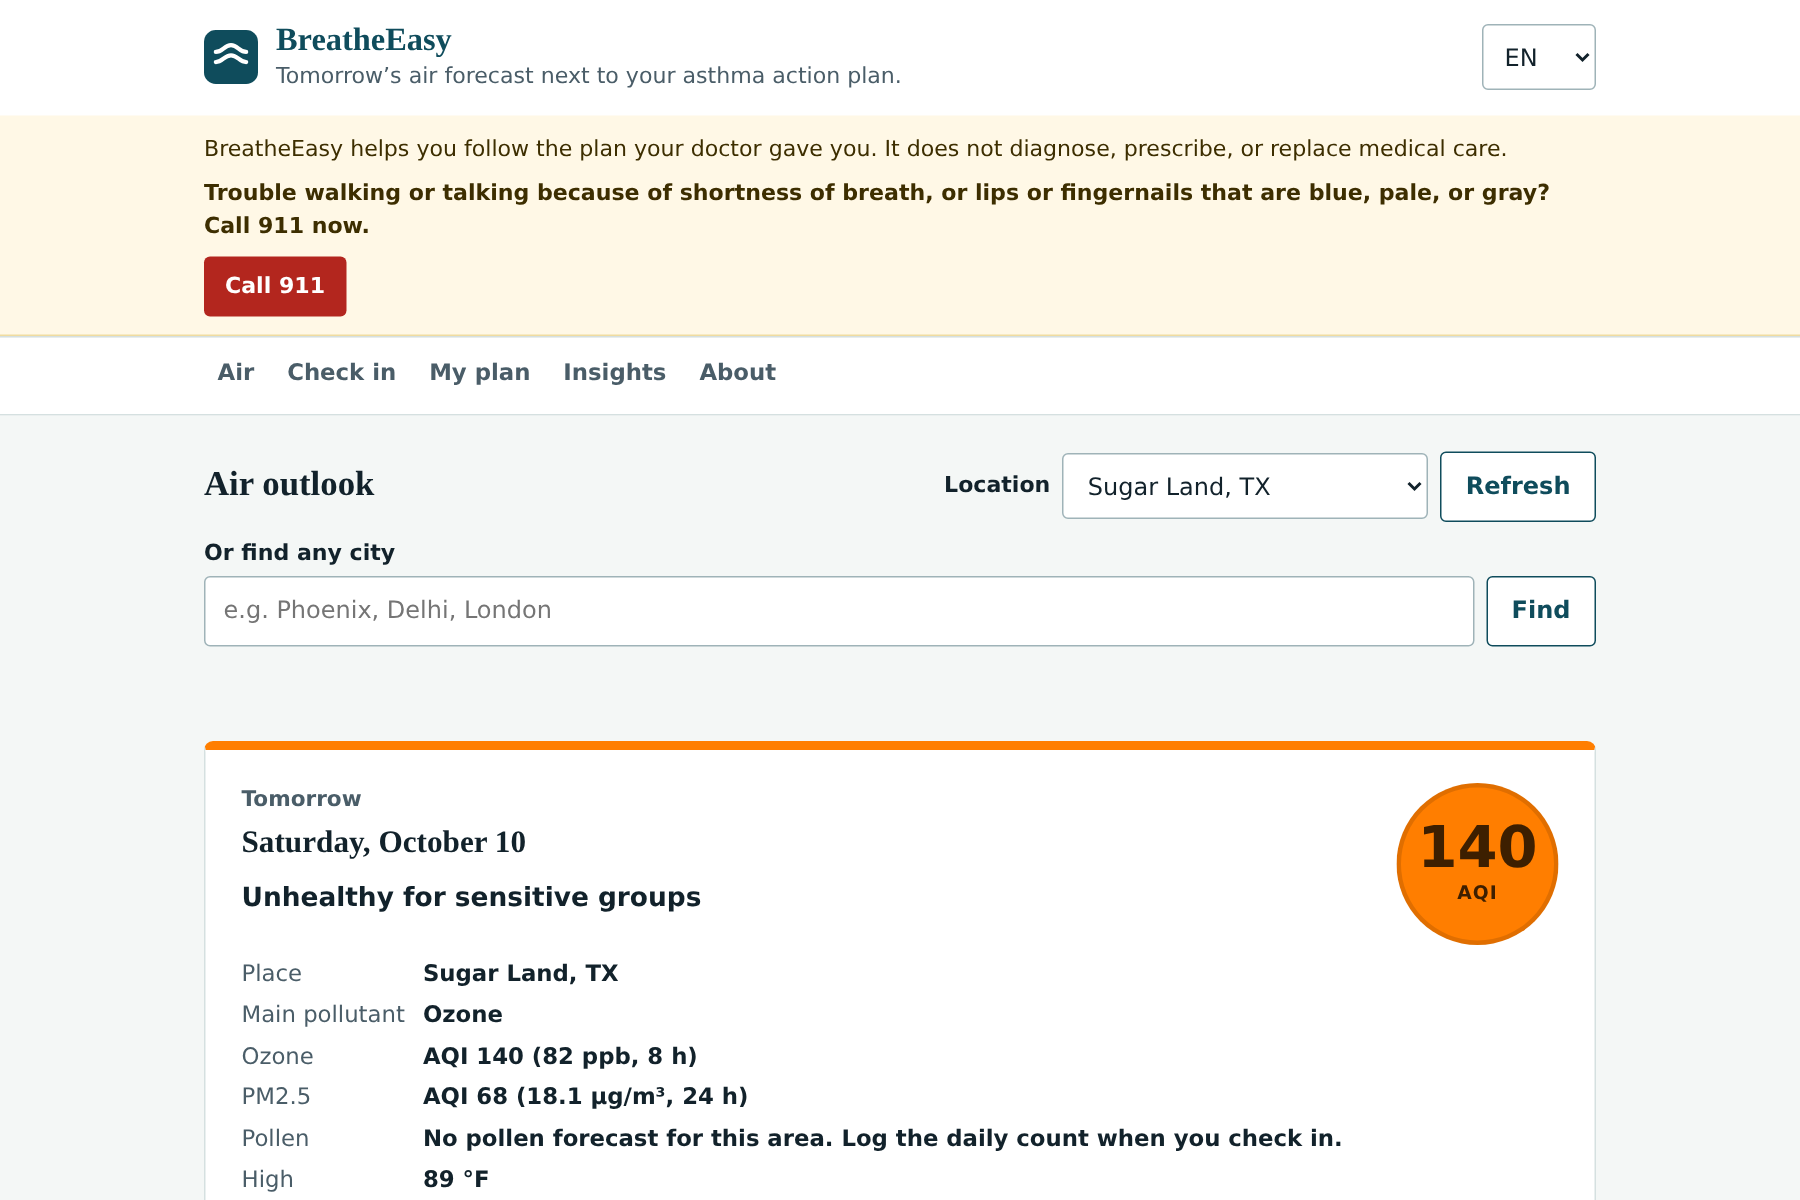
- Tomorrow's air, computed the EPA way. It pulls the hourly ozone and PM2.5 forecast (Open-Meteo / Copernicus CAMS) and computes the daily U.S. AQI with EPA's own breakpoints and averaging rules (8-hour ozone, 24-hour PM2.5, including the 2024 PM2.5 update), then shows the category, color and main pollutant.
- What to do, in your doctor's words. It shows EPA's guidance for that AQI level for people with asthma and puts the text you copied from your own action plan next to it (for example, your pre-exercise medicine on an orange ozone day). The app never invents medication names, doses or treatment steps.
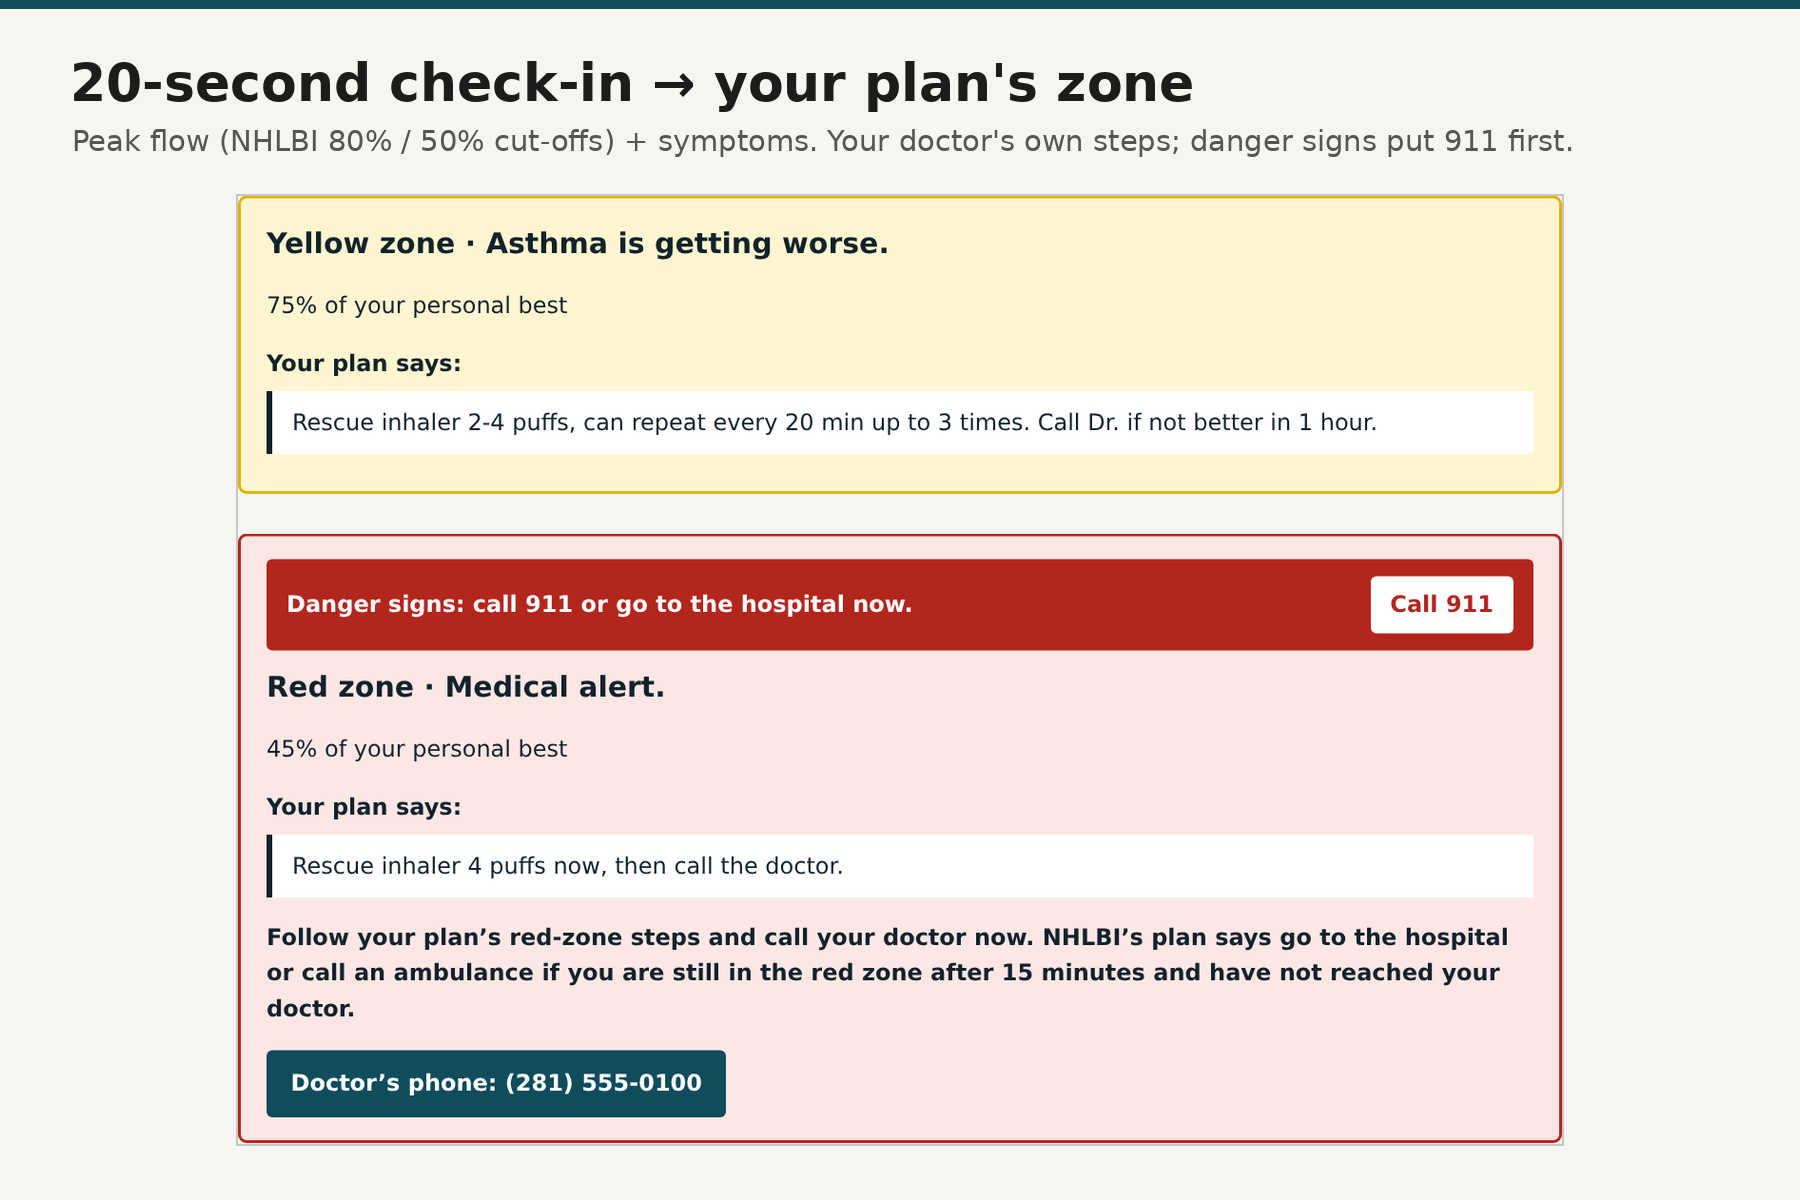
- A 20-second daily check-in (peak flow and/or symptoms) that sorts you into your plan's green, yellow or red zone using the NHLBI cut-offs (80% / 50% of personal best), shows that zone's steps, and puts a Call 911 button up front when a danger sign is checked (CDC's 2024 wording: trouble walking or talking, or lips or fingernails that are blue, pale, or gray).
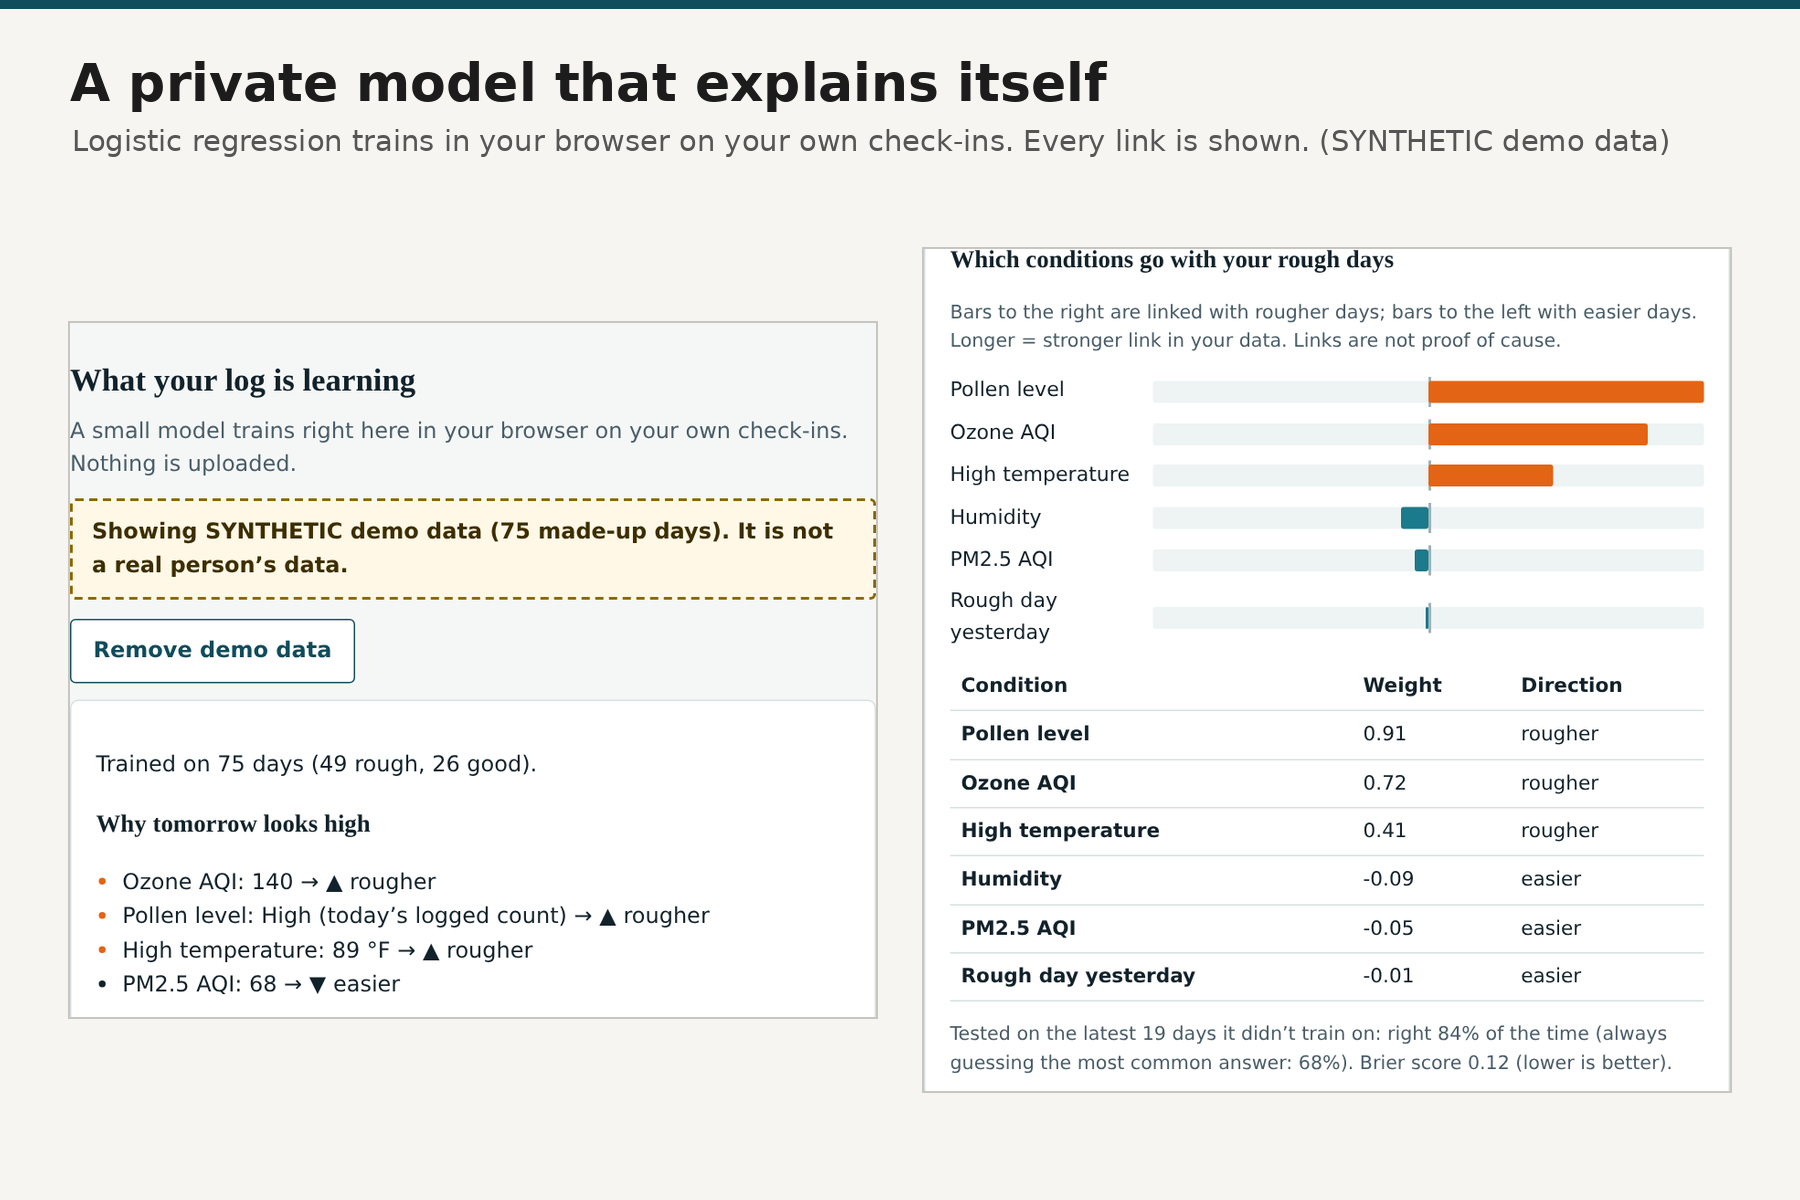
- A personal outlook that explains itself. A small logistic-regression model trains in your browser on your own check-ins and learns which conditions (ozone, PM2.5, pollen, heat, humidity, a rough day yesterday) tend to come before your rough days. Every prediction is broken into per-feature reasons, the learned weights are shown as a chart plus an accessible table, and accuracy is reported on held-out recent days next to a naive baseline. It refuses to predict until it has 14 days with some good and some rough days.
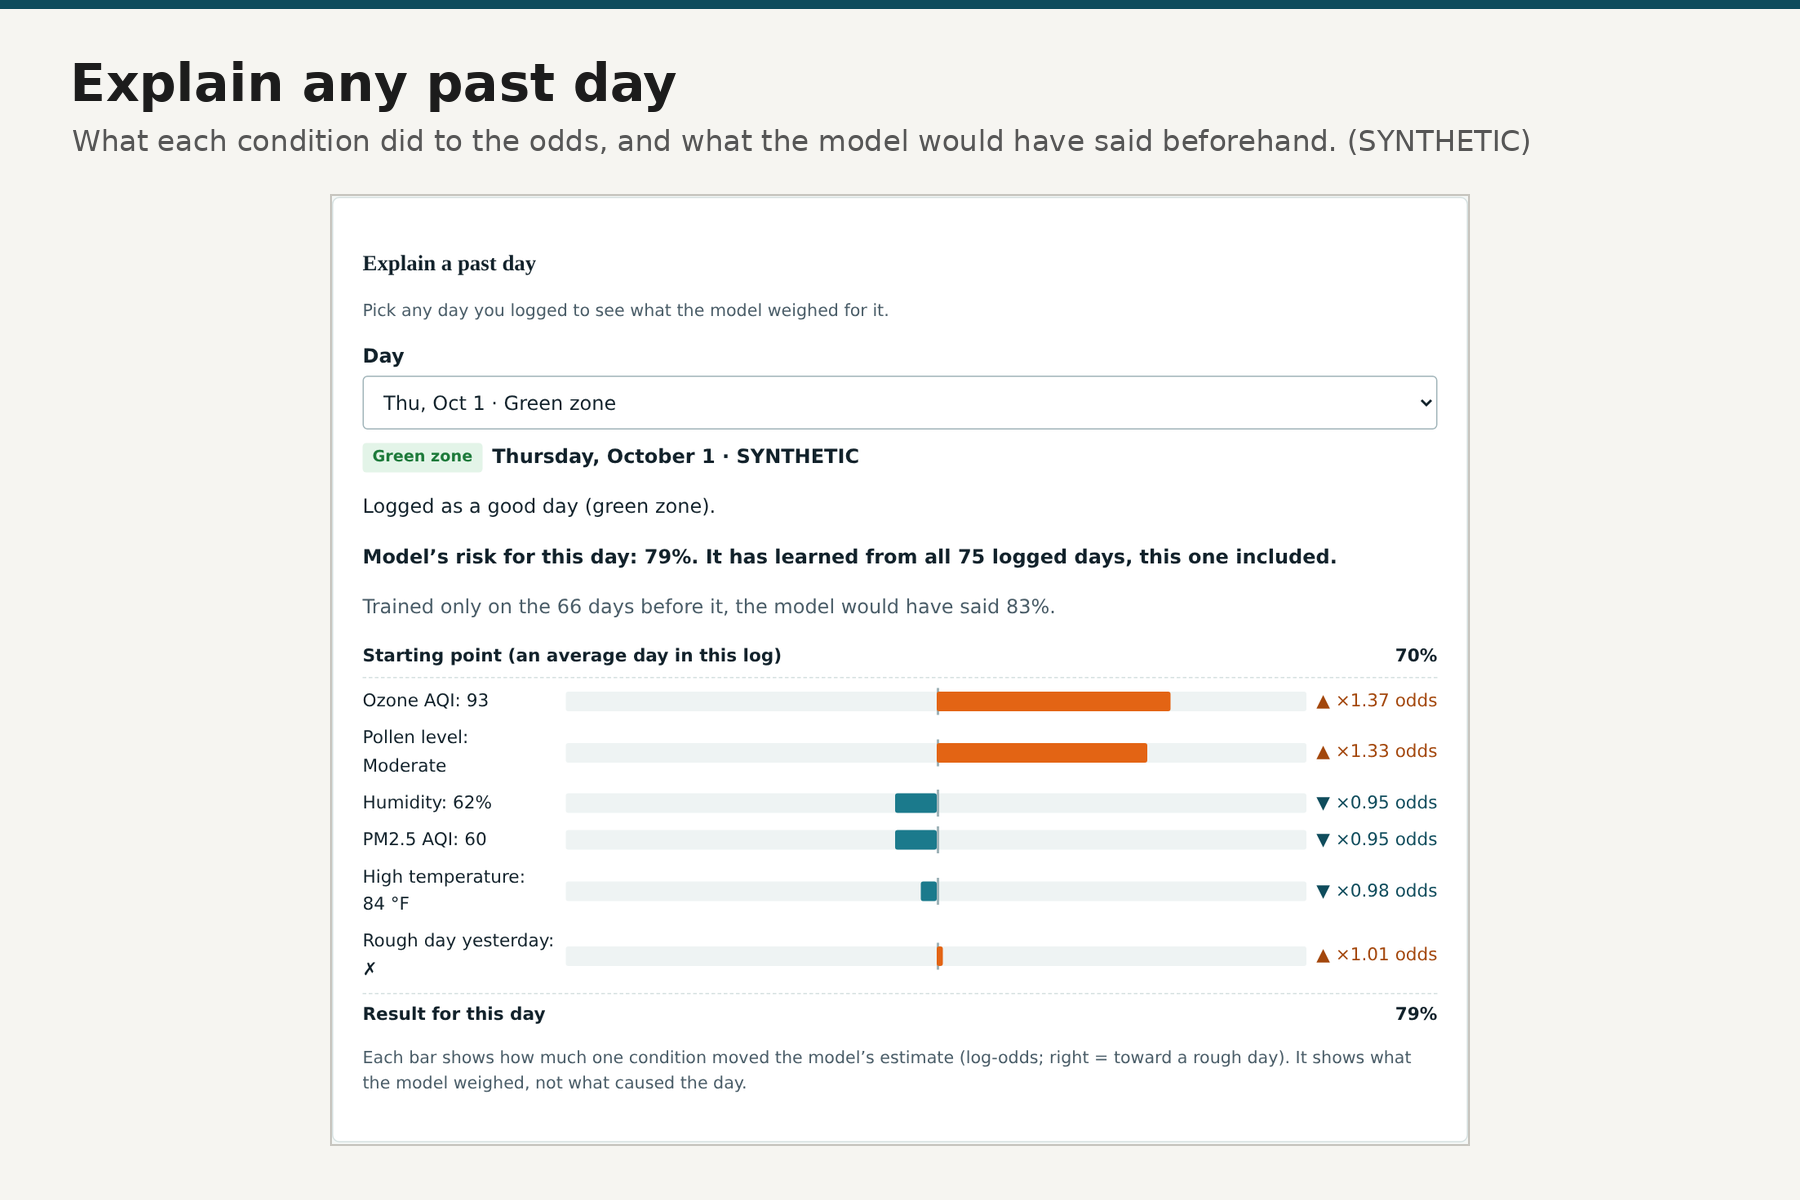
- Explain any past day. Pick any day you logged and see the starting point, how much each condition pushed the estimate (as an odds multiplier, e.g. "Pollen level: High ▲ ×3.02 odds"), the result, and what the model would have said using only the days before it.
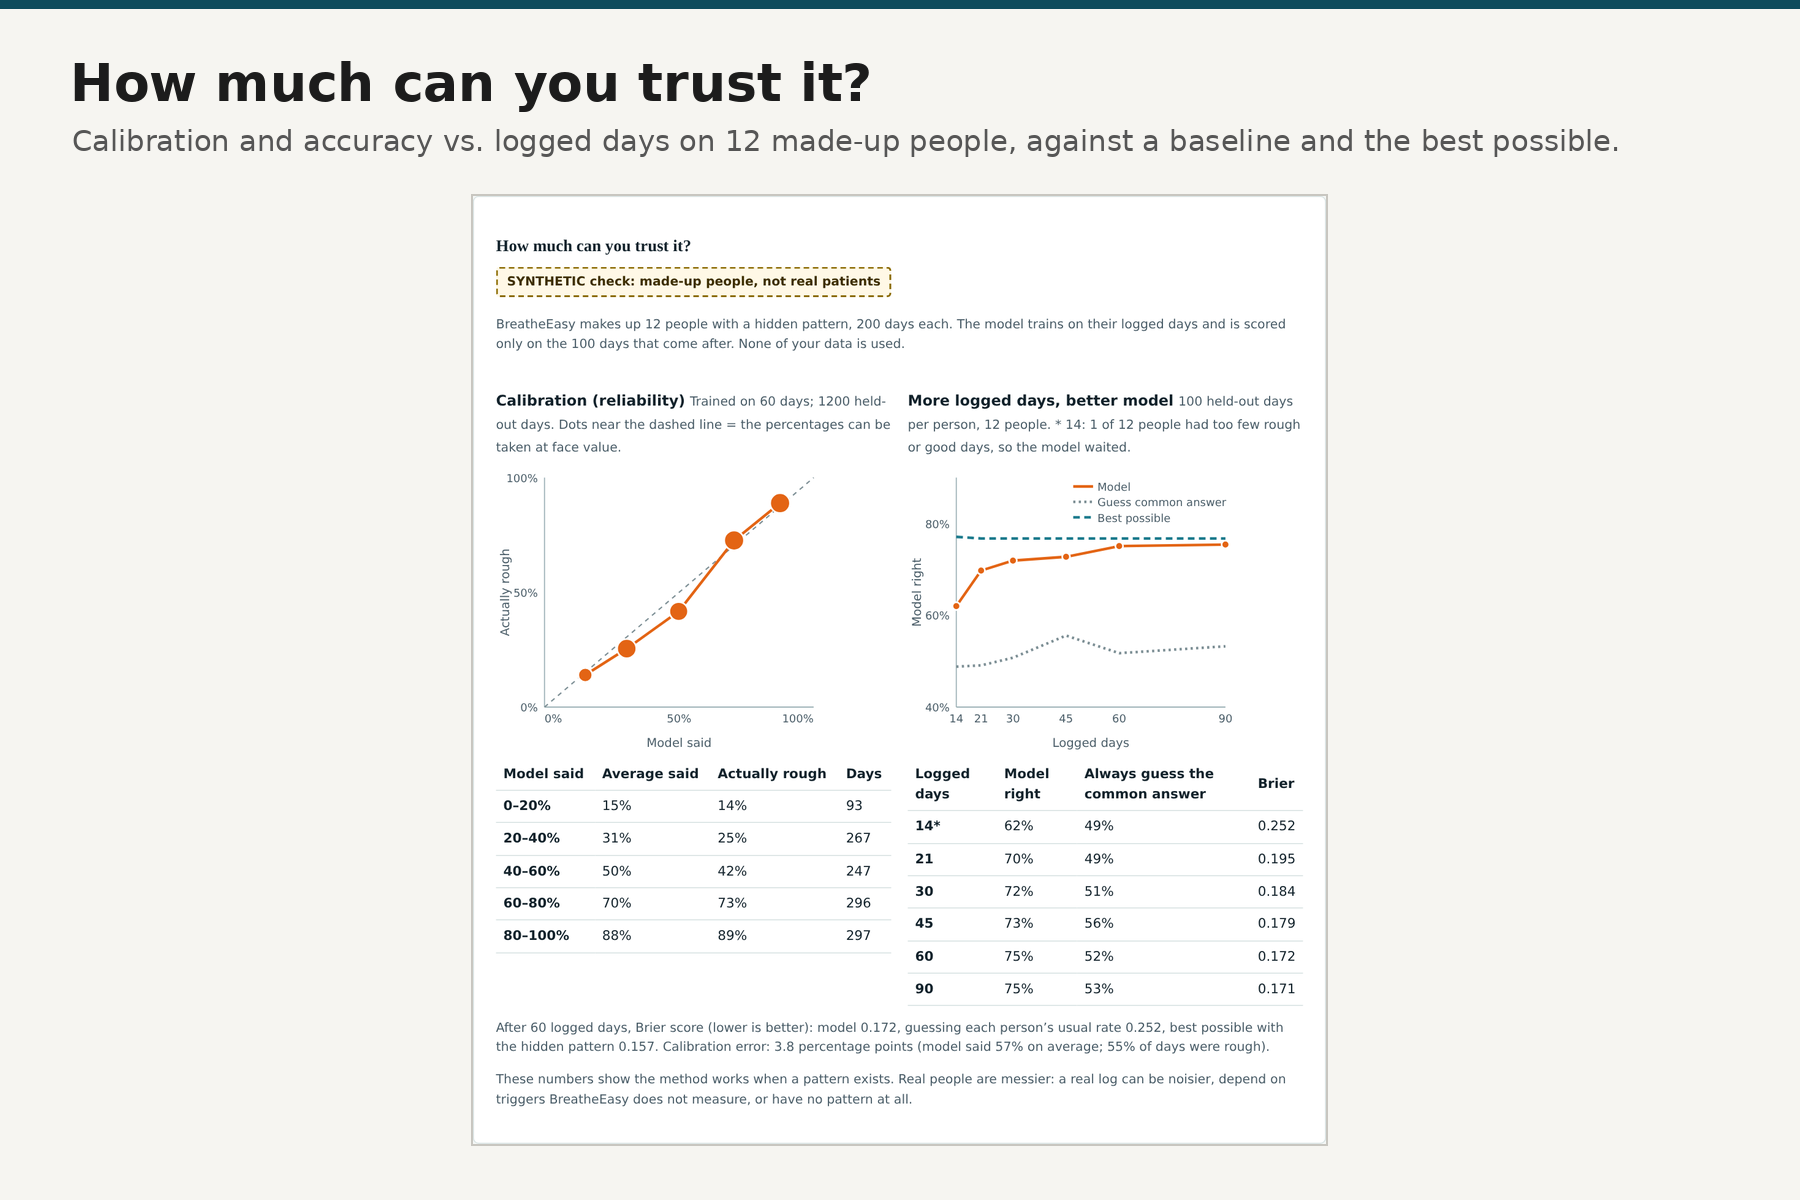
- "How much can you trust it?" (SYNTHETIC check). The app makes up 12 people with a known hidden pattern, trains on their logged days and scores the model only on later days: a reliability plot (is "30%" really about 30%?), a Brier score next to a guess-the-usual-rate baseline and the best possible score, and a curve of accuracy vs. number of logged days.
- Installable, and it opens with no signal. Add it to your home screen. Offline, your plan, check-ins and insights still work, and a forecast saved in the last 3 hours is shown with its age. It can't get a new forecast without a connection, and it won't show one older than 3 hours.
- Share, calendar, print. One tap writes a plain-text note for a coach or school nurse (date, AQI, the guidance lines, your pre-exercise text, the not-medical-advice and 911 lines), adds tomorrow's plan to your calendar (.ics), or prints it.
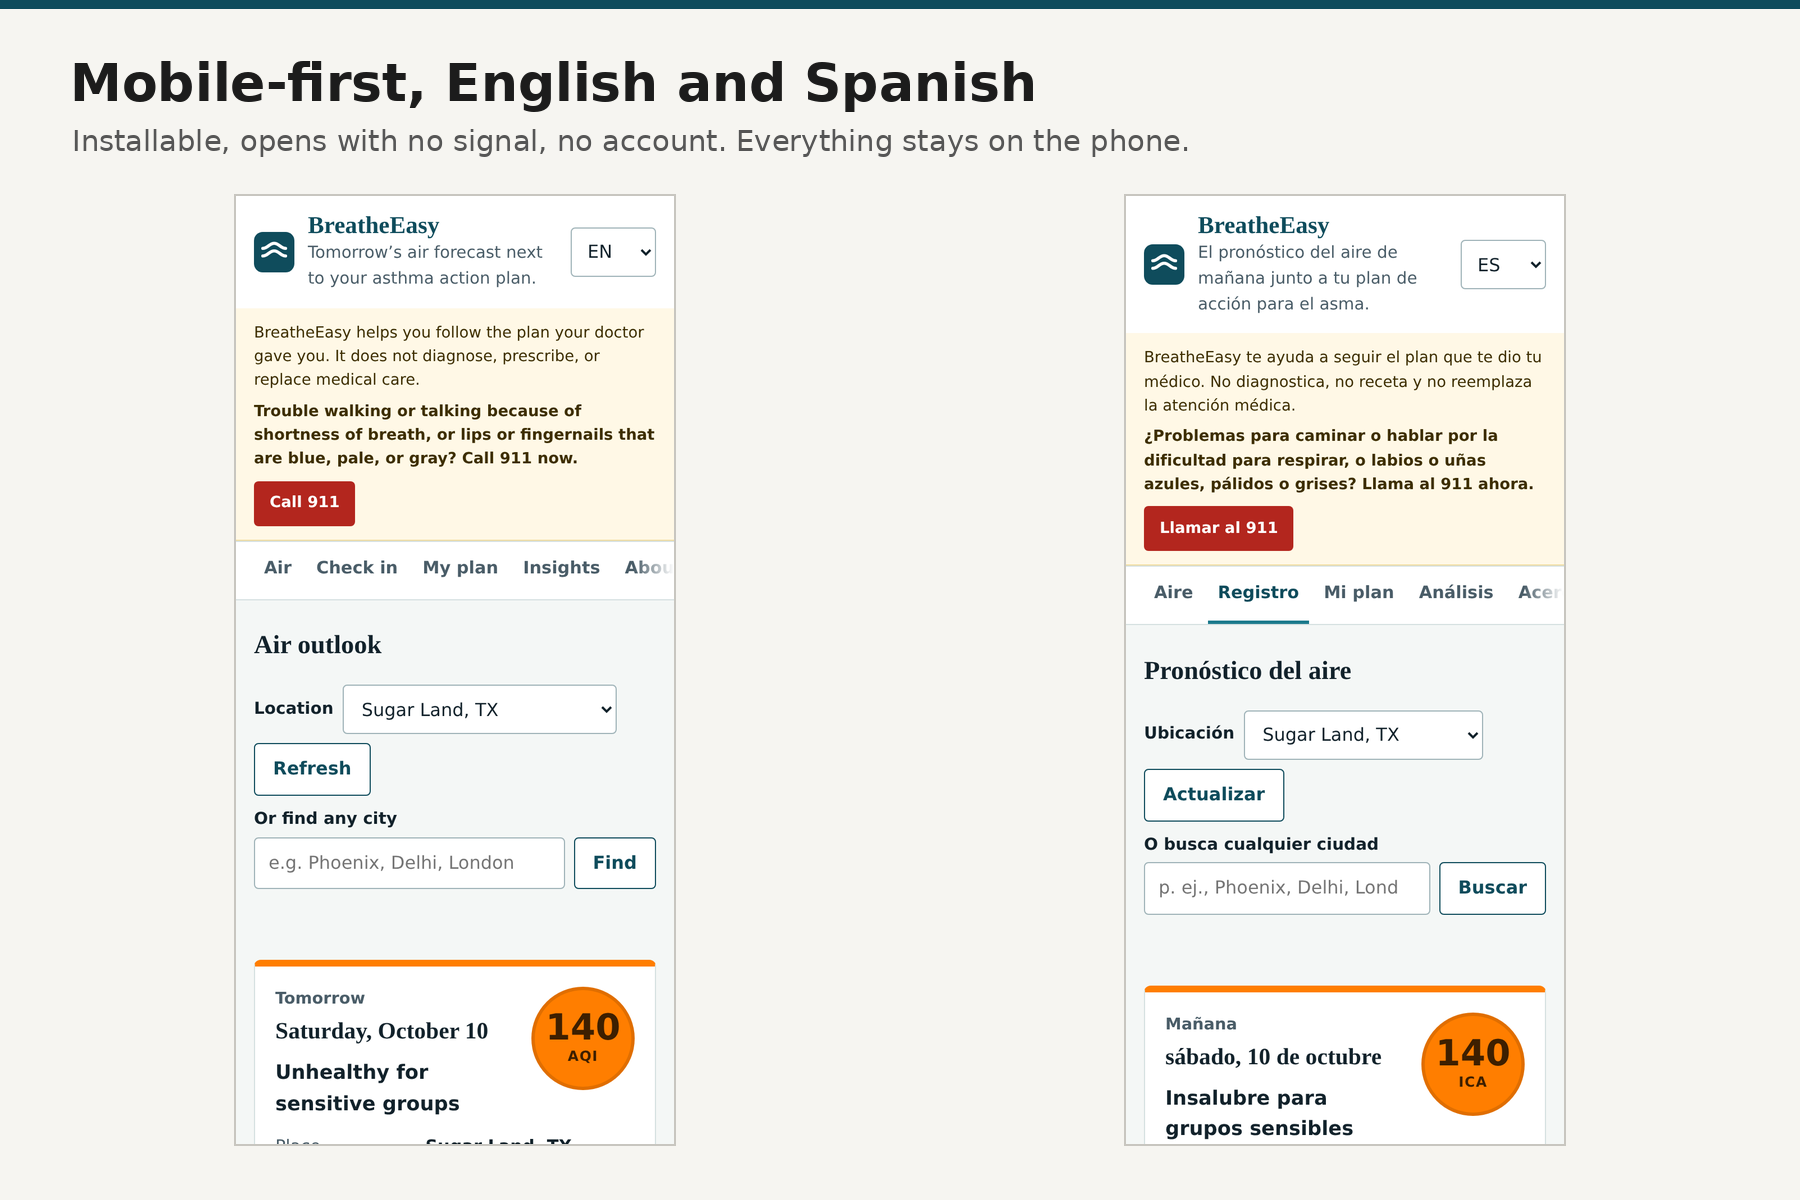
- English and Spanish, mobile-first, and fully private: no account, no server, no tracking. Everything stays in the browser's localStorage, with one-tap export and delete.
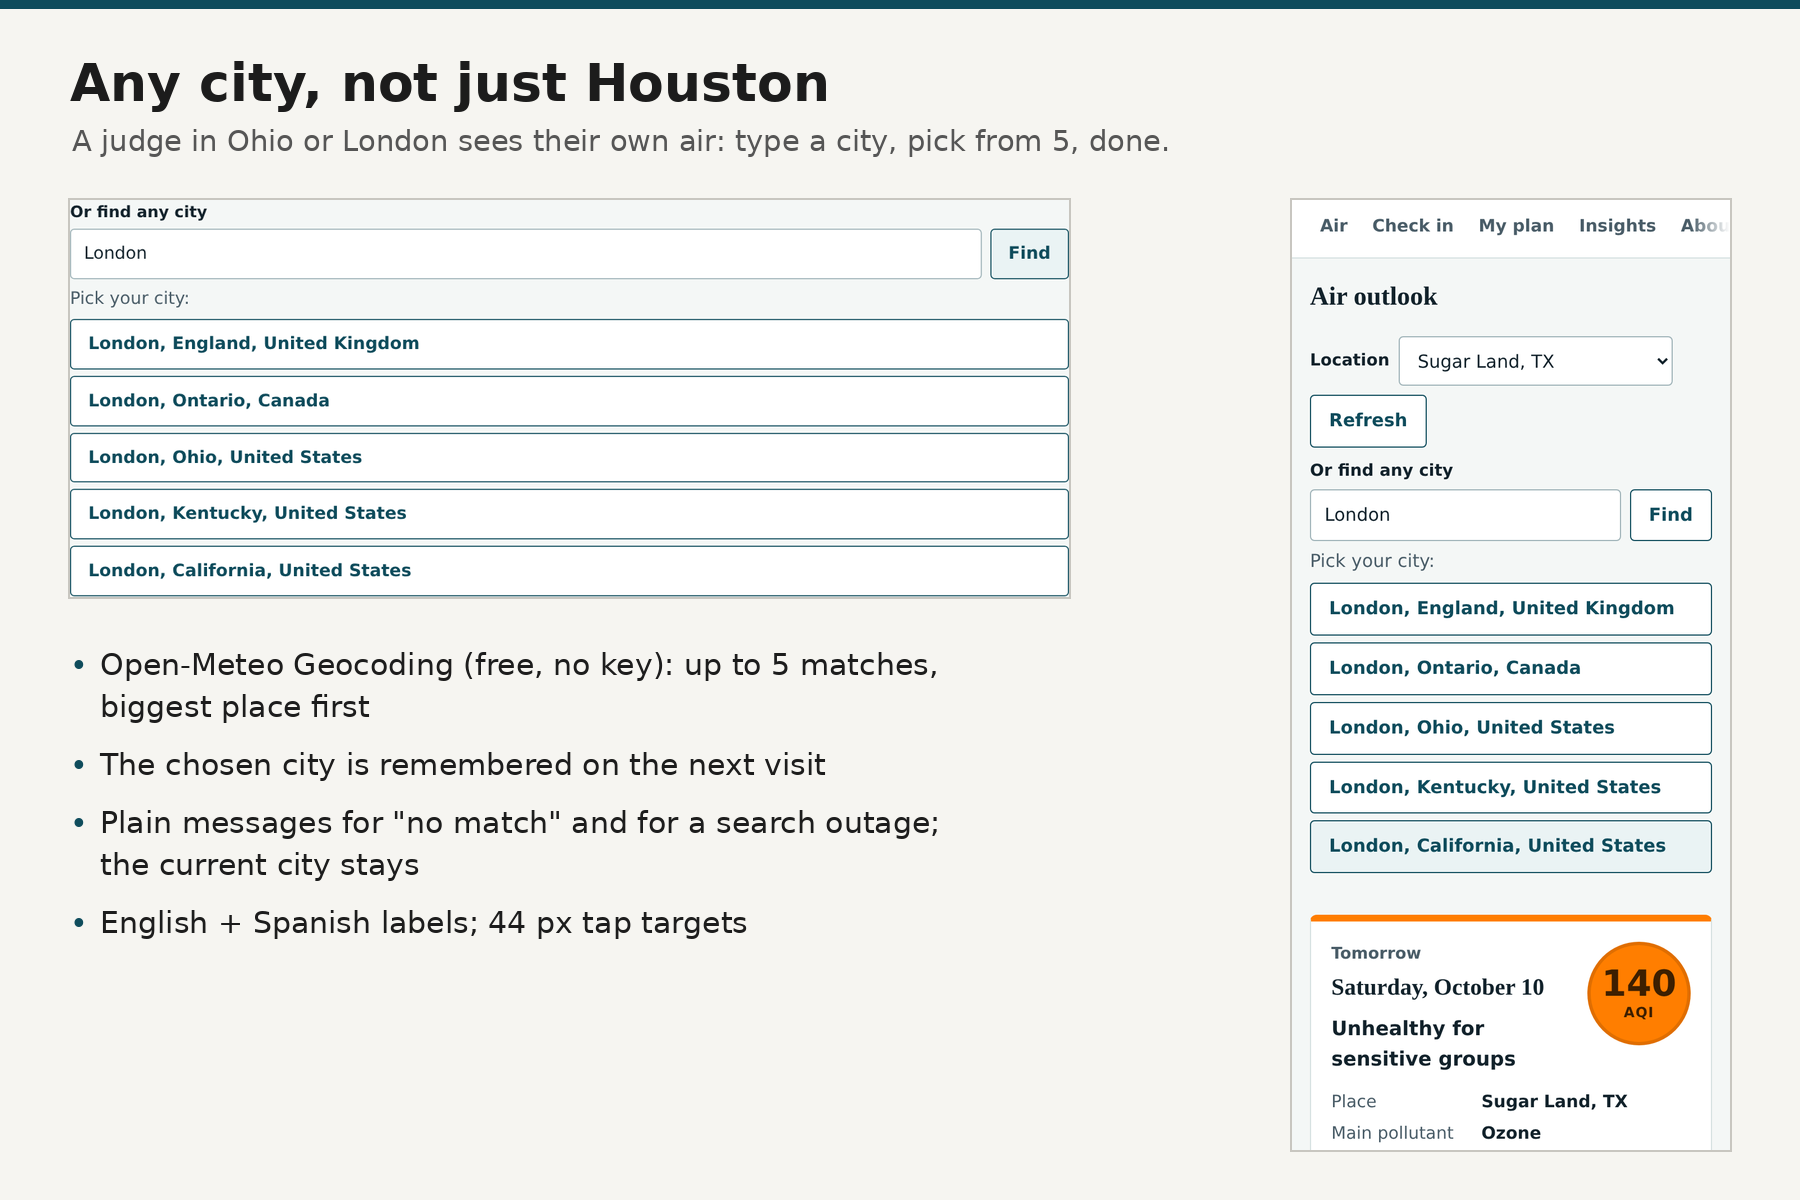
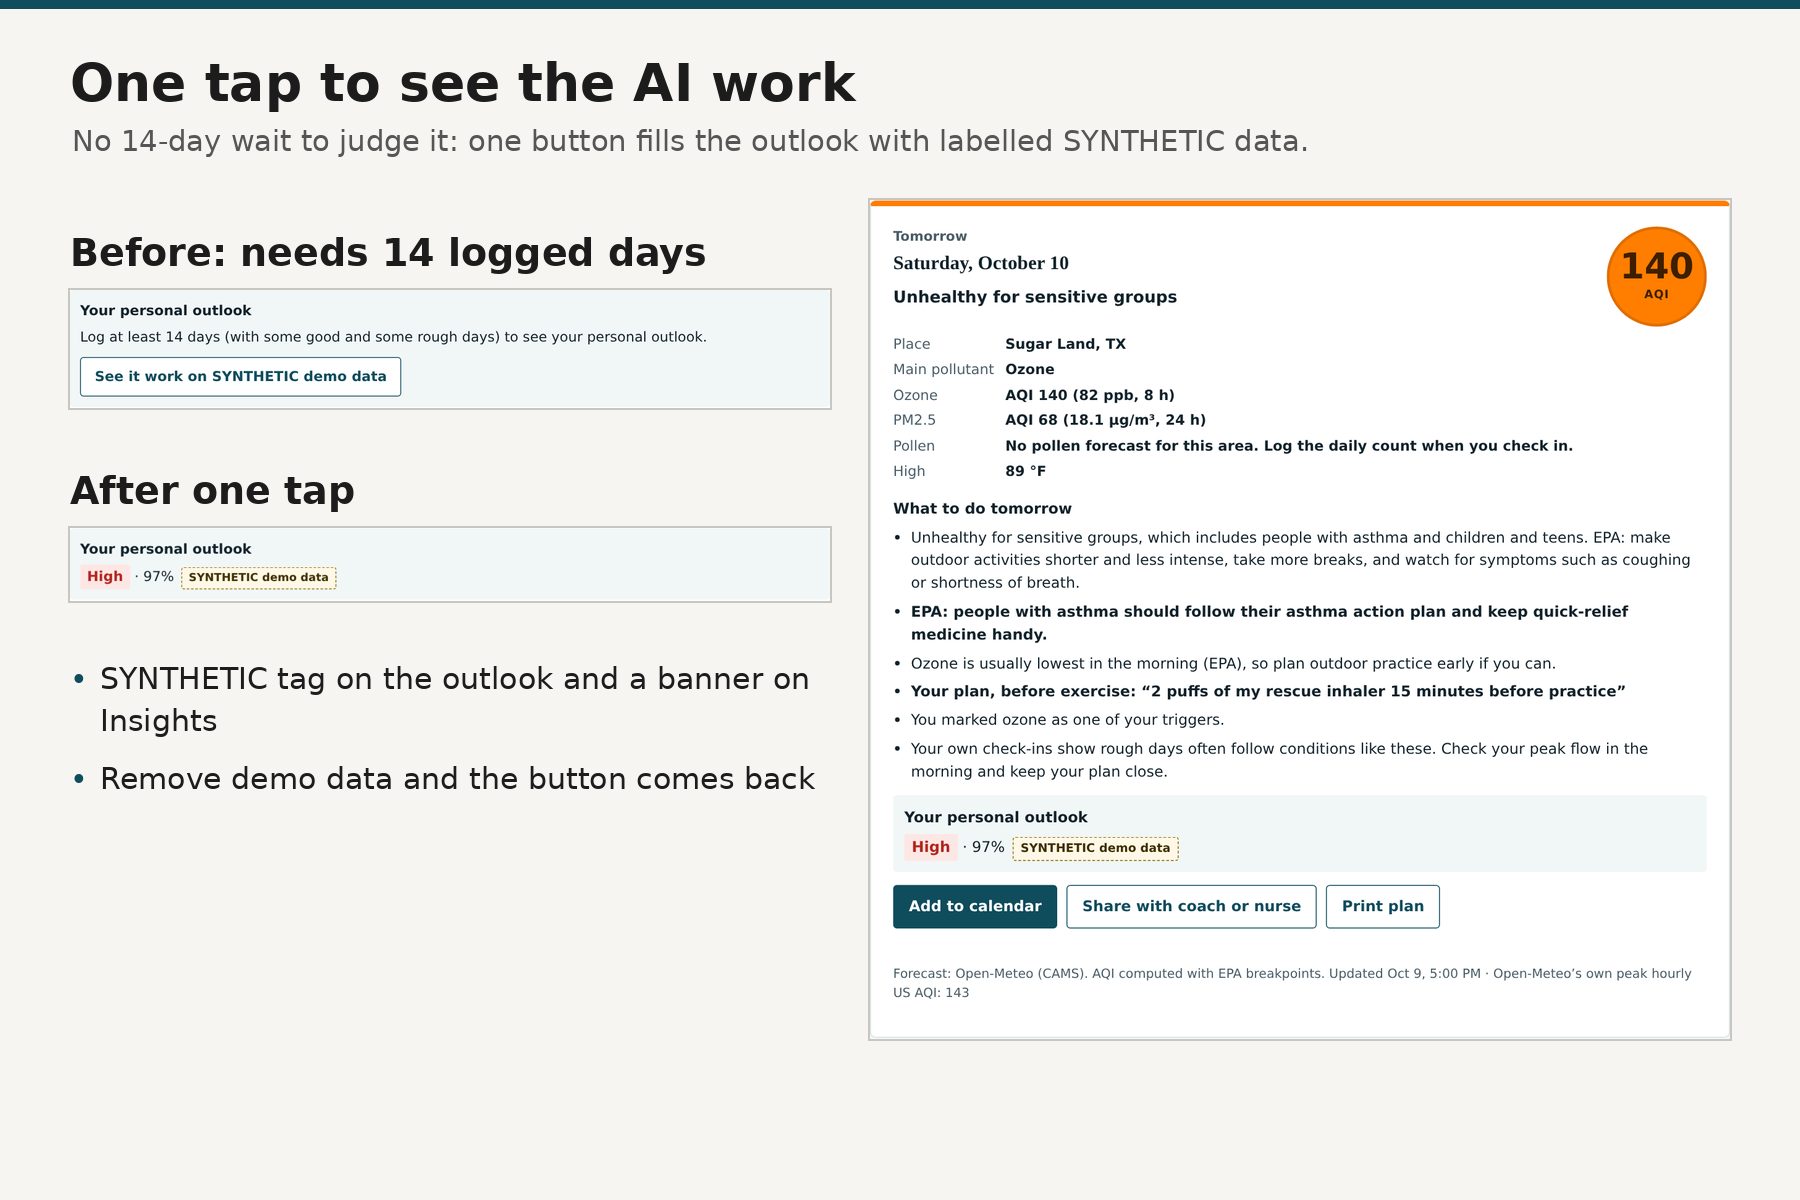
Judges anywhere can search any city (Open-Meteo geocoding, no key), and a one-tap button on the Air card shows the model's outlook on clearly labelled SYNTHETIC demo data.
How we built it
- Plain HTML, CSS and JavaScript, no framework and no build step, so it runs from a static file on any phone.
- aqi.js implements the EPA AQI tables from 40 CFR Part 58 Appendix G; forecast.js turns Open-Meteo's hourly data into EPA-method daily values (≥18 of 24 hours for PM2.5, the highest 8-hour ozone mean with ≥6 of 8 hours, µg/m³ → ppm at 25 °C, truncation rules).
- zones.js encodes the NHLBI 2020 Asthma Action Plan zones and symptom lists; the worse of peak flow and symptoms wins.
- model.js is an L2-regularised logistic regression trained by gradient descent with standardised features and mean imputation, plus exact per-feature contributions and a chronological held-out evaluation.
- validate.js runs the SYNTHETIC model check: chronological train/test split per made-up person, reliability bins with expected calibration error, Brier score vs. climatology and vs. the generator's own hidden probabilities, and a sensitivity sweep over 14–90 logged days.
- sw.js + manifest.webmanifest make it an installable PWA. A small script hashes every app file and writes the hash into the service worker and every ?v= URL, so each deploy busts the cache; a unit test fails if the hash is stale.
- demo.js generates a clearly labelled synthetic 75-day dataset (seeded) so judges can see the model work; a purple SYNTHETIC banner shows whenever it's loaded.
- 125 Node unit tests (including EPA's own worked ozone example, every breakpoint edge, a saved real Open-Meteo response, calibration and explain-a-day math, and the PWA cache stamp) and 142 headless-Chromium end-to-end checks (zones, 911 alert, model recovering the planted pattern, explain-a-day, the SYNTHETIC trust charts, install + offline reload, calendar export, share note, Spanish, persistence, accessibility, no overflow at 390 px, no network calls except Open-Meteo, API-failure message).
- I used an AI coding assistant to help draft code, tests and copy; I directed the design and checked every statistic and guideline against its source.
Challenges we ran into
- Getting the AQI right. A forecast API gives hourly concentrations, but the official AQI uses 8-hour and 24-hour averages with specific truncation and data-completeness rules. On the real Oct 10, 2026 Sugar Land forecast our EPA-method AQI is 140; Open-Meteo's own peak hourly U.S. AQI is 143. The app shows both so the difference is visible instead of hidden.
- No free U.S. pollen forecast. Open-Meteo's pollen data covers Europe only. Rather than fake it, the app says so plainly and lets you log the Houston Health Department daily count; a level you log today carries to tomorrow's card labelled "today's logged count."
- Making "AI" honest for a health app. The model has to stay quiet with too little data, explain every prediction, compare itself to a baseline, and never present synthetic data as real. Treatment text can only come from the user's own plan.
Accomplishments that we're proud of
- On the synthetic demo (where the made-up person reacts to ozone, pollen and heat but not humidity), the model ranks pollen and ozone as the top two links and scores 84% accuracy on 19 held-out days vs. a 68% baseline. That shows the pipeline works; it says nothing about real patients, and the app says that too.
- On a SYNTHETIC cohort (12 made-up people, 100 later days each), after 60 logged days the model is well calibrated (expected calibration error 3.8 points; it said 57% on average, 55% of days were rough) with a Brier score of 0.172, vs. 0.252 for guessing each person's usual rate and 0.157 for the best possible. Accuracy rises from 62% at 14 logged days to 75% at 60 (best possible 77%), which is why the app asks for at least two weeks and gets better after three or four.
- Every number in the app and this write-up links to a primary source (CDC, NHLBI, EPA, American Lung Association).
- Full Spanish translation (a test checks every string and placeholder), and accessibility built in: skip link, labelled controls, live regions, color never the only signal, 44 px touch targets, a data table behind the chart.
What we learned
How the AQI is actually calculated (it's not just "the number on the weather app"), how asthma action plans are structured, how to build a model that's useful and explains itself in one person's small dataset, and how much of a health tool's design is about what it should refuse to say.
What's next for BreatheEasy
- Pilot it with a few families and a school nurse in Fort Bend ISD, and ask what they'd change.
- Official local ozone forecasts and Ozone Action Day alerts from AirNow (needs an API key and a small proxy).
- Evening reminder notifications (the app is already installable and opens offline; reminders that fire when the app is closed need a push server).
- An optional printable one-page summary of the check-in log to bring to doctor visits.
- A U.S. pollen source if a free, keyless one becomes available.
Safety
BreatheEasy is not medical advice and not a medical device. It helps you follow the plan your doctor wrote. Trouble walking or talking from shortness of breath, or lips or fingernails that are blue, pale, or gray: call 911.
Sources
- CDC, Most Recent National Asthma Data (2023 NHIS): https://www.cdc.gov/asthma/most_recent_national_asthma_data.htm
- American Lung Association, State of the Air 2026, Texas: https://www.lung.org/media/press-releases/fy26-sota-texas
- NHLBI Asthma Action Plan (2020): https://www.nhlbi.nih.gov/resources/asthma-action-plan-2020
- EPA AQI breakpoints, 40 CFR Part 58 App. G: https://www.ecfr.gov/current/title-40/chapter-I/subchapter-C/part-58/appendix-Appendix%20G%20to%20Part%2058
- EPA Air Quality Guide for Ozone: https://document.airnow.gov/air-quality-guide-for-ozone.pdf
- Open-Meteo Air Quality API: https://open-meteo.com/en/docs/air-quality-api
Built With
- copernicus-cams
- css3
- github
- html5
- javascript
- localstorage
- logistic-regression
- machine-learning
- node.js
- open-meteo
- playwright

Log in or sign up for Devpost to join the conversation.