-
-
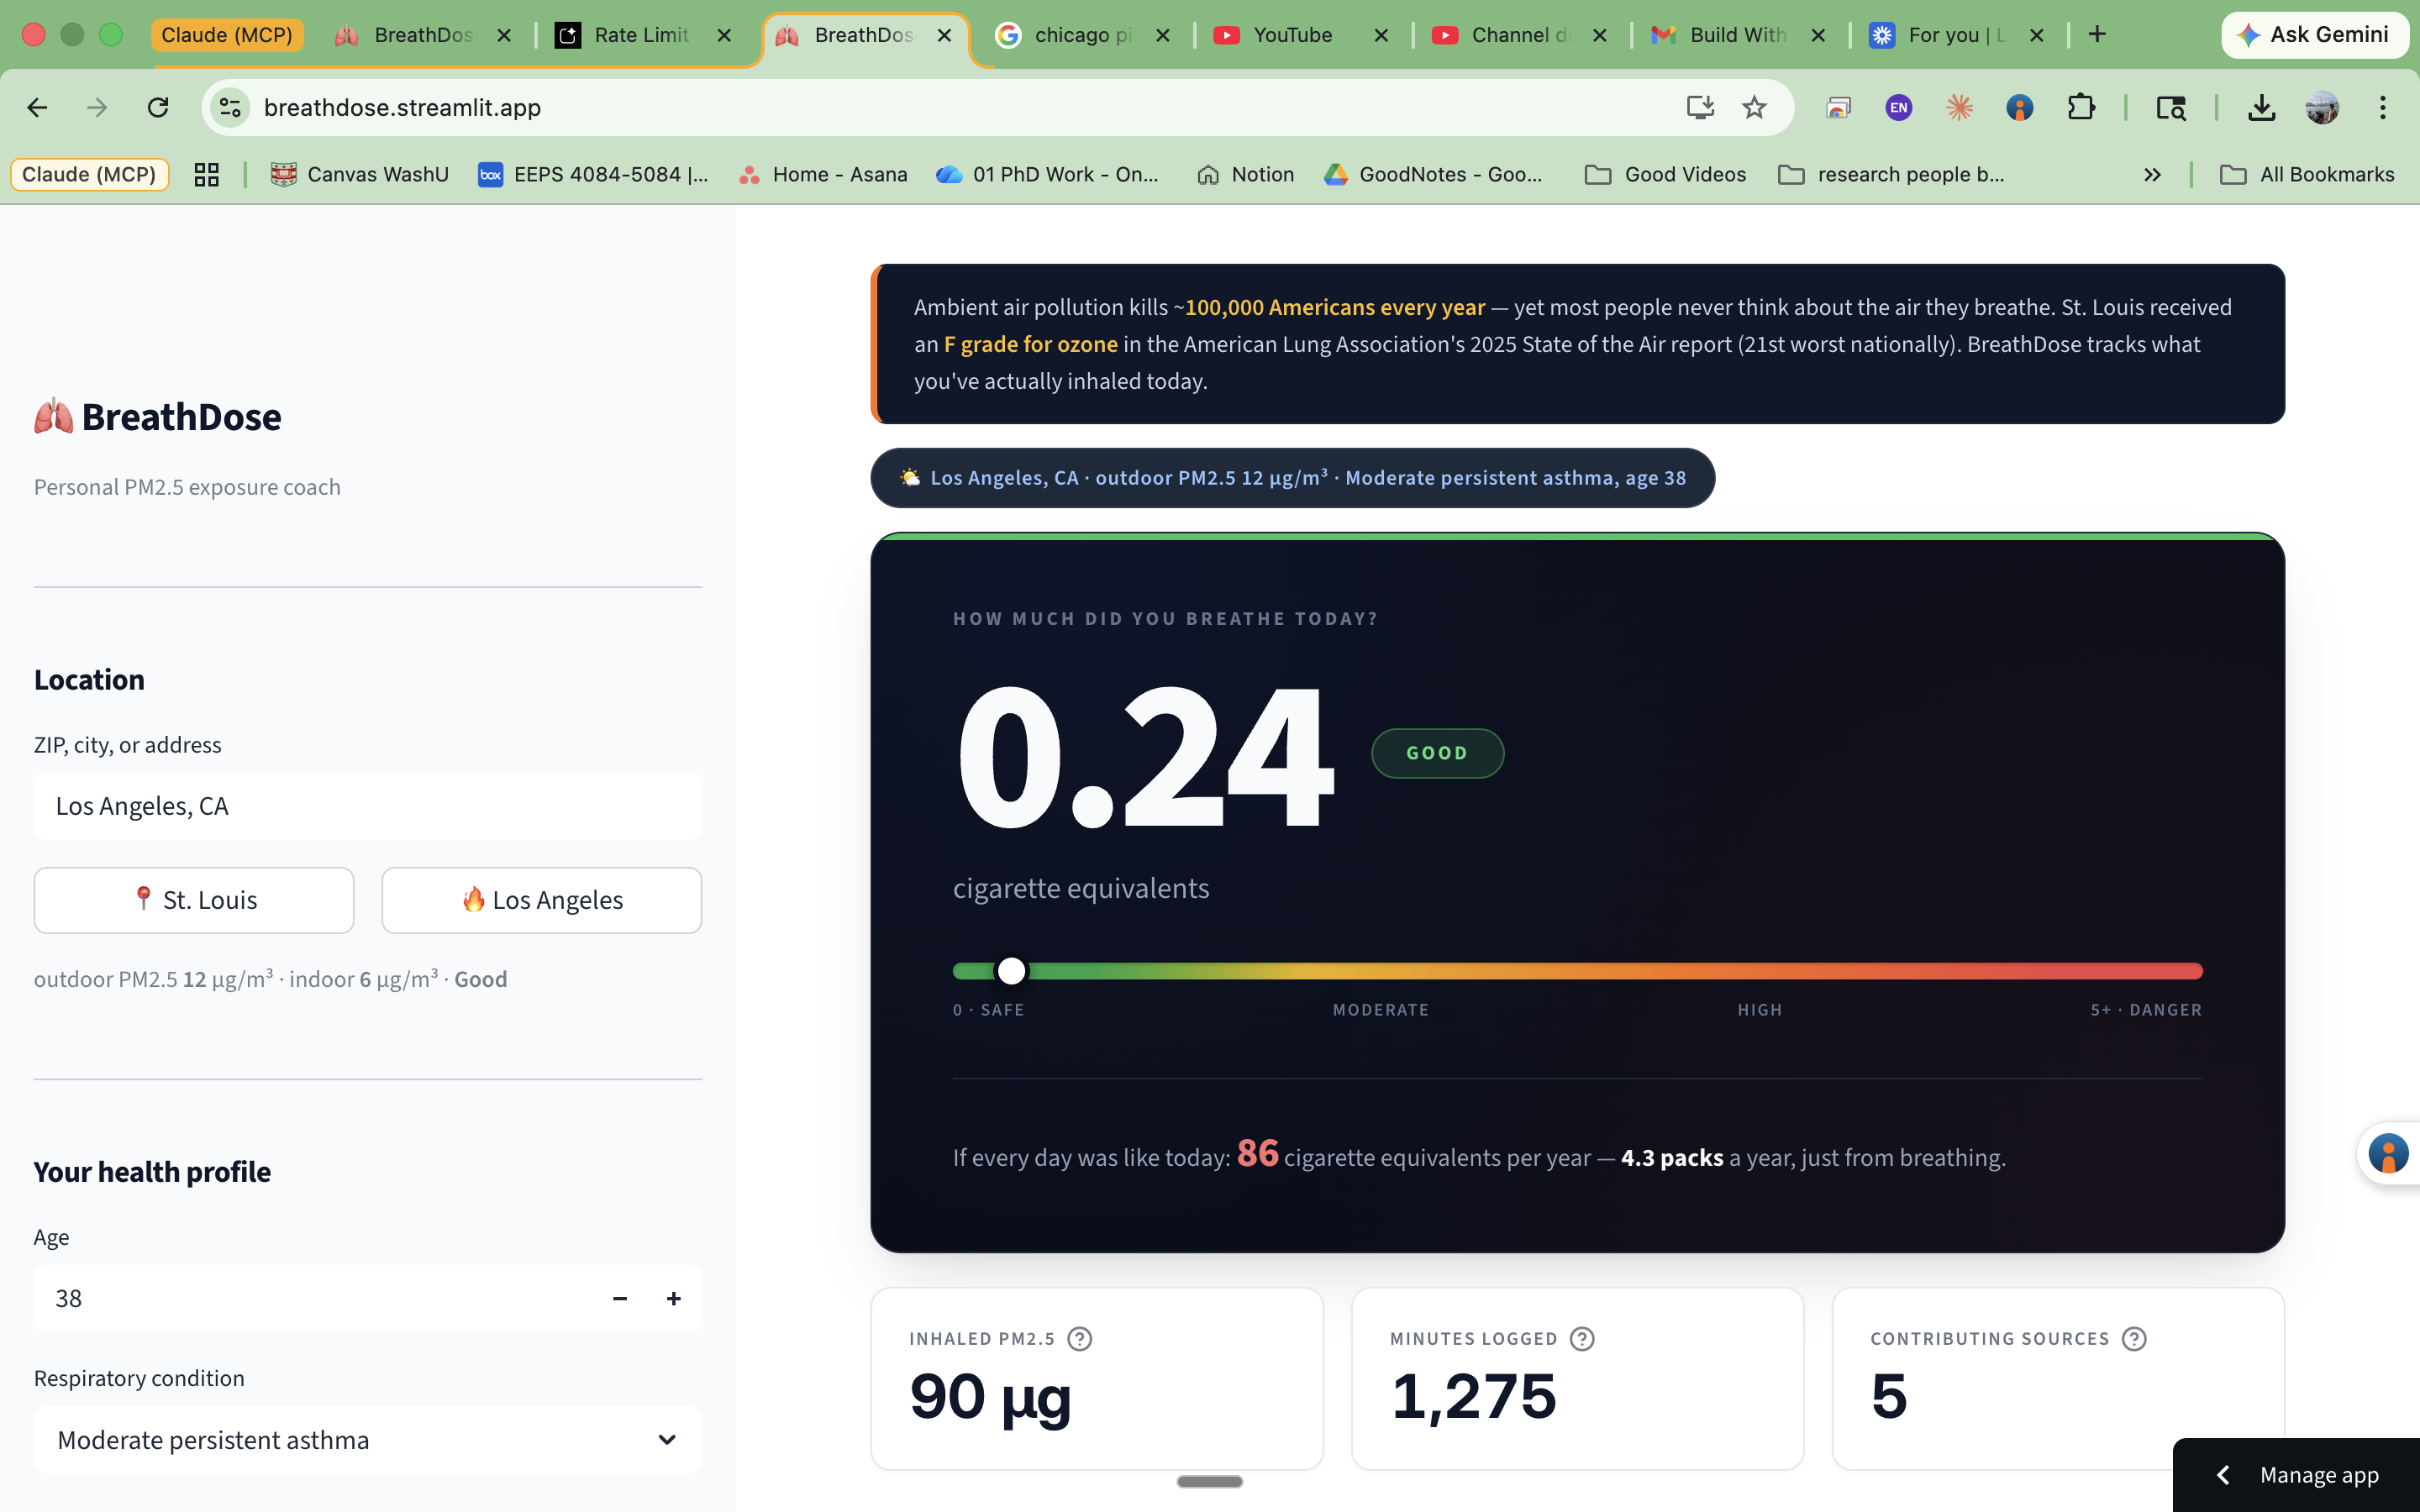
01_dashboard_overview
-
02_gemini_analysis
-
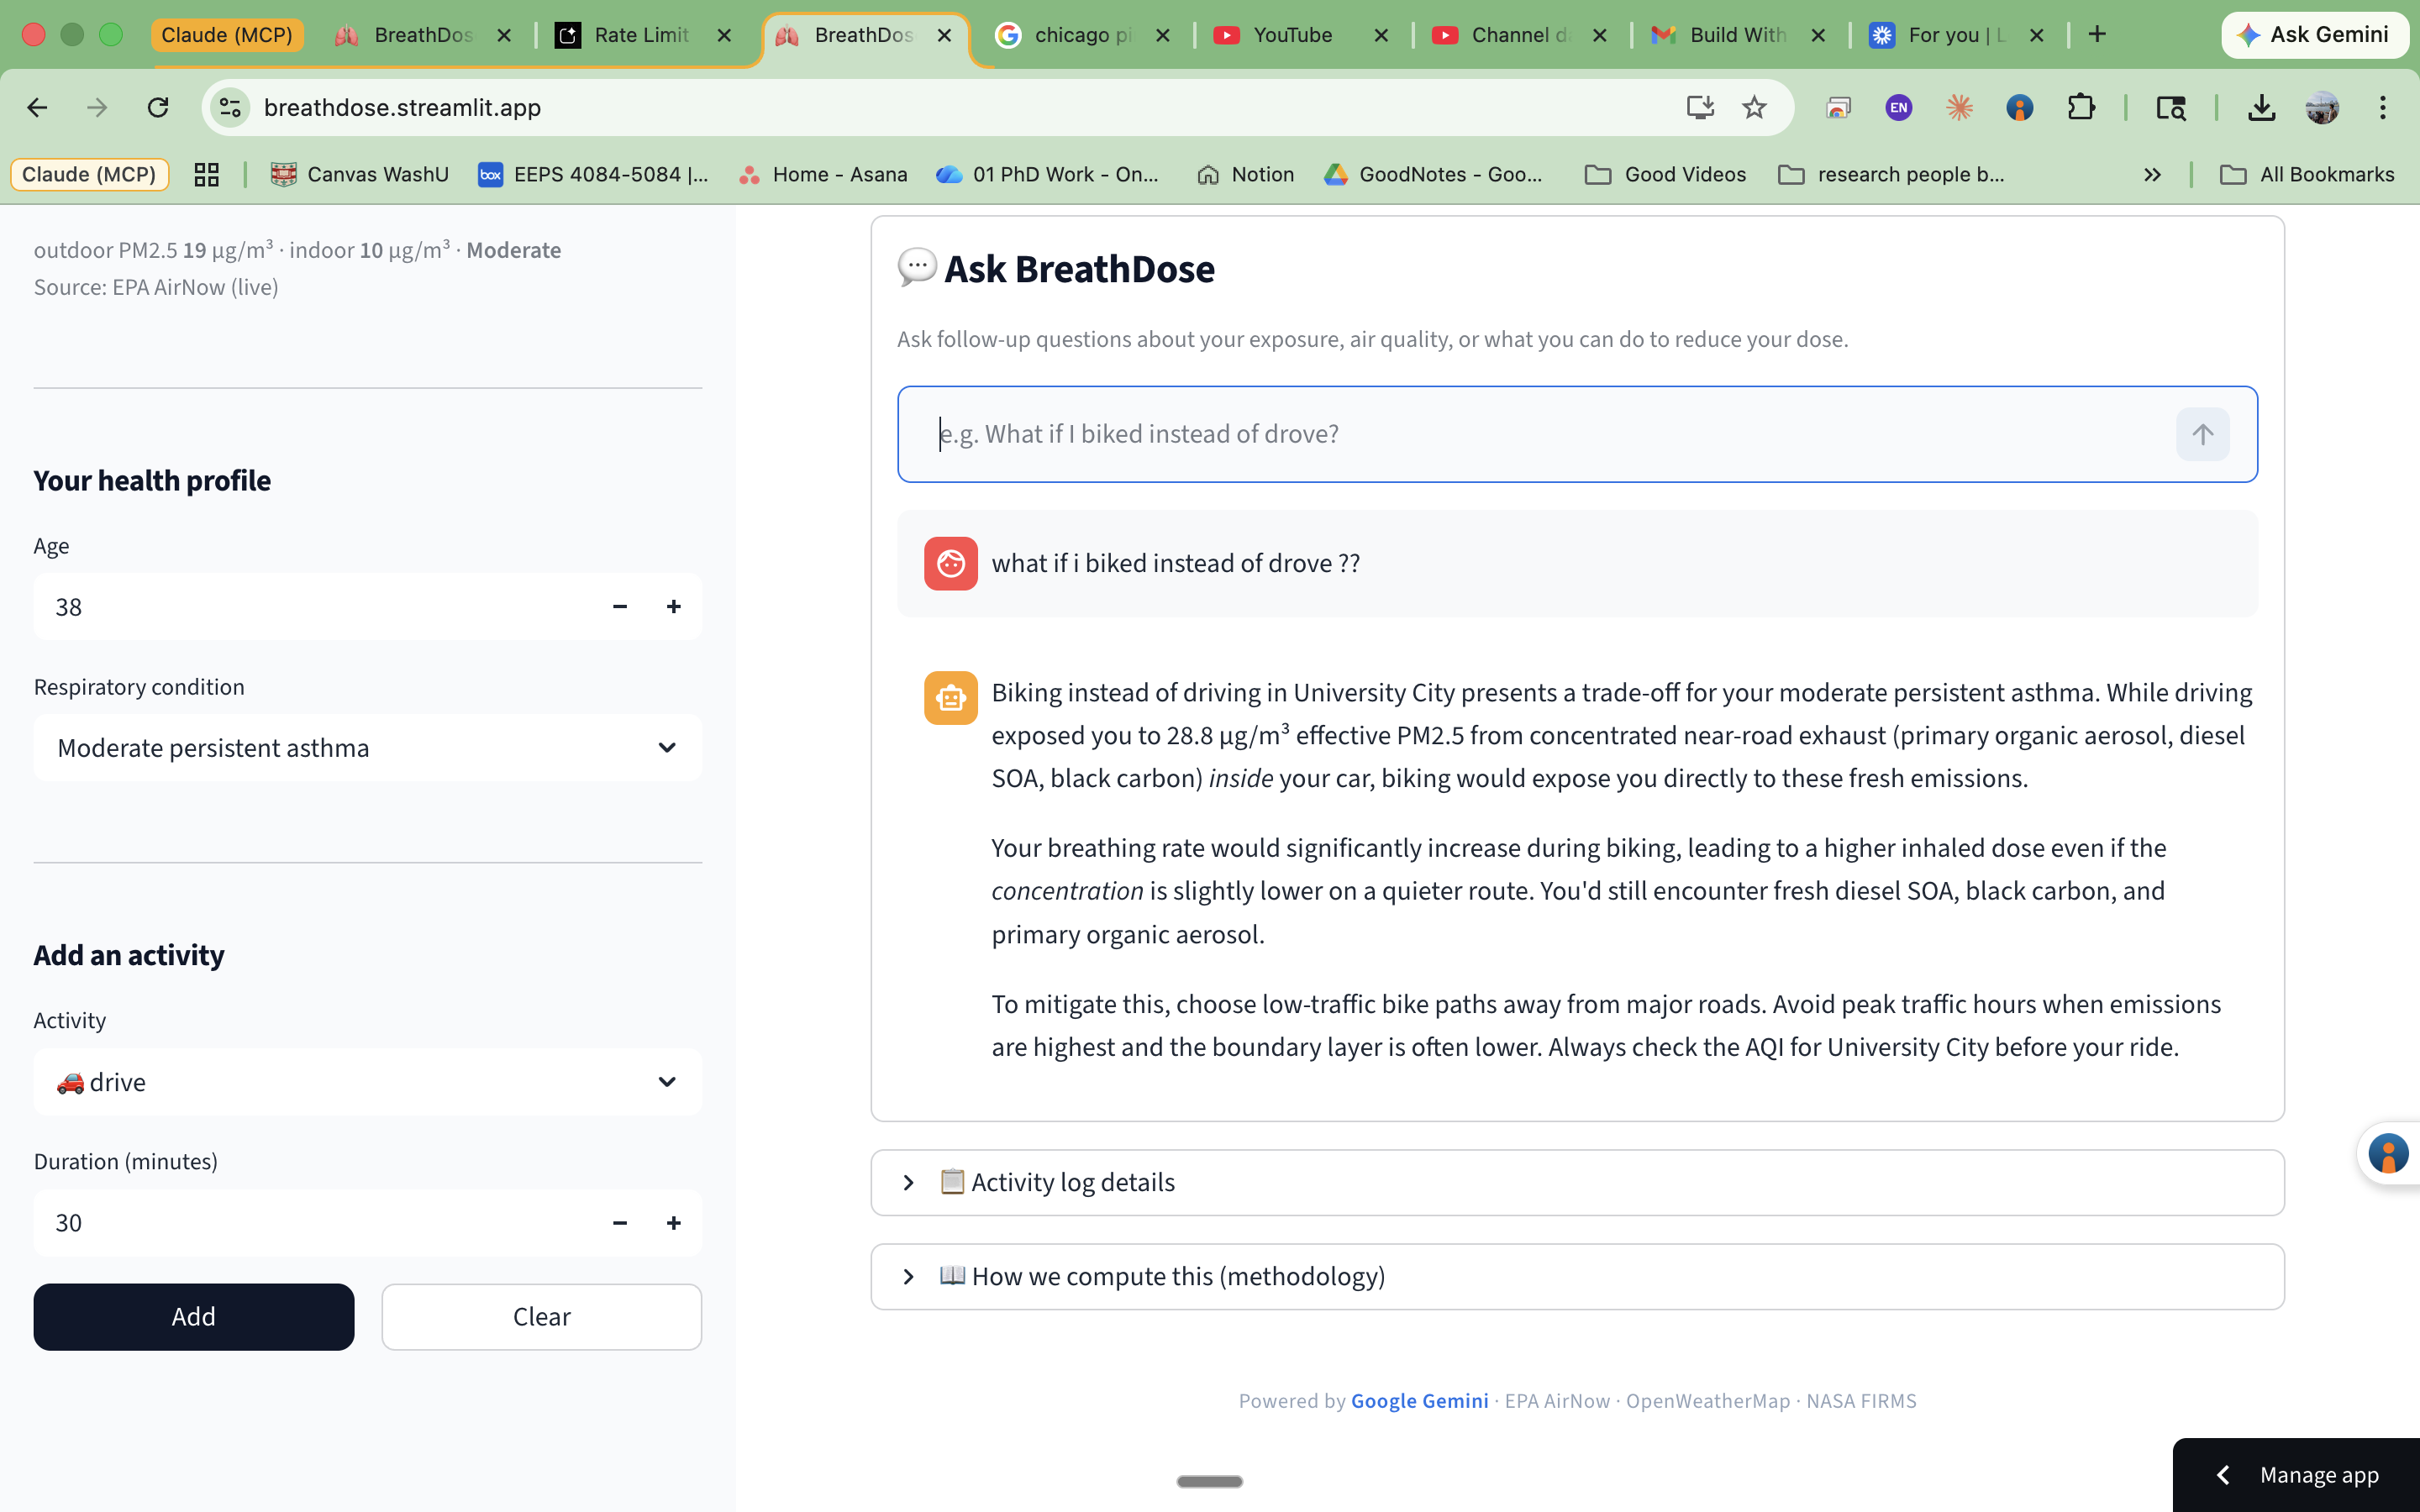
03_chat_feature
-

04_different_city

Inspiration
I'm a PhD student at Washington University in St. Louis studying the chemistry of organic aerosol — the actual molecules inside PM2.5 particles. Every air quality app shows you today's AQI number, but none of them answer the question that actually matters: how much did I inhale today?
None adjust for your activity level. None distinguish diesel exhaust from cooking aerosol from
wildfire smoke — even though those three have very different health effects per microgram. Air
pollution kills ~100,000 Americans every year, and St. Louis received an F grade for ozone
from the American Lung Association's 2025 State of the Air report (21st worst nationally).
I built BreathDose to make invisible exposure visible.
What it does
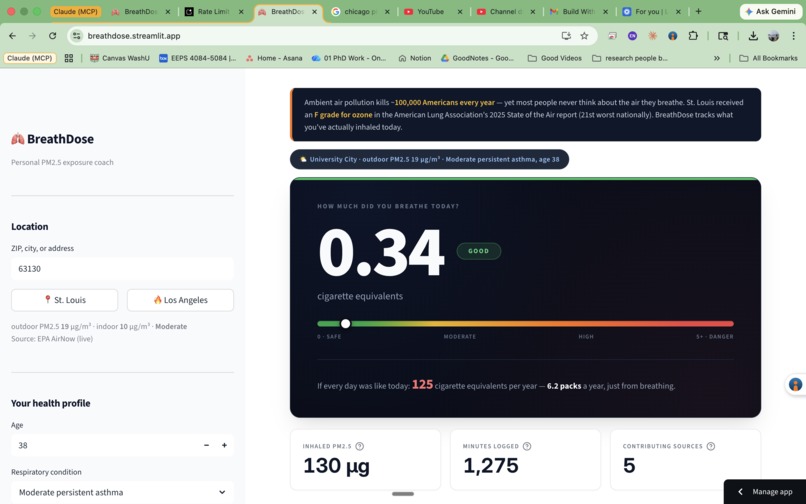
BreathDose is a personal PM2.5 exposure dosimeter. You enter any US location, log your day's
activities (commute, cooking, walking, sleep), and it calculates exactly how many micrograms of
fine particles entered your lungs — then converts it to cigarette equivalents using the
Berkeley Earth conversion:
$$\text{1 cigarette} \approx 22\;\mu g/m^3 \times 24\;\text{hours} \approx 380\;\mu
g\;\text{inhaled PM2.5}$$
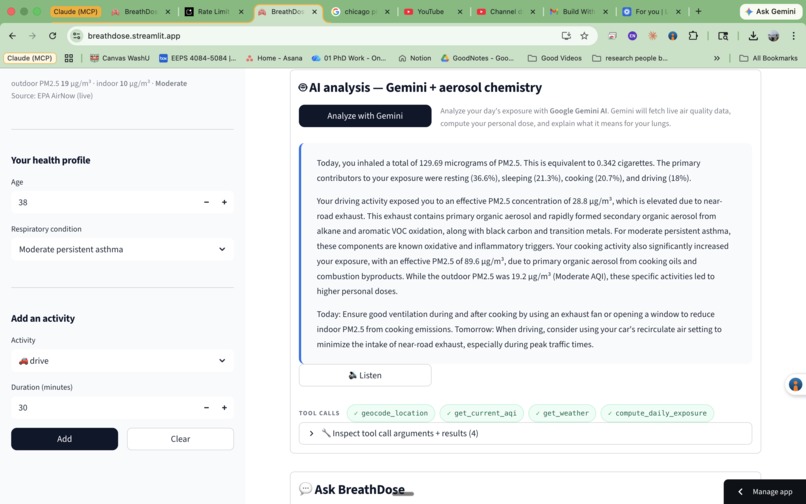
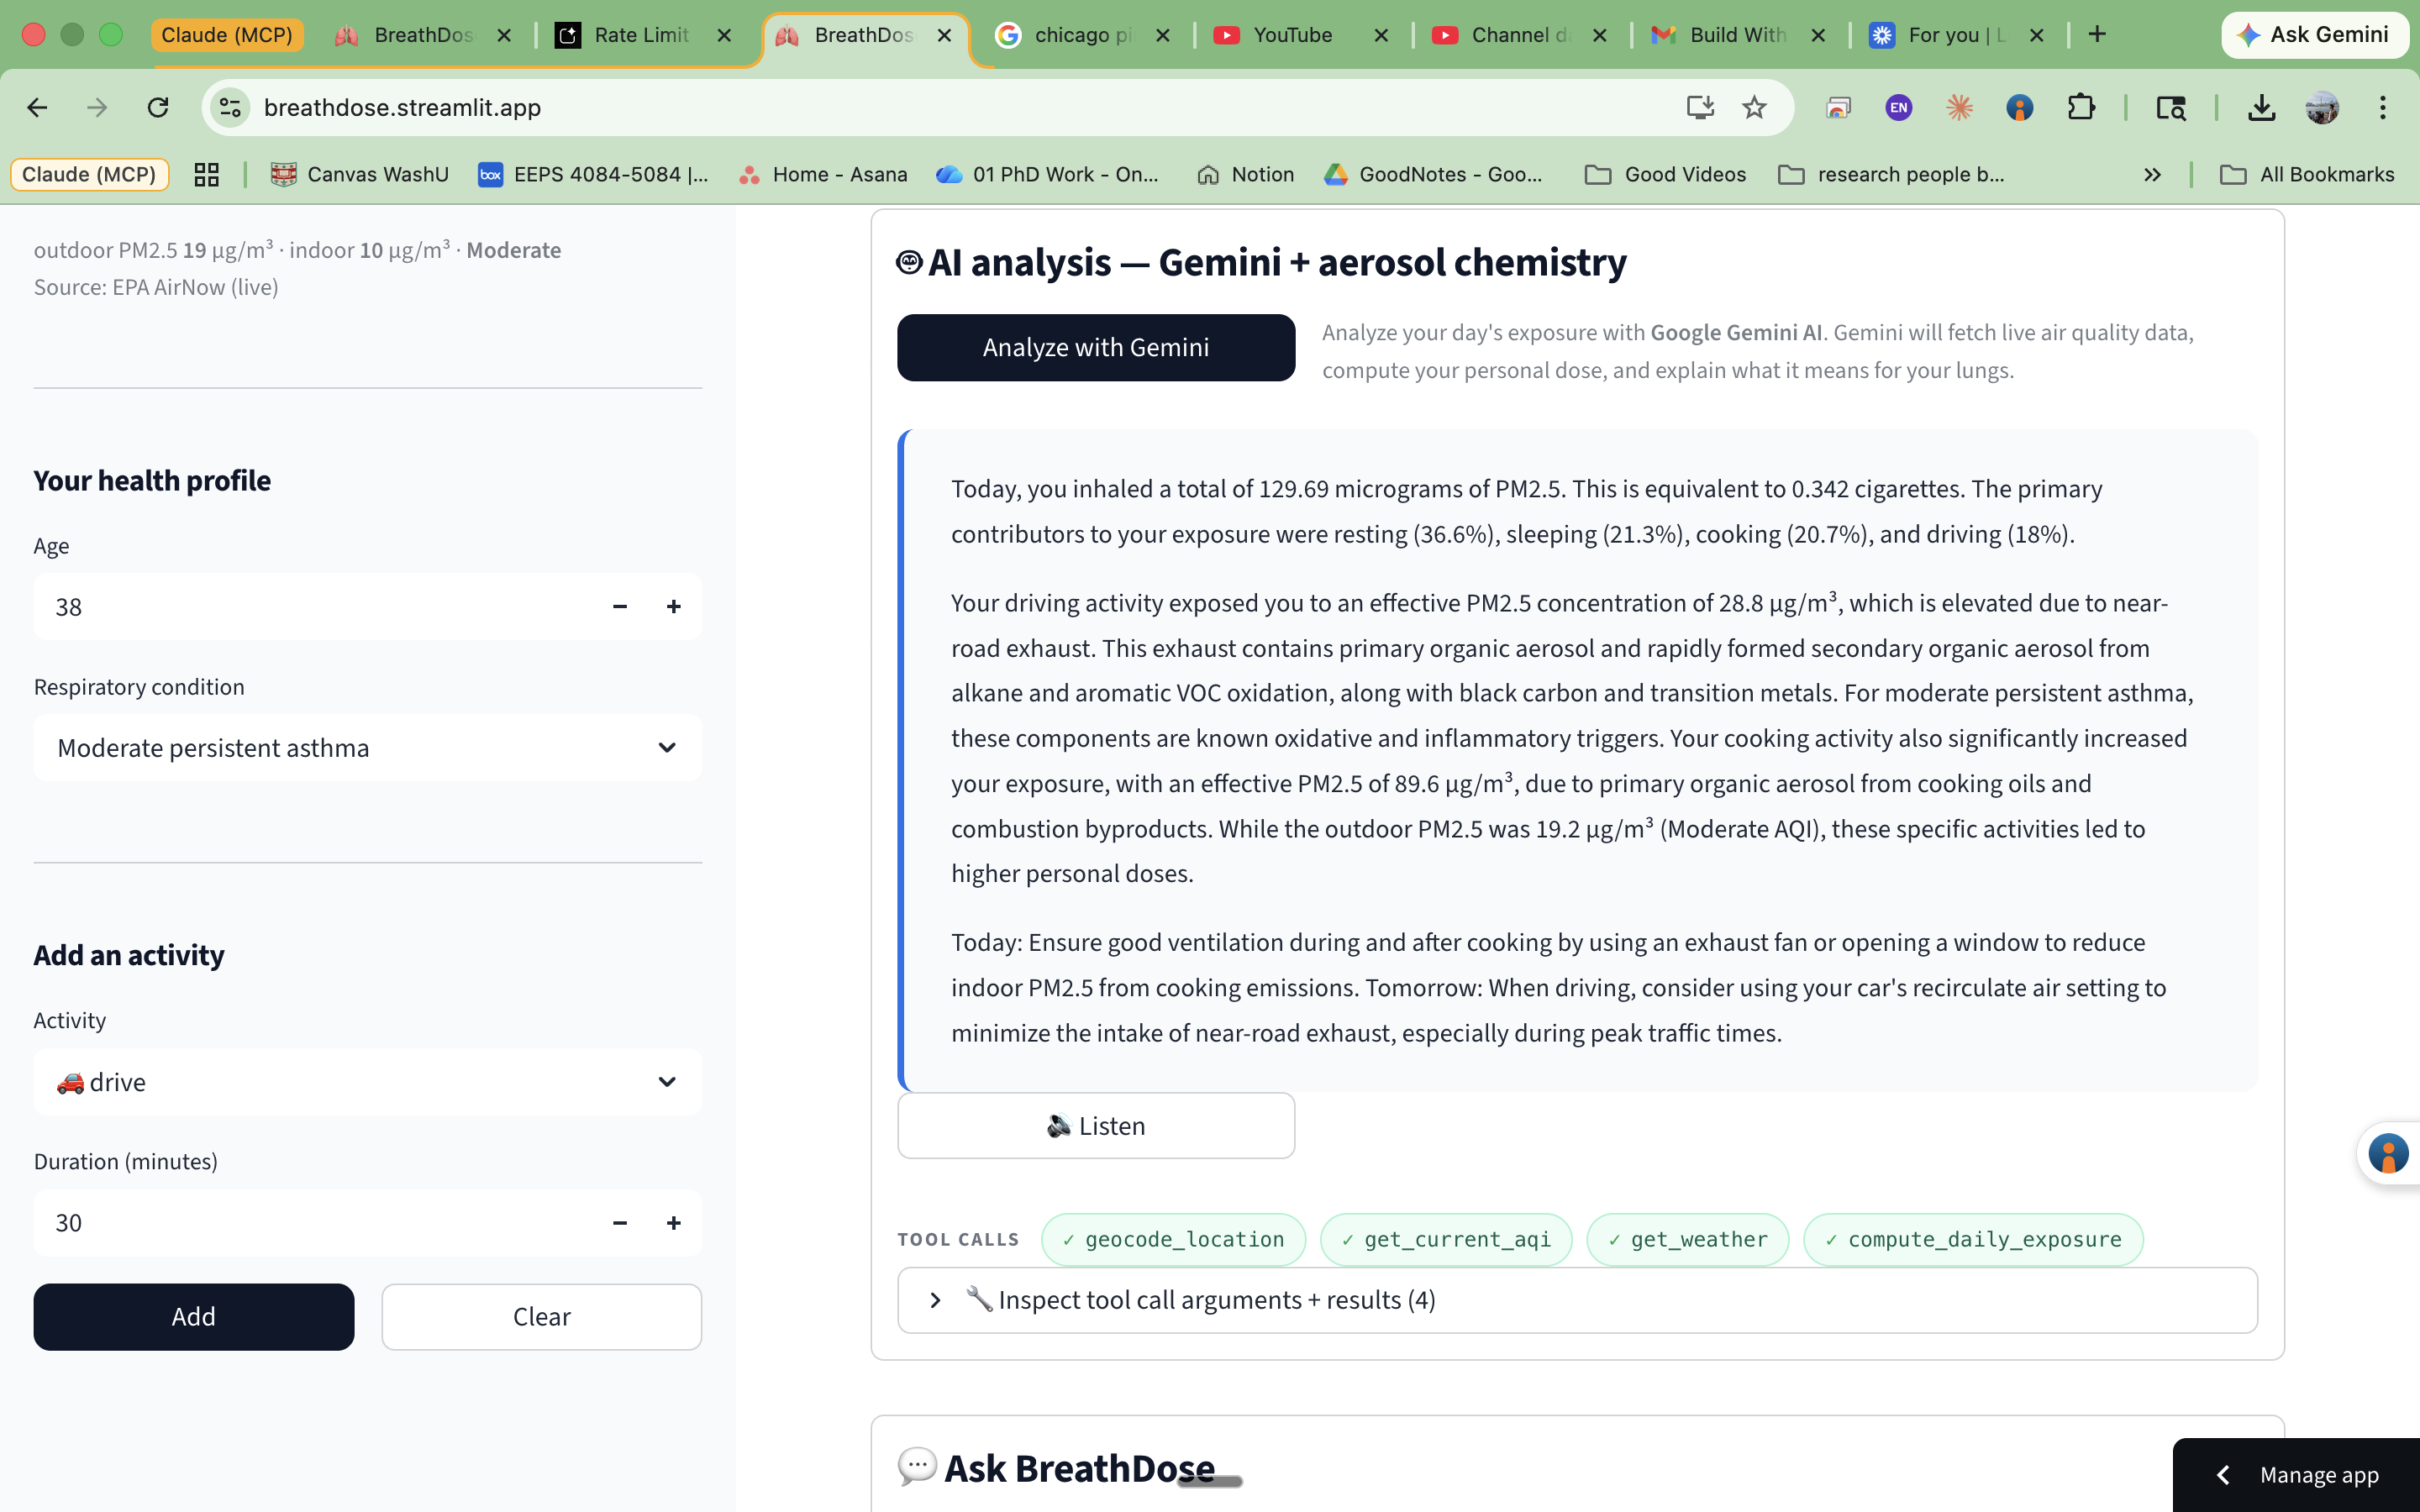
A Google Gemini agent fetches live data from 4 APIs, computes your personal dose, and
generates a chemistry-aware narrative explaining what your exposure means for your specific health
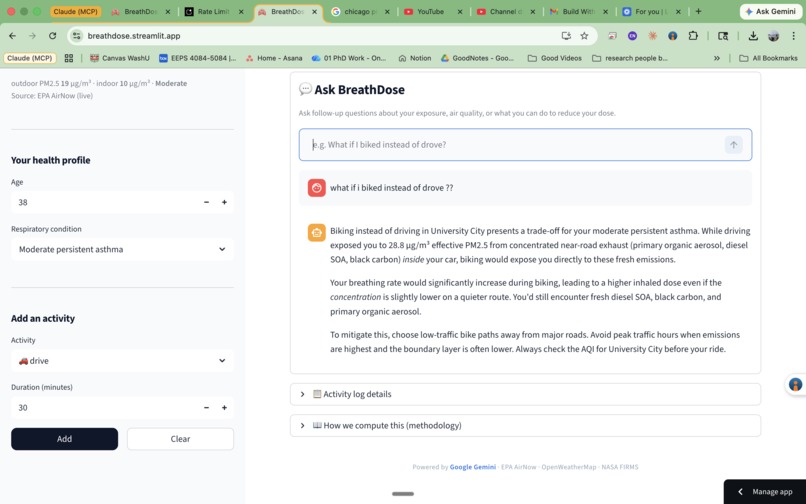
condition. You can also chat with BreathDose to ask follow-up questions like "what if I
biked instead of drove?"
A typical day in St. Louis ≈ 0.3 cigarettes → ~100 cigarettes per year, just from breathing.
How we built it
- UI: Python + Streamlit with custom CSS (dark hero card, Inter typography, Altair charts with inline percentage labels)
- AI Agent: Google Gemini 2.5 Flash with a manual tool-calling loop for full observability.
The agent orchestrates 4 tools:
geocode_location— OpenWeatherMap geocoding (ZIP + city support)get_current_aqi— EPA AirNow live PM2.5 concentrationget_weather— wind, temperature, visibility for smoke transport reasoningcompute_daily_exposure— custom physics engine using EPA Exposure Factors Handbook breathing rates
- Conversational Chat: A separate Gemini-powered chat interface, pre-seeded with the user's
exposure data for personalized follow-up Q&A - Voice: ElevenLabs TTS narration of the AI analysis
- Resilience: 3-model fallback chain (Gemini 2.5 Flash → 2.5 Flash Lite → 3 Flash Preview) so
the demo never fails. Every API call has graceful fallback to preset data.
- Deployment: Streamlit Cloud at breathdose.streamlit.app
The science behind it
The Gemini system prompt encodes real atmospheric chemistry that generic air quality apps lack:
- Diesel / near-road PM2.5 is dominated by primary OA + rapidly formed SOA from alkane and
aromatic VOC oxidation, plus black carbon, PAHs, and transition metals. In-cabin concentrations are 1.2–2.0× outdoor. This mix is a strong asthma trigger. - Gas-stove cooking contributes primary OA with kitchen PM2.5 bumps of 50–120 µg/m³ during
active cooking — rapidly accumulating indoor dose.
- Aged wildfire smoke is progressively oxidized into oxygenated OA (OOA). Aged biomass OA is
MORE oxidatively potent per µg/m³ than fresh smoke, even though visibility improves.
- Boundary-layer inversions (common in the Mississippi River valley) trap surface emissions
overnight — so 8 AM commute exposure is worse than midday even when AQI looks similar.
Challenges we ran into
- Gemini capacity spikes: Gemini 2.5 Flash experienced intermittent 429 errors during peak
demand. Solved with a 3-model fallback chain that automatically tries alternative models. - AirNow timeouts: EPA AirNow API occasionally takes >12 seconds. Every API call wraps with
graceful fallback to preset data so the demo stays functional. - Streamlit widget state: Programmatically updating a
text_inputvalue after the widget renders crashes Streamlit. Solved with a pending-value pattern that applies changes before the
next render cycle. - Thinking token budget: Gemini 2.5 Flash uses thinking tokens that count against the output
limit, truncating chat responses. Fixed by increasingmax_output_tokensto 2048.
Accomplishments we're proud of
- The cigarette equivalent makes invisible air pollution tangible and memorable
- Gemini's narrative distinguishes between diesel SOA, cooking OA, and aged biomass smoke —
something no existing air quality app does
- The app works for any US location with live data, not just canned demo scenarios
- Conversational follow-up lets users ask "what if" questions about their exposure
- Built solo in 24 hours with a live, deployed URL
What we learned
- How to build a Gemini tool-calling agent with a manual loop for full observability
- How deep domain expertise (atmospheric chemistry PhD) translates into dramatically better AI
system prompts
- How to design API fallback strategies for resilience in live demo settings
- The power of a single memorable metric (cigarette equivalents) to make complex science
accessible
What's next for BreathDose
- Peak flow meter OCR using Gemini Vision — photograph your peak flow meter, correlate lung
function with cumulative exposure - Map visualization showing nearby fire detections and smoke transport
- Multi-day exposure history with trend charts
- Mobile-first version for the 500,000 asthma patients in the St. Louis metro


Log in or sign up for Devpost to join the conversation.