

🔬 Breast Cancer Insights – Easy FNA Analysis
Turn complex breast biopsy data into clear, visual insights that help doctors spot patterns of benign vs malignant tumors in seconds.
Check Plotly Cloud App
🩺 About This Project
This interactive app makes fine needle aspirate (FNA) data simple to understand and actionable.
Doctors can:
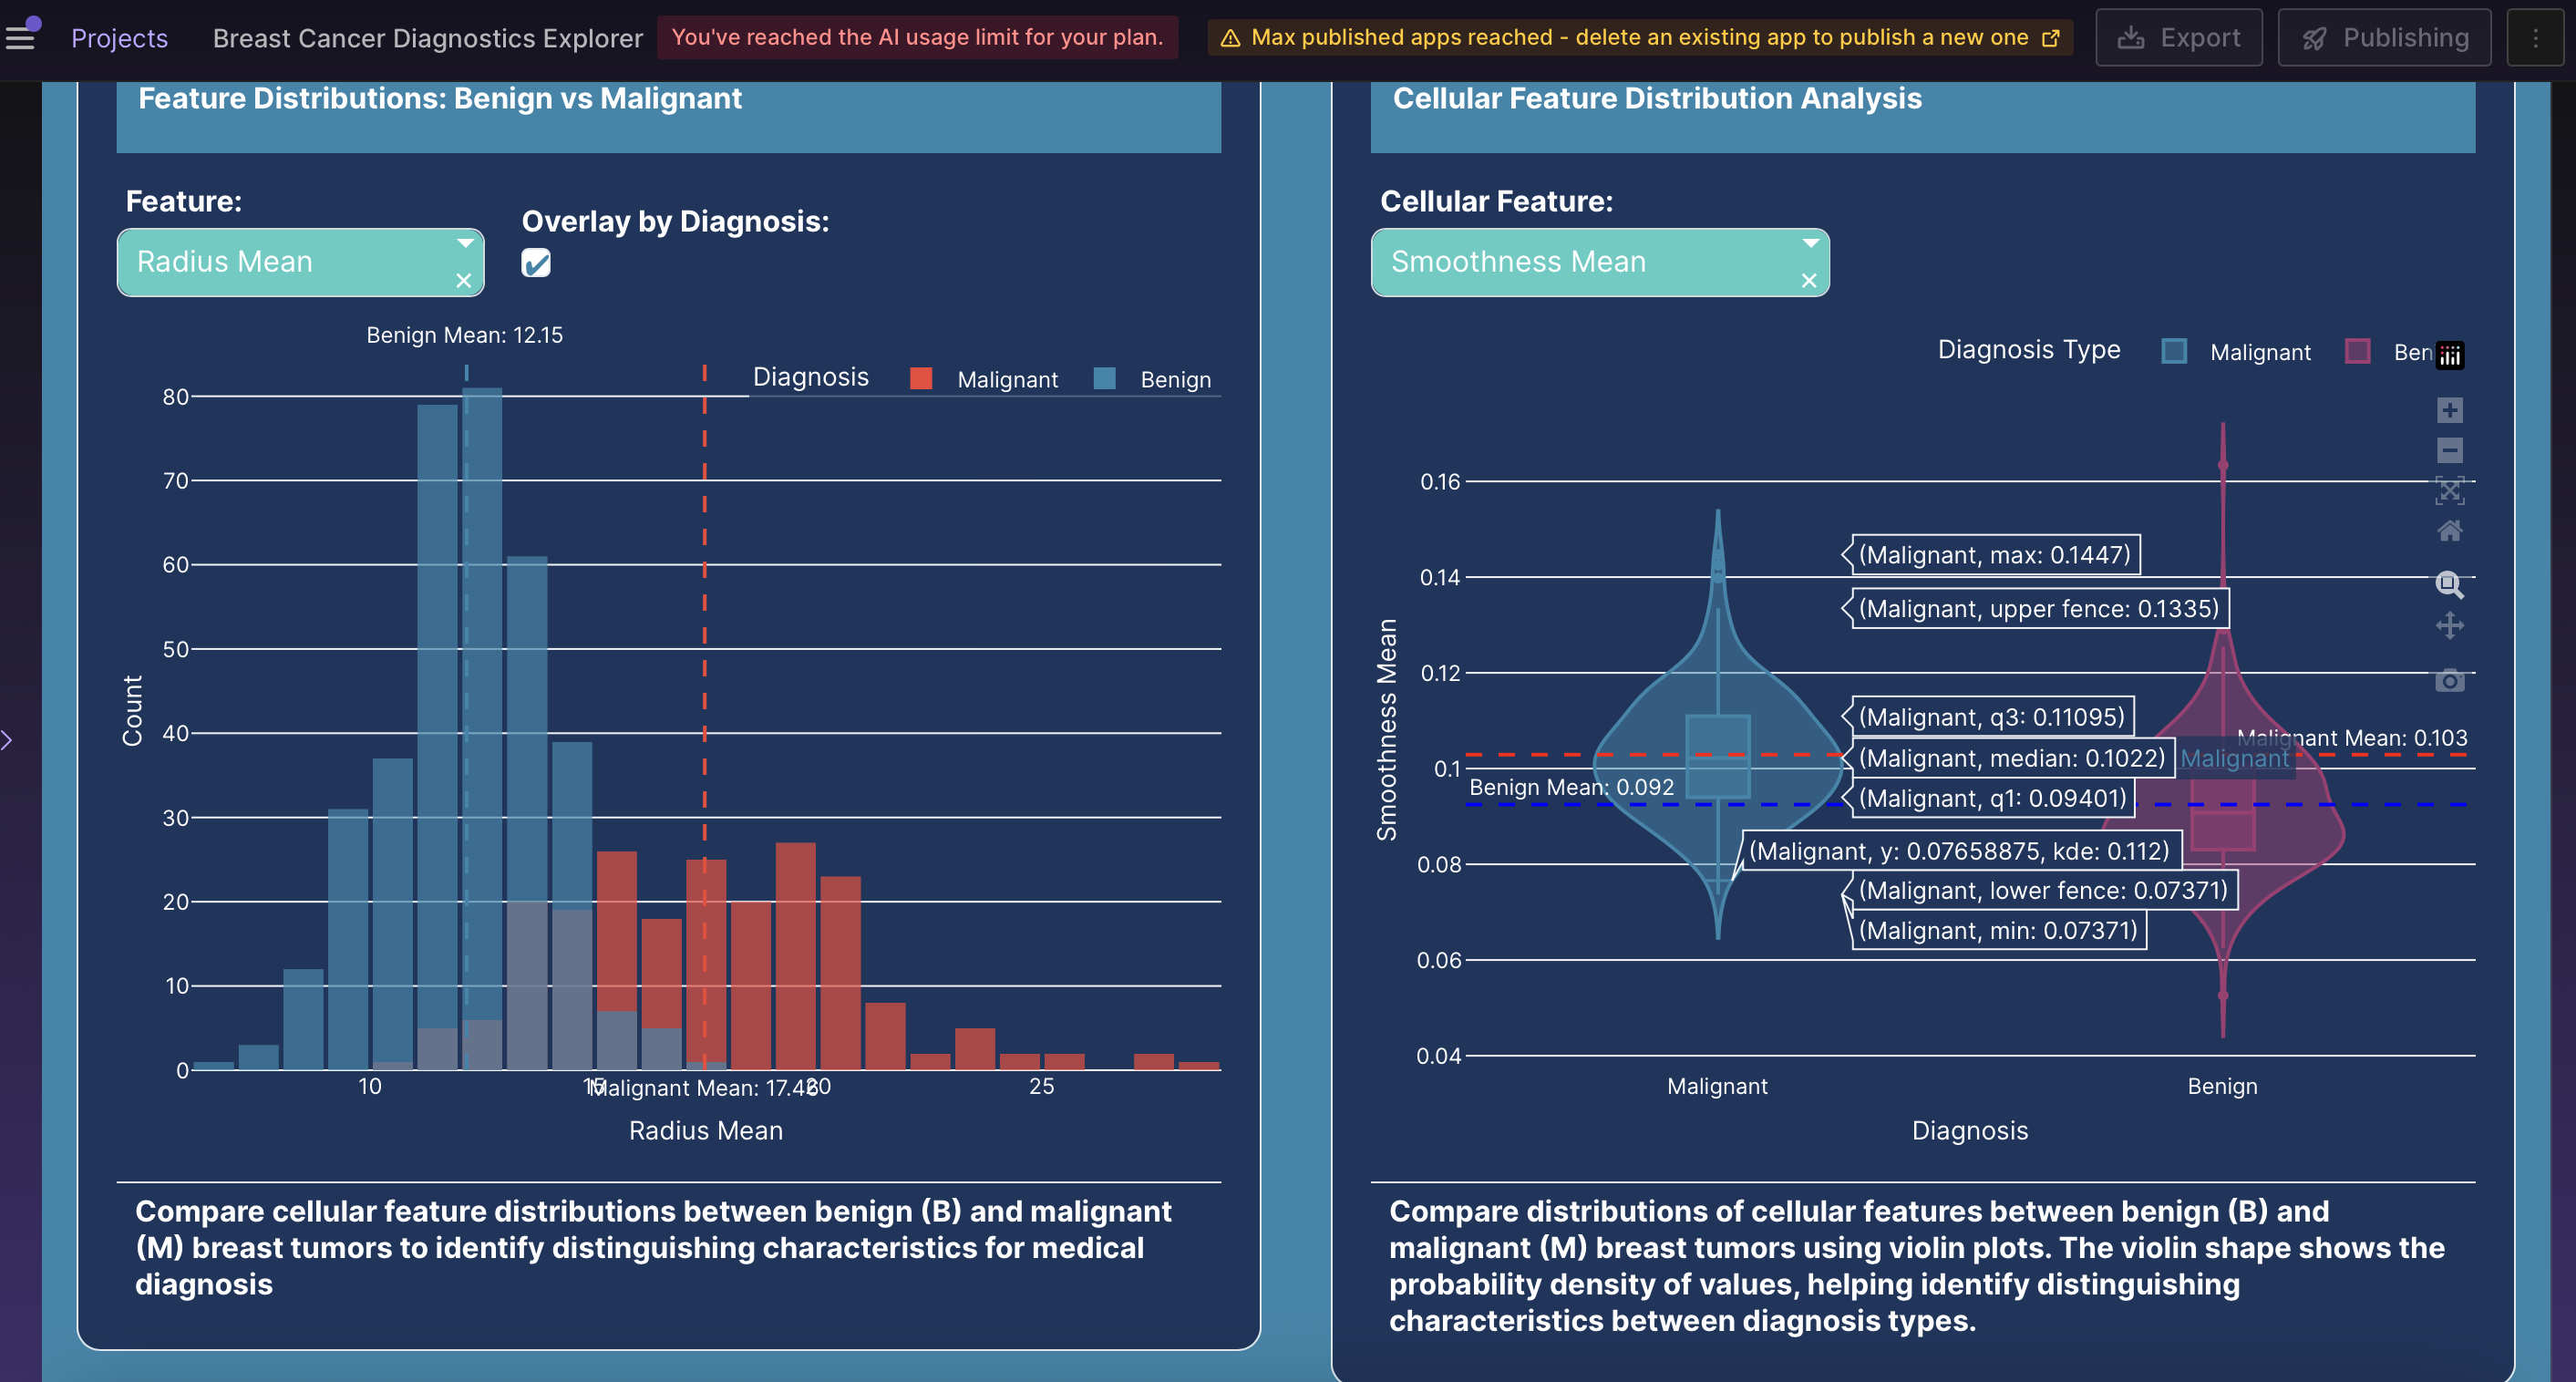
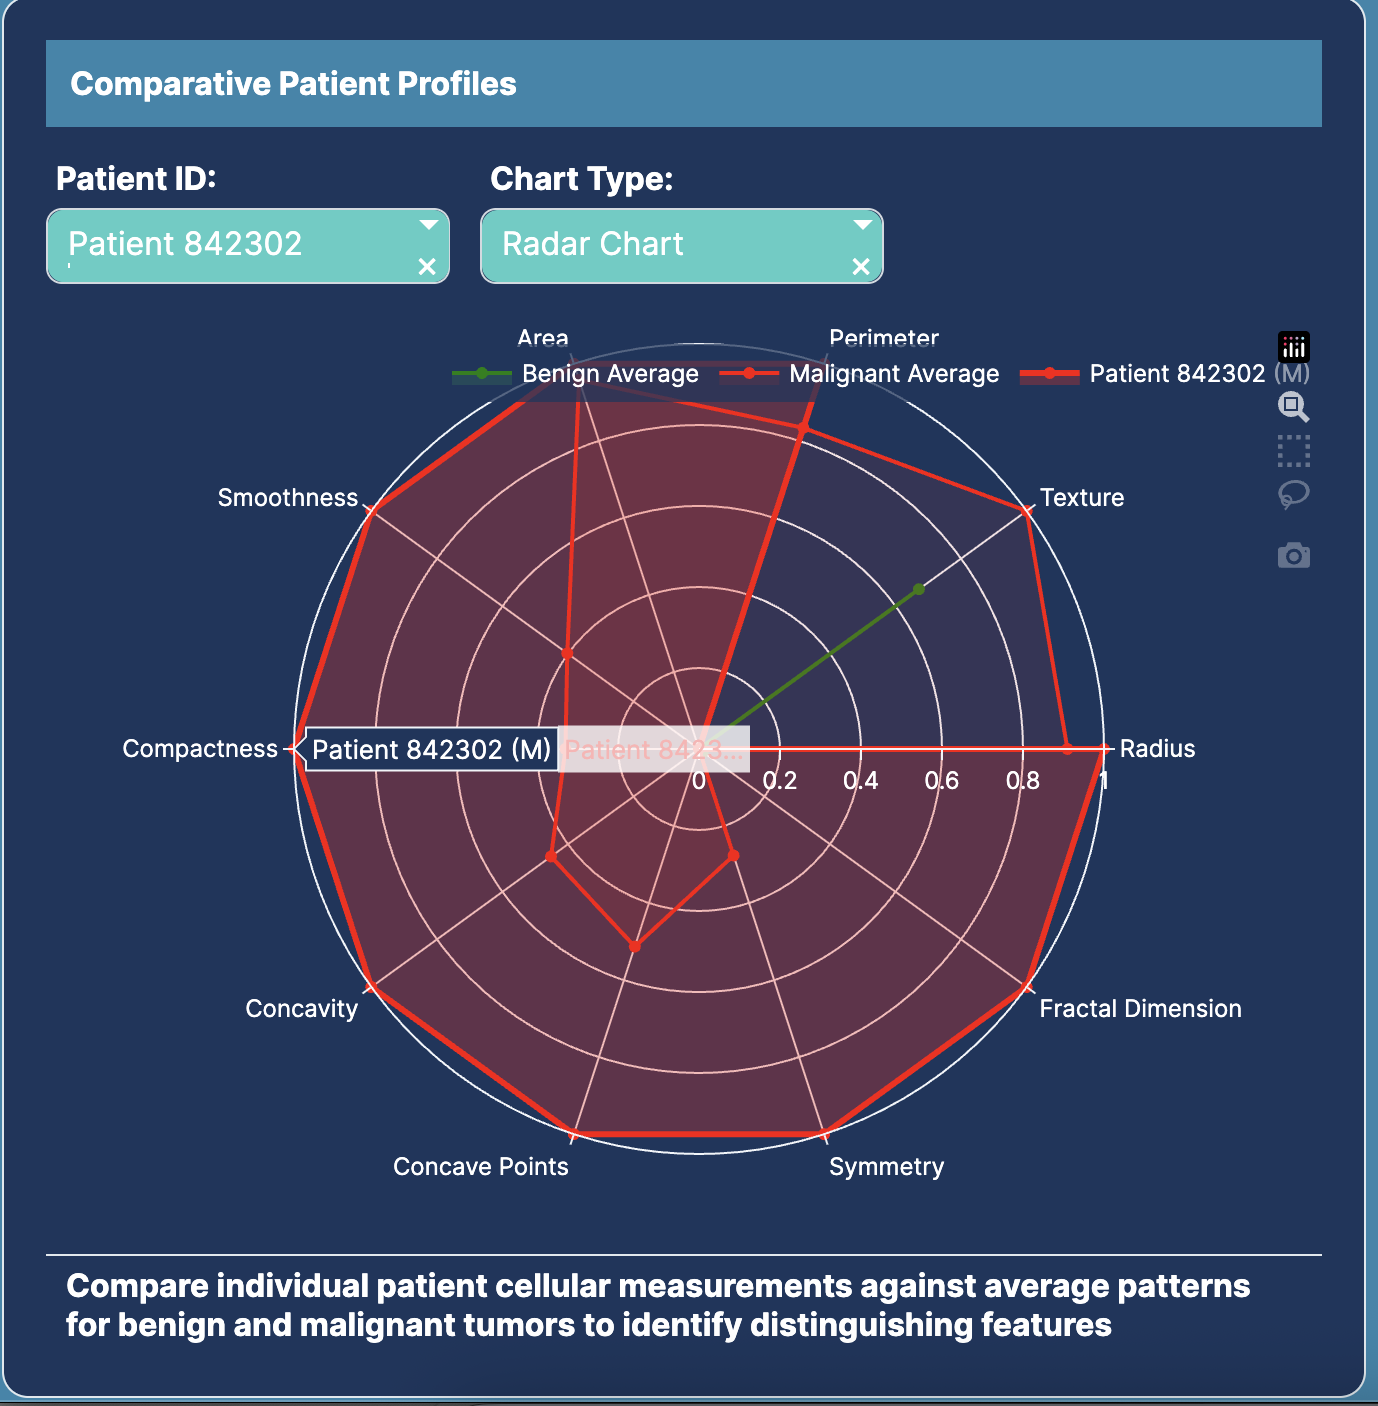
- 🔹 Explore how cell features like size, shape, smoothness, and texture differ between benign (safe) and malignant (cancerous) samples
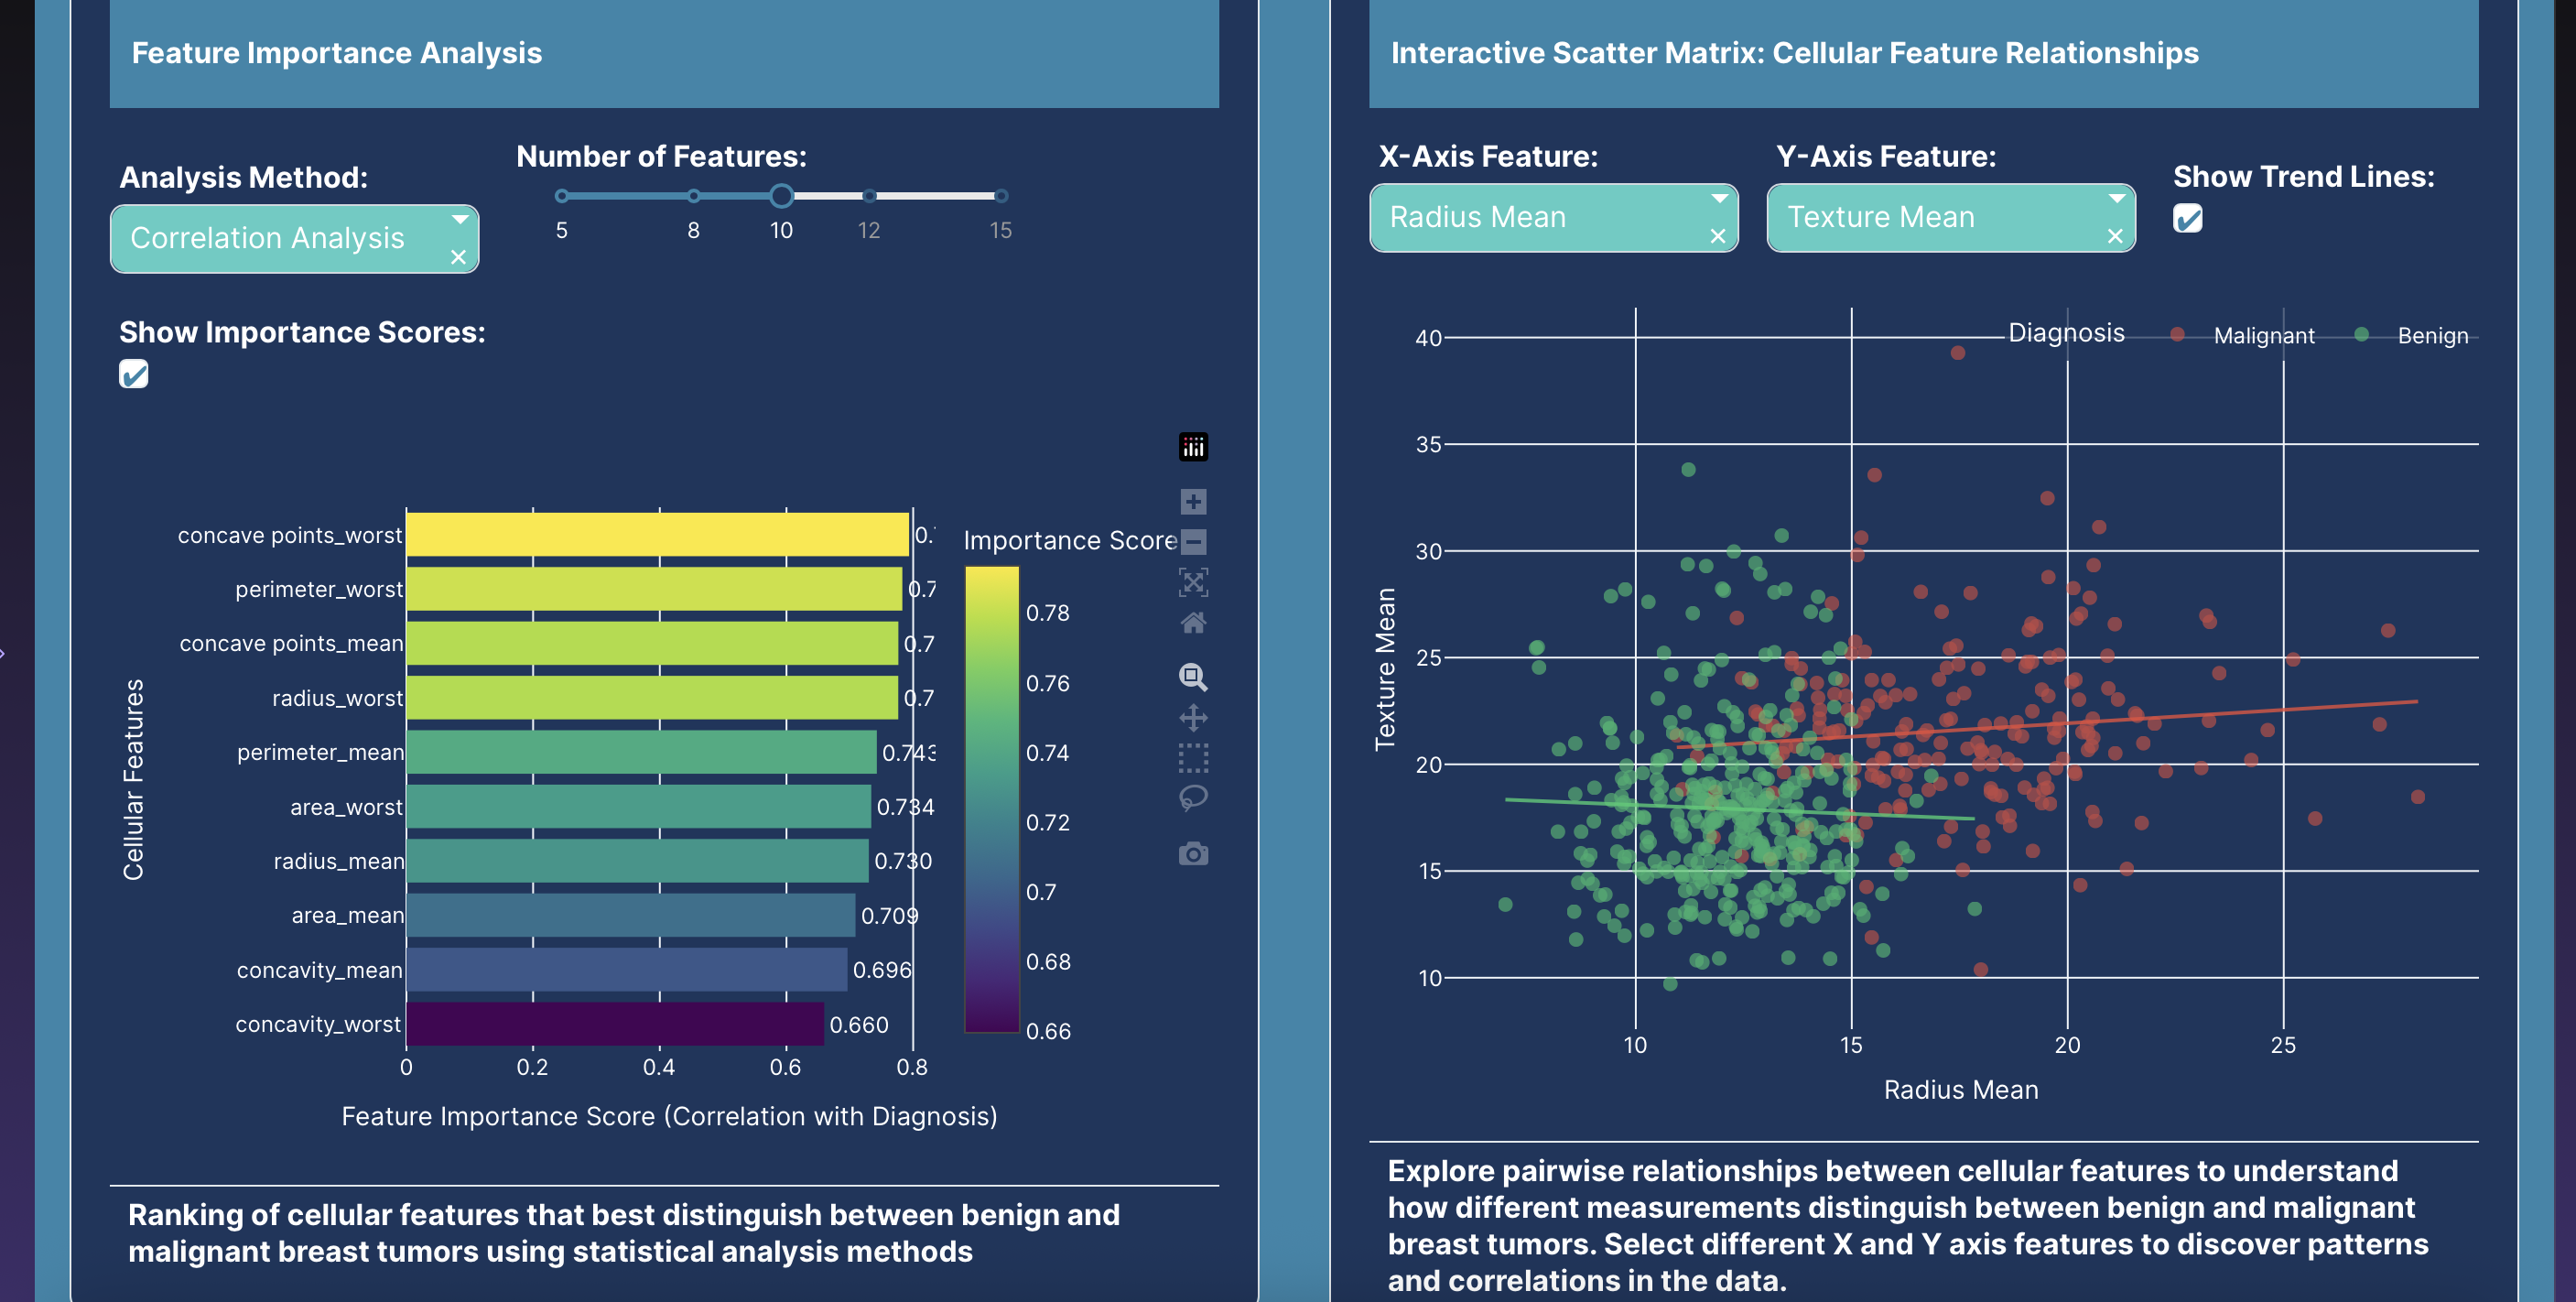
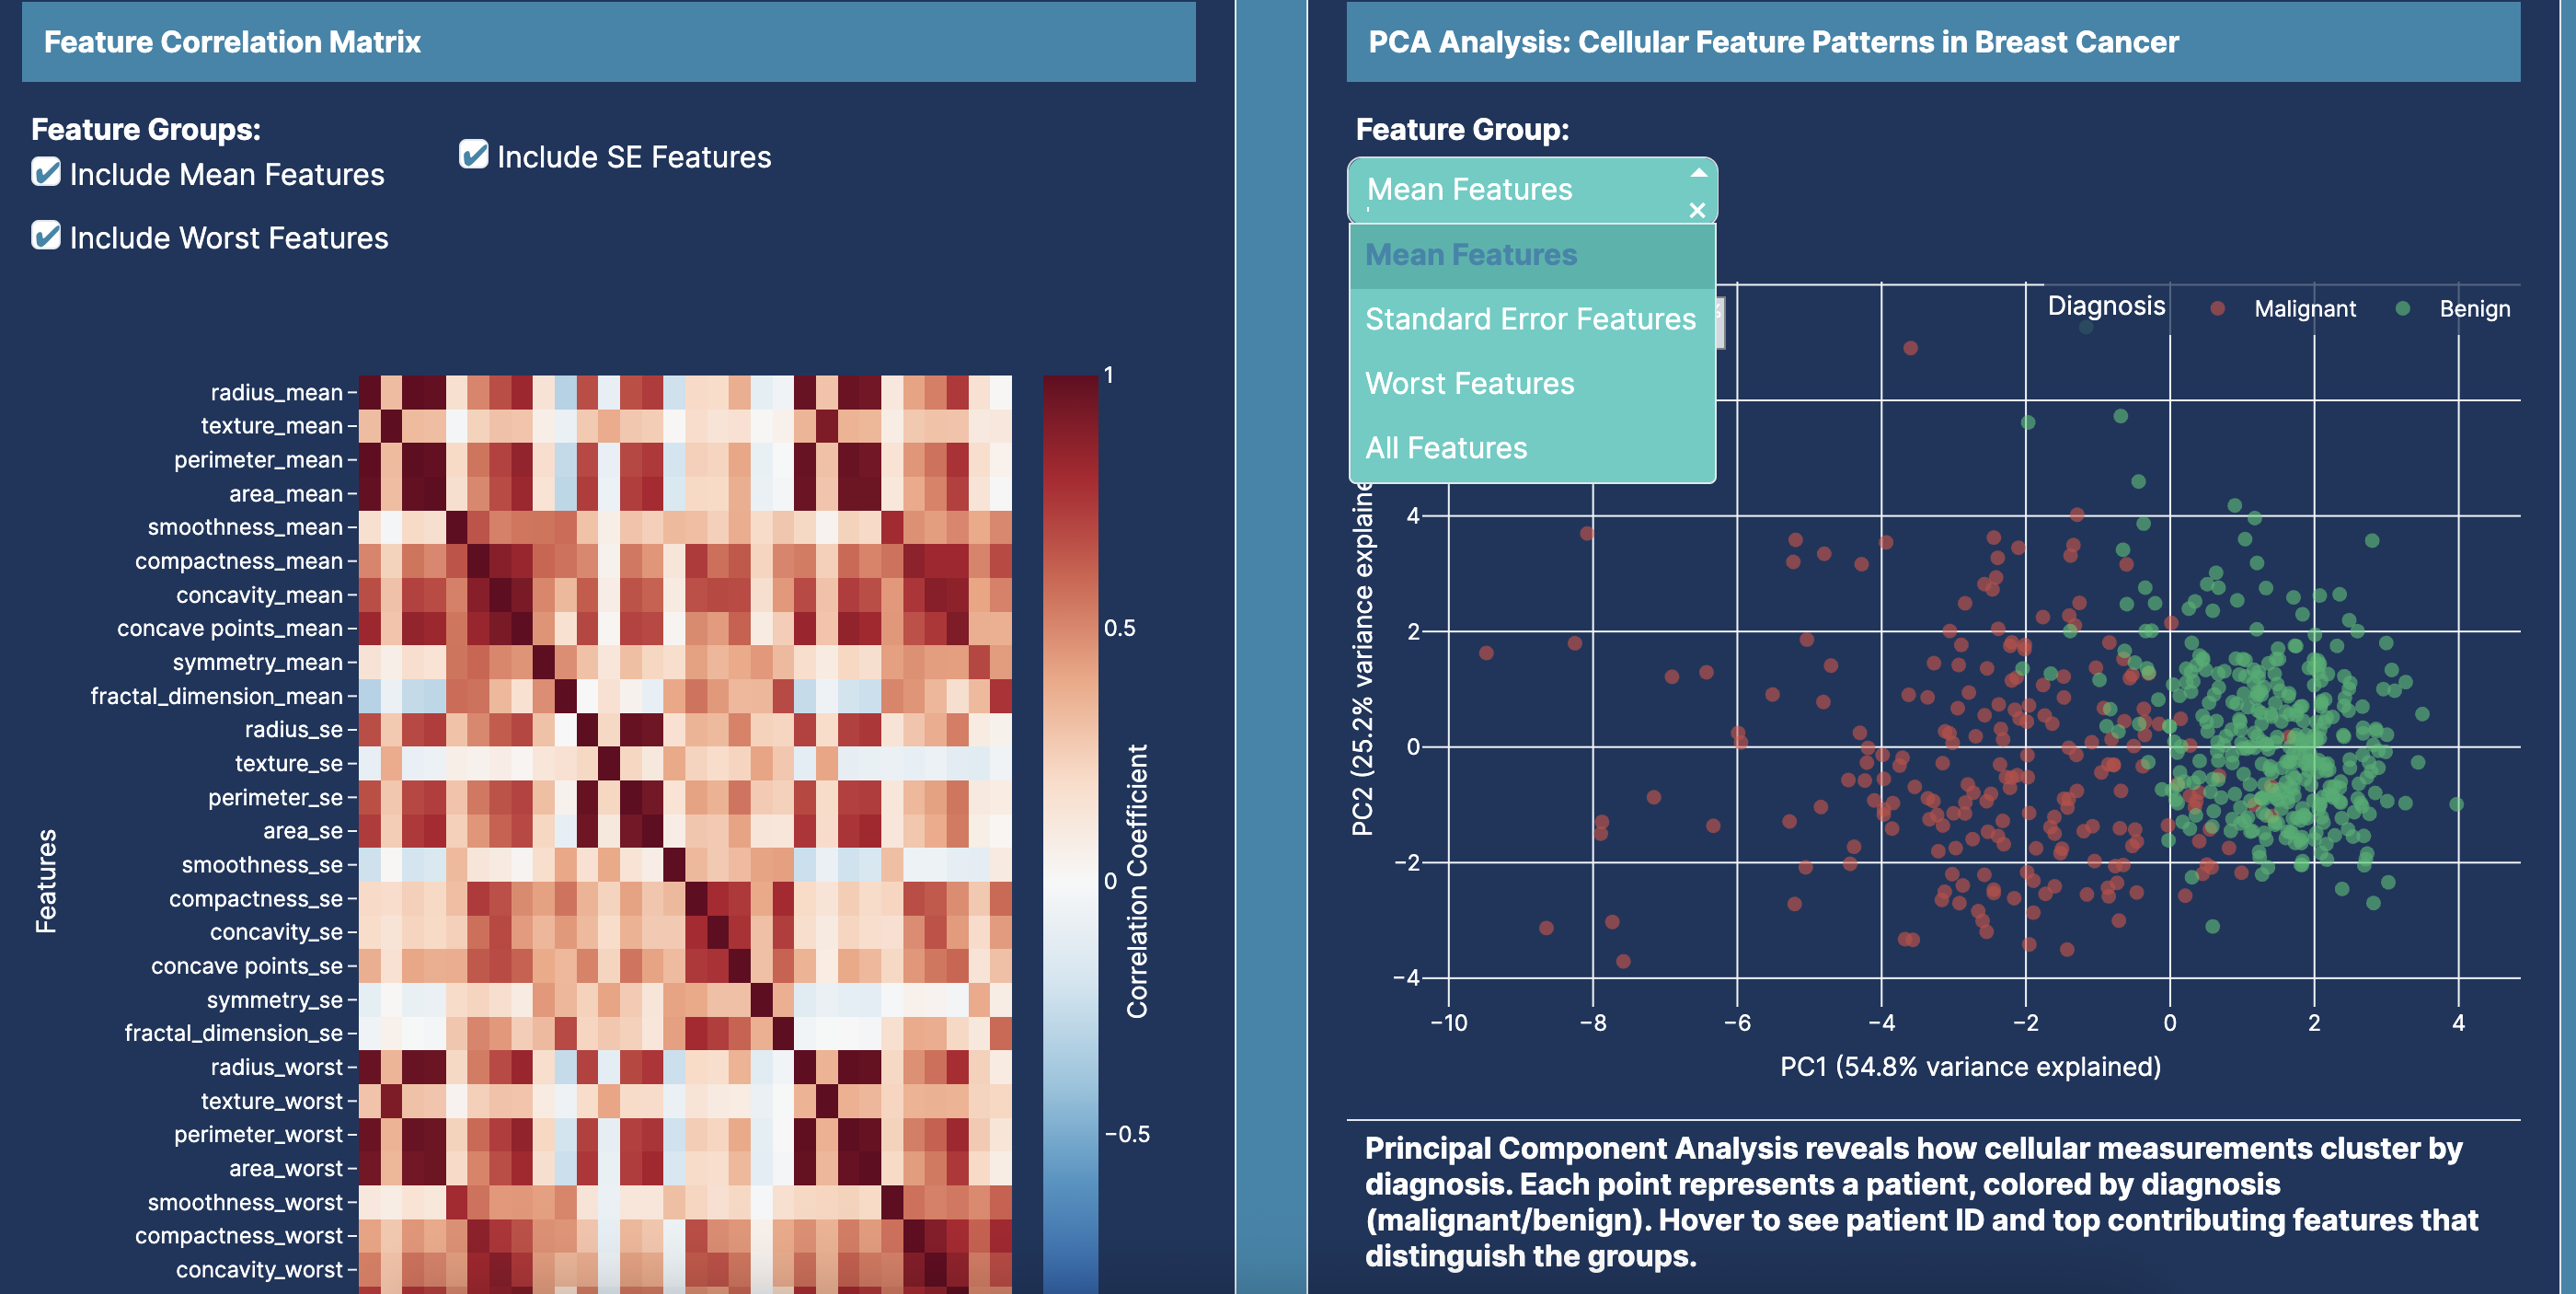
- 🔹 Visualize relationships between features to see which traits indicate cancer
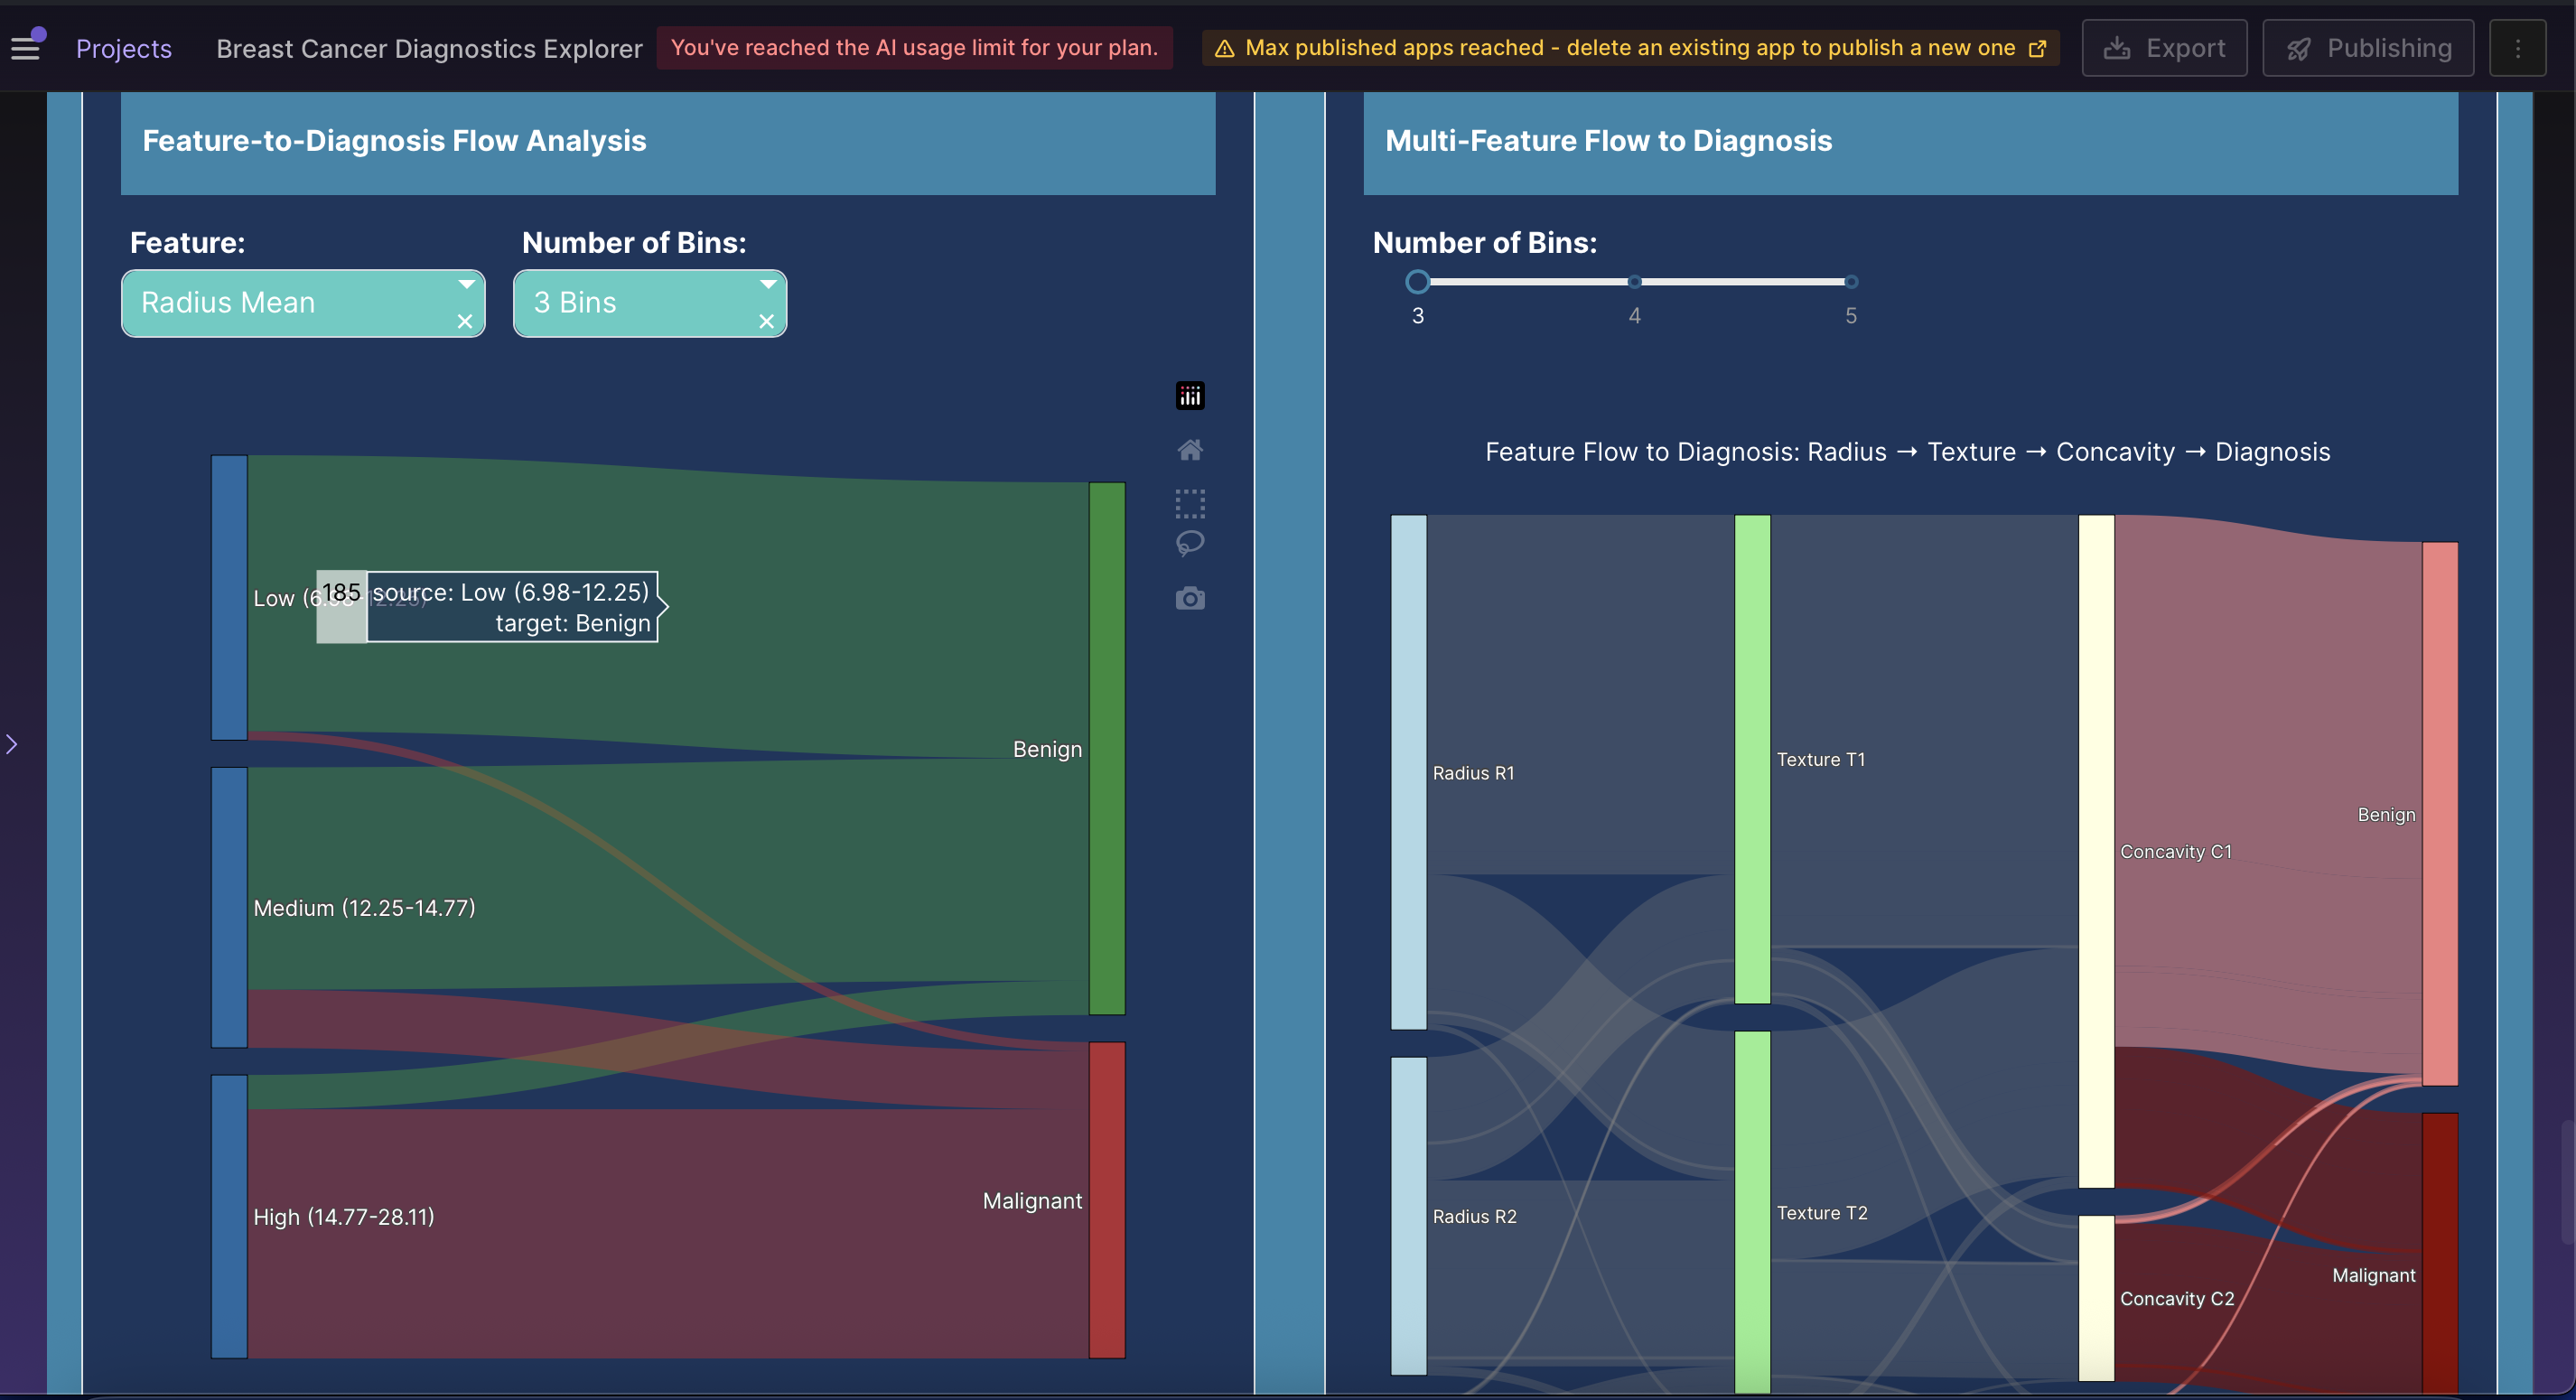
- 🔹 Track feature flows to diagnosis with Sankey diagrams
- 🔹 Check summary cards for key numbers at a glance
⚡ Why It Matters
- Transforms complex, multi-feature data into clear, actionable visuals
- Helps doctors identify risk patterns faster for quicker, informed decisions
- Highlights important indicators without manually sifting through hundreds of measurements
📊 What It Includes
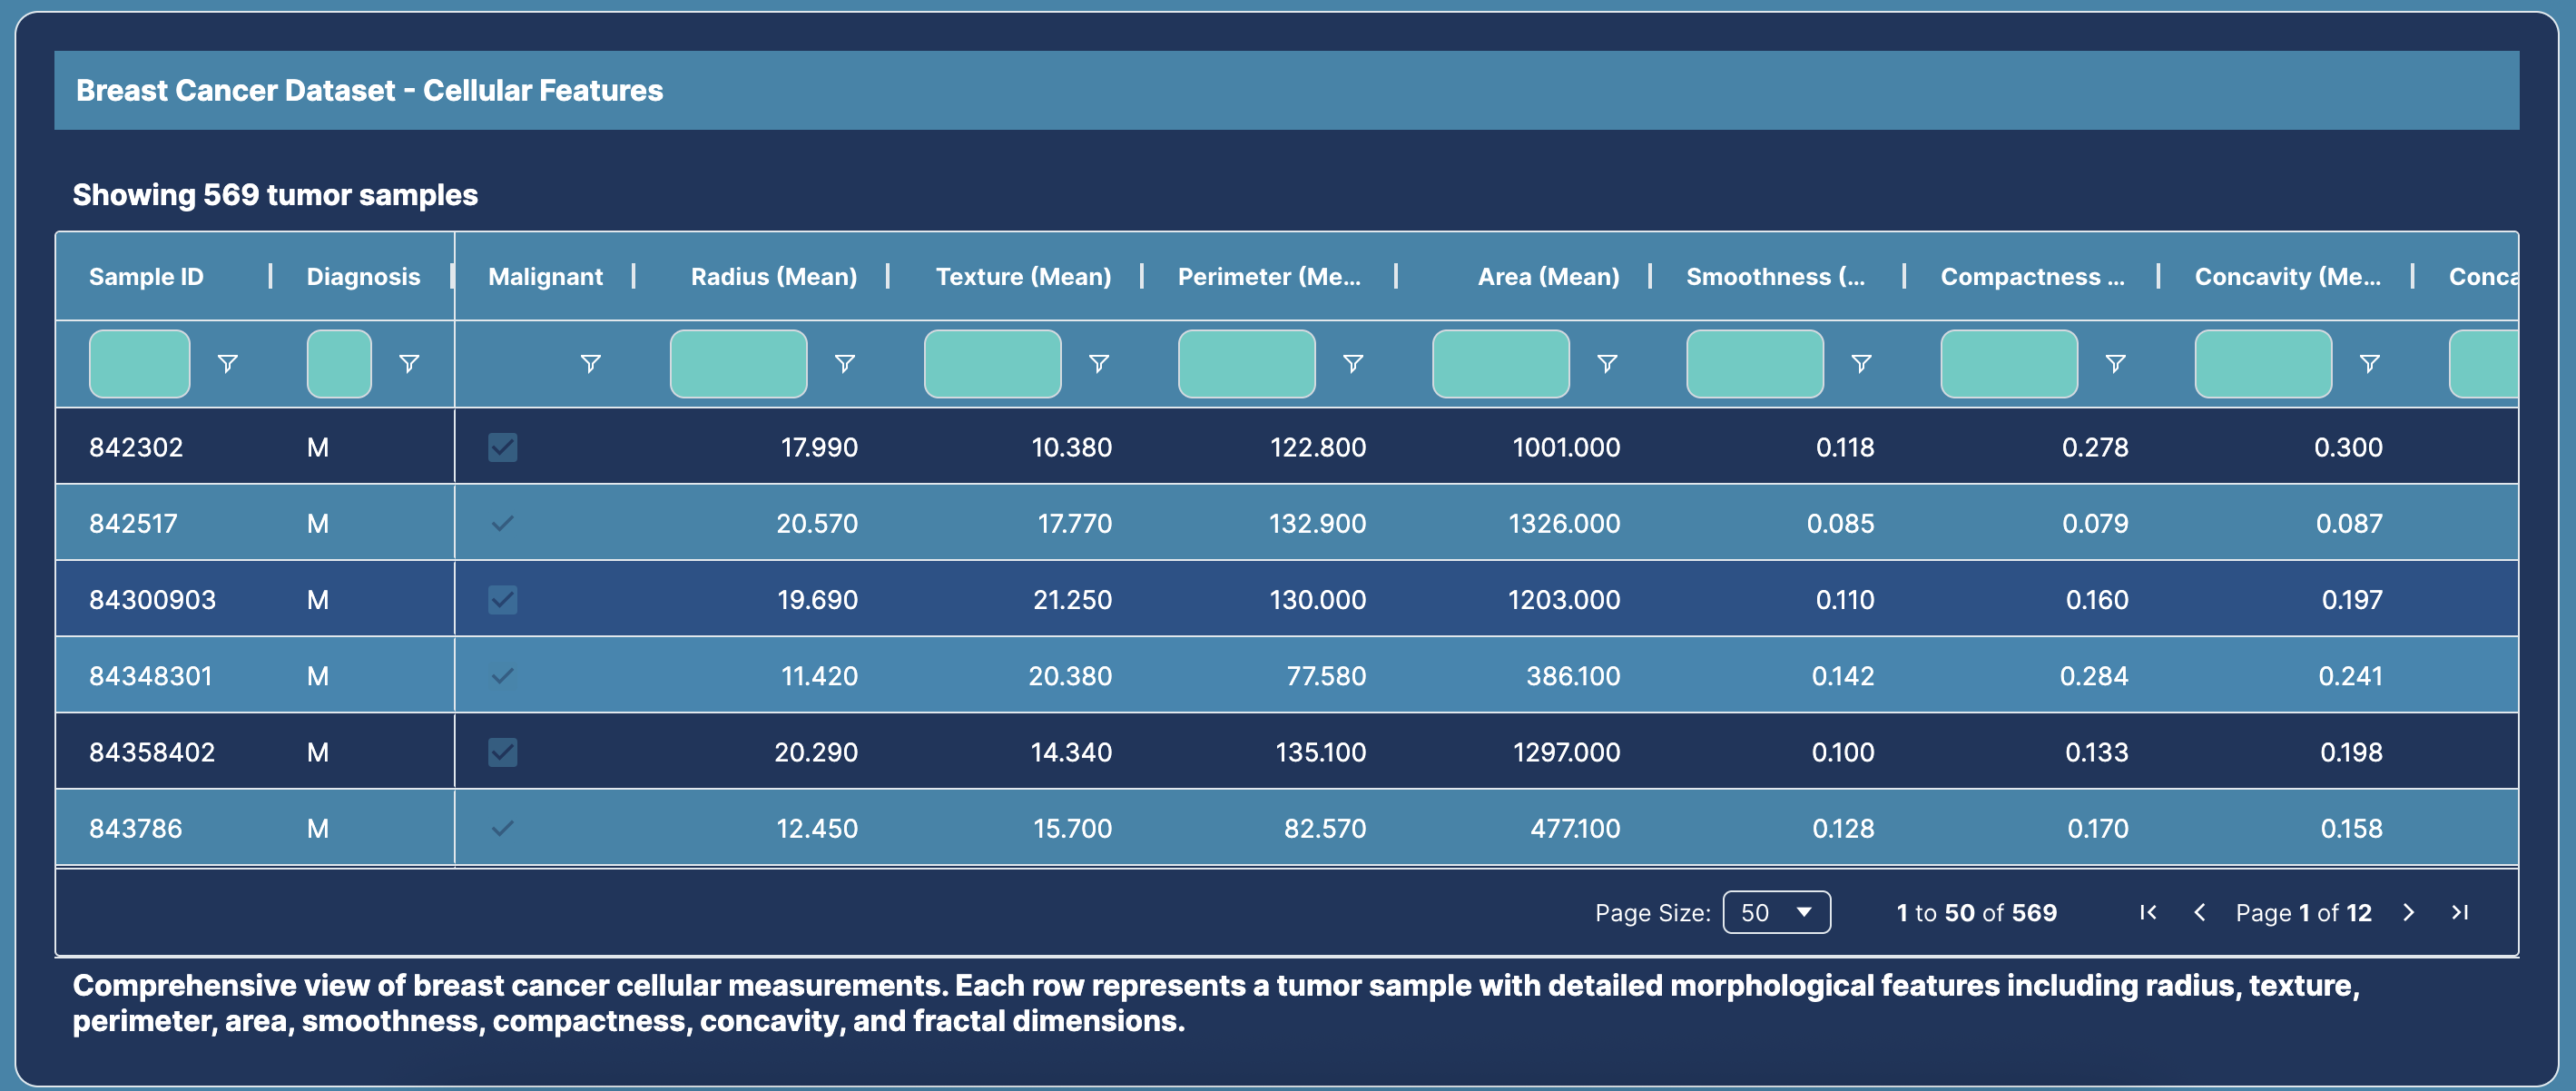
- 30 cell-level features per sample: radius, texture, perimeter, area, smoothness, compactness, concavity, concave points, symmetry, fractal dimension
- Labels: Benign (B) vs Malignant (M)
- Interactive charts: histograms, scatter plots, heatmaps, radar charts, and Sankey diagrams
- Summary cards for quick insights
💡 Outcome:
A simple, intuitive tool that turns raw biopsy data into stories, helping doctors make faster and better-informed decisions.


Log in or sign up for Devpost to join the conversation.