-
-

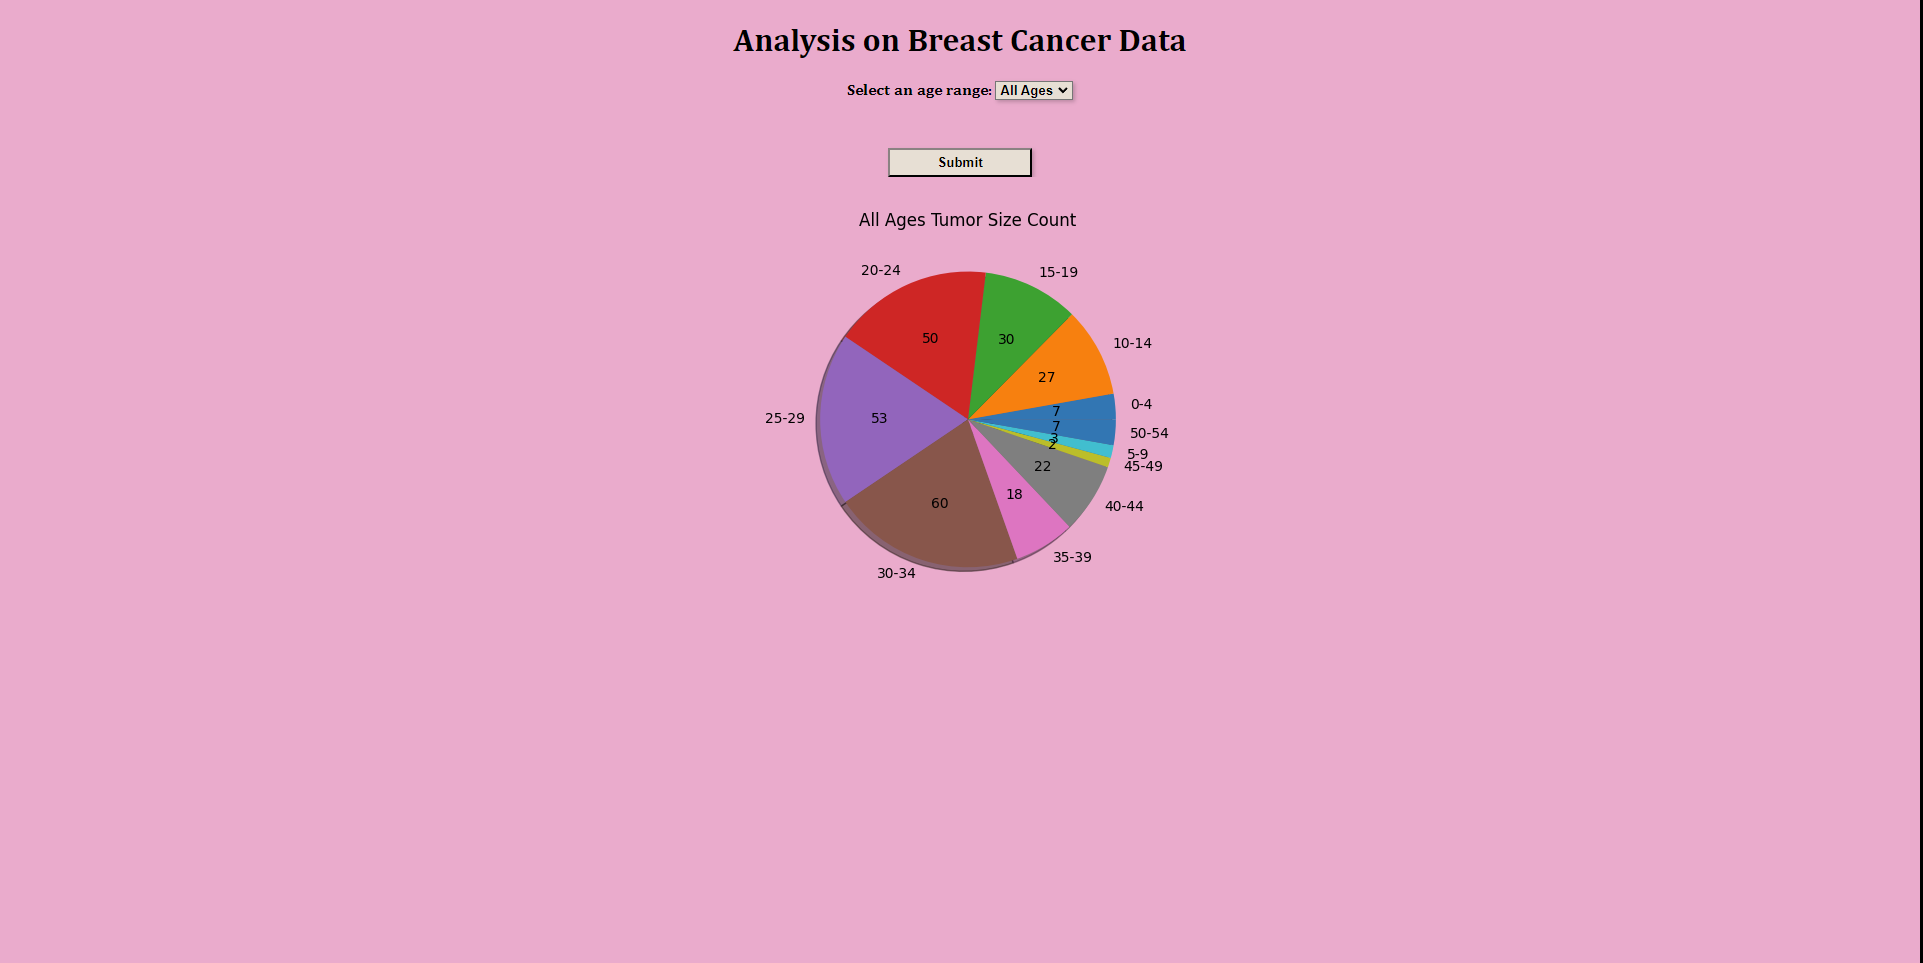
All Ages Pie Chart of Tumor Size
-
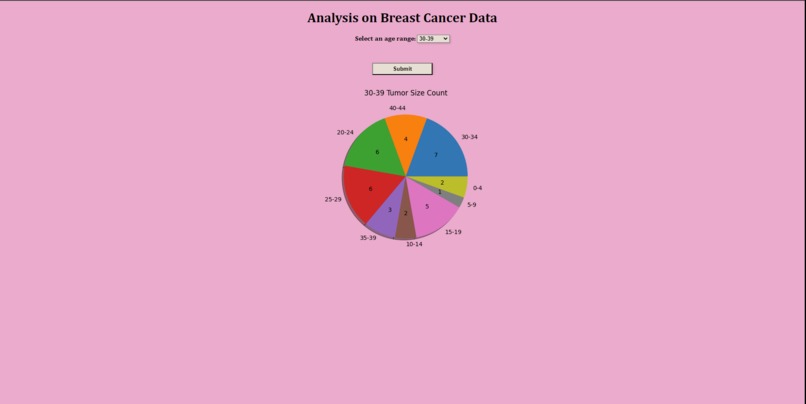
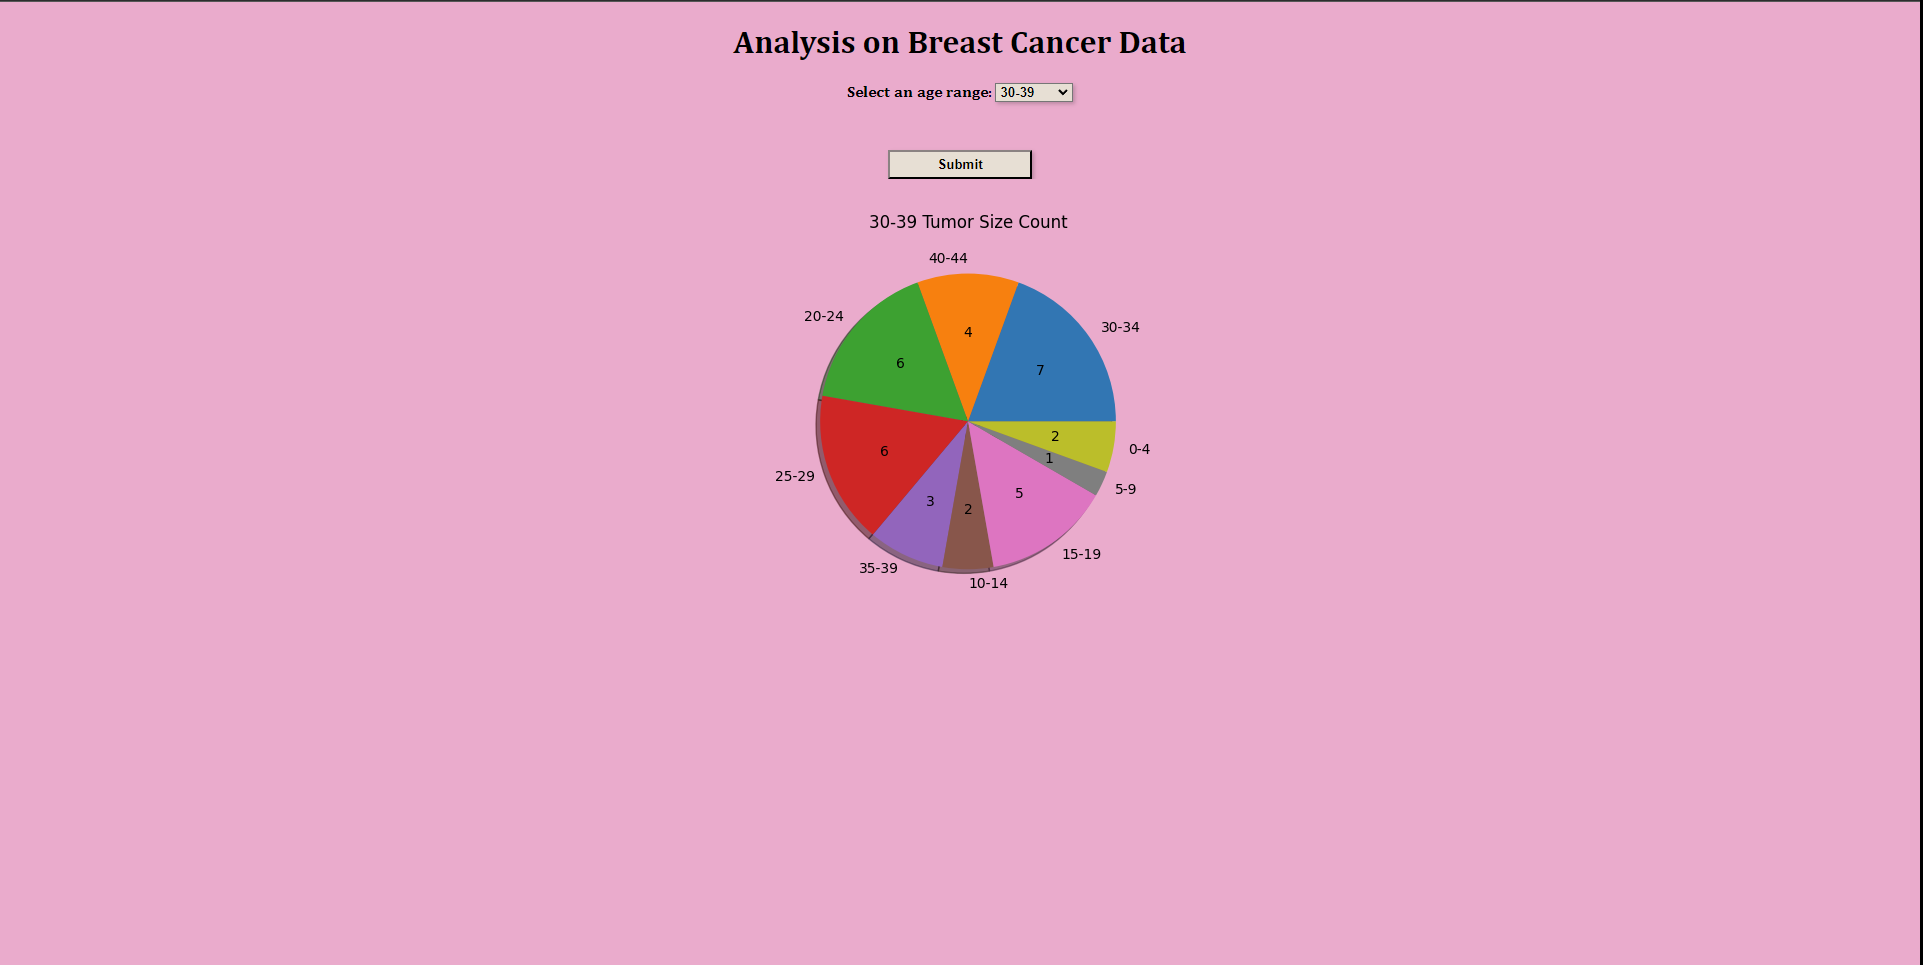
30-39 Pie Chart of Tumor Size
-

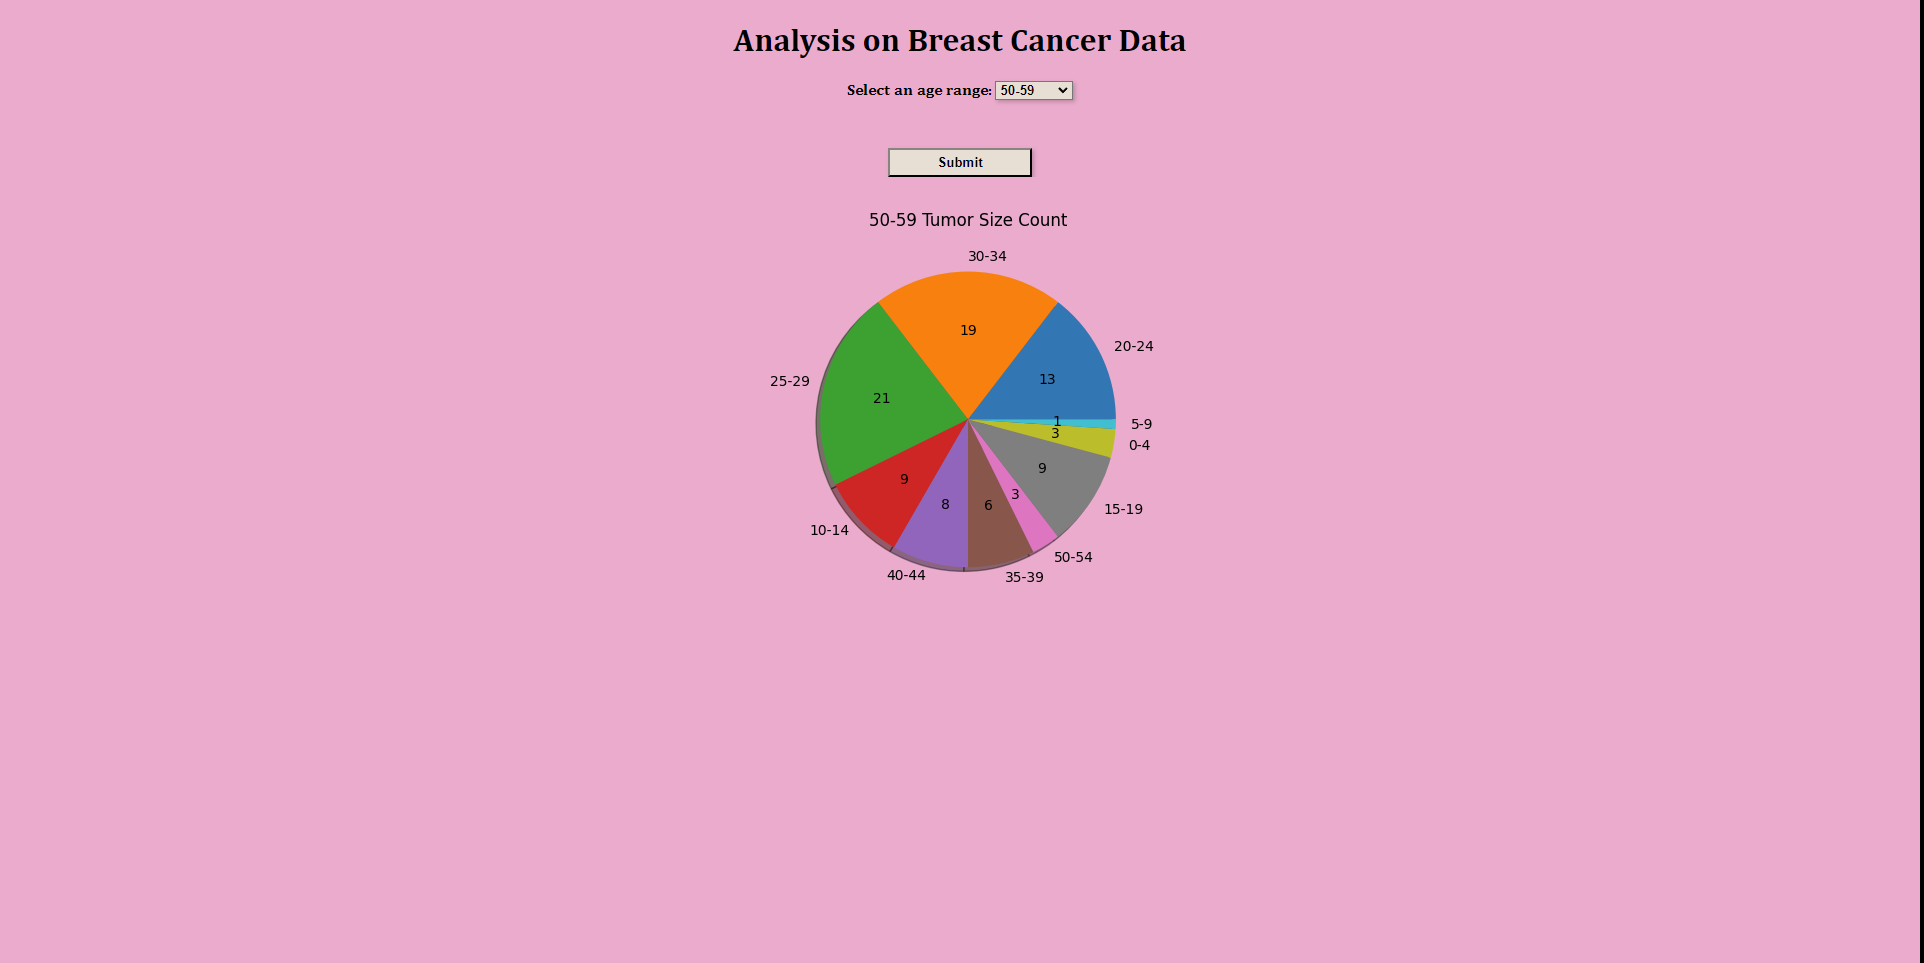
50-59 Pie Chart of Tumor Size
Inspiration
We wanted to build a program that was able to help bring light on breast cancer.
What it does
The program takes in the user's age and displays a pie chart with the different tumor size ranges and amount of people with those tumor sizes.
How we built it
To build this, we used UCI's dataset of breast cancer patients and used Python, Flask, HTML, and CSS to create a front-end program for users to interact with.
Challenges we ran into
This was the first time we used Flask so learning the ins and outs of it was something we found challenging. In addition, we had never grabbed a dataset and analyzed it before so it was something that we also had to work through.
Accomplishments that we're proud of
We are proud of what we made and how we utilized Flask to create a program that connects Python and HTML. We are also proud that we were able to take a dataset and analyze data for the betterment of the world.
What we learned
After this project, we learned how to use Flask and to better utilize Python and libraries like numpy, matplotlib, and pandas.
What's next for Breast Cancer Data Analysis
Going forward we will continue to analyze the data, displaying categories like the location of the tumor on a patient.


Log in or sign up for Devpost to join the conversation.