-
-
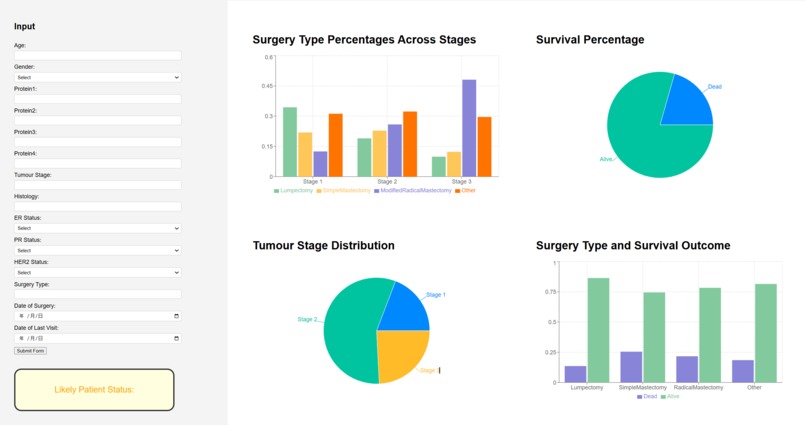
Web Page Overview
-
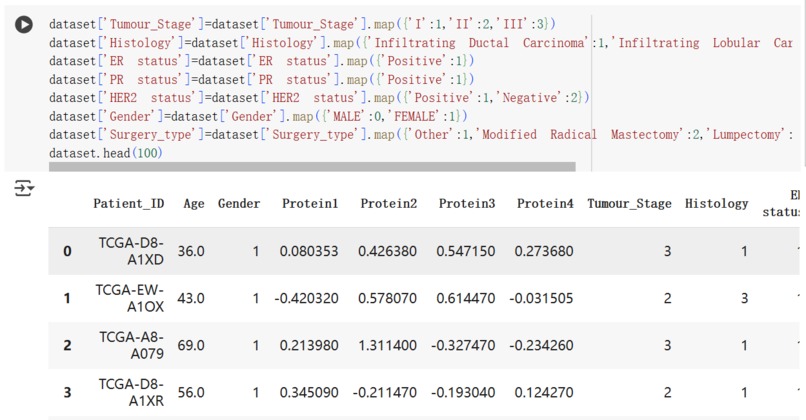
Data preprocessing for the ML model
-
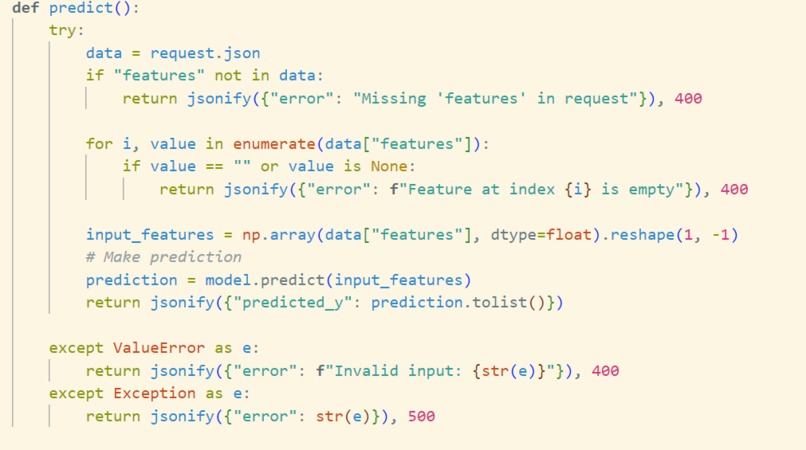
ML model intergration to the backend
-
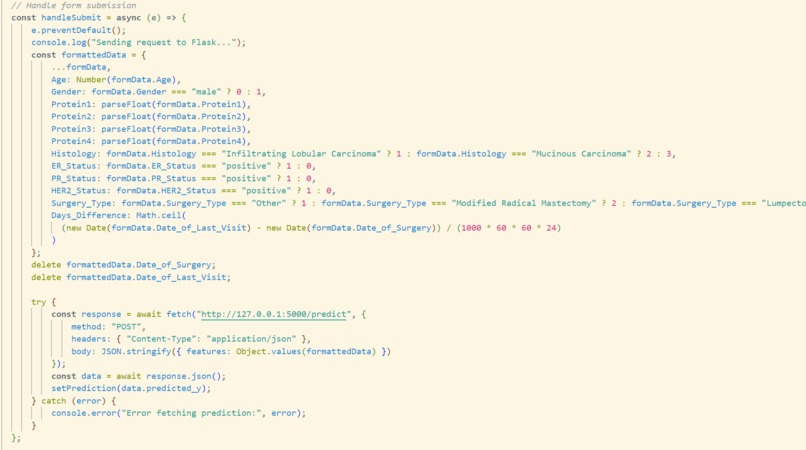
Make POST Request to the backend with user data, to be used for prediction of the ML model
-
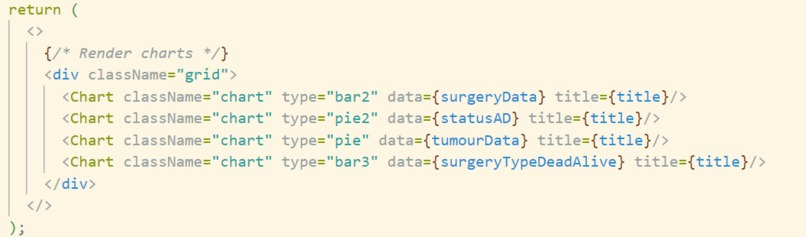
Frontend Visualization implementation


Inspiration
The inspiration for this project came from the need to track post-surgical outcomes in breast cancer patients. By analyzing patient data, including tumor stage, protein expression levels, and follow-up visits, we aimed to identify patterns that could potentially predict patient prognosis. These insights help clinicians make more informed decisions, enabling them to tailor treatments more effectively and improve patient outcomes. This dataset provided an opportunity to apply data analysis techniques for meaningful healthcare insights, ultimately supporting more efficient and personalized treatment strategies. This was an ideal challenge for hypothesis testing and statistical modeling.
What it does
Our project analyzes post-surgical data of breast cancer patients to identify patterns in recovery, follow-up visits, and survival outcomes. By utilizing statistical analysis and hypothesis testing, we analyze factors such as tumor stage, protein expression levels, and patient demographics to understand their impact on post-surgery prognosis. This helps in drawing meaningful insights that could contribute to better patient monitoring and healthcare decision-making.
How we built it
We built our project by first gathering and cleaning the dataset, focusing on handling missing values and ensuring consistency in date formatting. We then performed statistical analysis to identify patterns and relationships within the data, such as the impact of tumor stage and protein expression on patient outcomes. After processing the data, we integrated the analysis into a web app using React for frontend and Flask for backend, allowing real-time input and visualization. The app also includes user-friendly features like interactive charts, data inputs, and results that make our findings more accessible. Throughout the process, we focused on ensuring both the technical functionality and the usability of the final product.
Challenges we ran into
At the beginning of the hackathon, we explored several other ideas, including different machine learning applications. However, we had to pivot due to the large size of certain datasets, which made training infeasible within the limited timeframe. Once we settled on our current project, we only have 12 hours left and encountered several technical challenges.
One major issue was handling missing data, particularly for patients who didn’t return for follow-up visits, making it difficult to determine their status. Another challenge was dealing with inconsistencies in date formatting, which required preprocessing to ensure accurate time-based analysis.
Additionally, we faced CORS (Cross-Origin Resource Sharing) restrictions, which blocked our POST requests when integrating the frontend with the Flask backend. This required configuring appropriate headers and debugging network requests to ensure smooth communication between our React frontend and the backend API.
Time constraints also impacted our ability to add more features to the web application. Ideally, we wanted to implement interactive data visualizations, user authentication, and an expanded dataset, but we had to prioritize core functionality within the available time. Furthermore, interpreting the biological significance of protein expression levels and their correlation with patient outcomes required domain knowledge, so we had to utilize medical literature for better insights.
Accomplishments that we're proud of
We are proud of successfully cleaning and preprocessing the dataset, ensuring accurate analysis despite missing values and inconsistencies. Implementing a robust approach to handling missing patient follow-ups by assigning meaningful status labels was a key achievement. Additionally, we applied statistical analysis to identify patterns in post-surgical outcomes, which gave us valuable insights for breast cancer prognosis. A major accomplishment is integrating our analysis into a web app for the hackathon demo, making it interactive and user-friendly for real-time data input and visualization.
What we learned
A major accomplishment is successfully deploying a full-stack web application that integrates our machine learning analysis into an interactive and user-friendly interface. This allows real-time data input, visualization, and prediction capabilities, making it a functional tool for demonstrating our approach in the hackathon demo.
Through this project, we learned how crucial data cleaning and preprocessing are, especially when dealing with missing or inconsistent medical records. We also gained hands-on experience in statistical analysis, helping us uncover patterns in patient outcomes based on factors like tumor stage and protein levels. Building the web app for our hackathon demo taught us how to make data more accessible and interactive. On top of that, working under tight deadlines reinforced the importance of teamwork, quick problem-solving, optimization of our time, and the importance of innovative, realistic ideas for hackathons.
What's next for breast cancer dashboard
The next steps for our project involve further refining the web app to enhance its functionality and user experience. We plan to integrate more advanced data analysis features, such as visualizations and predictive models, to give users deeper insights into patient outcomes.
Additionally, we’ll work on improving the accuracy of our analysis by incorporating more data, if available, and fine-tuning the statistical models. Another feature we want to integrate is a medical chatbot, designed to assist clinicians by providing quick, AI-driven insights and guidance on patient data. This chatbot would help healthcare professionals make informed decisions by answering common questions about treatment options, prognosis factors, and patient-specific risks based on the available data.
Lastly, we will test the app with real users, gather feedback, and iterate to ensure it’s both practical and impactful for healthcare professionals.

Log in or sign up for Devpost to join the conversation.