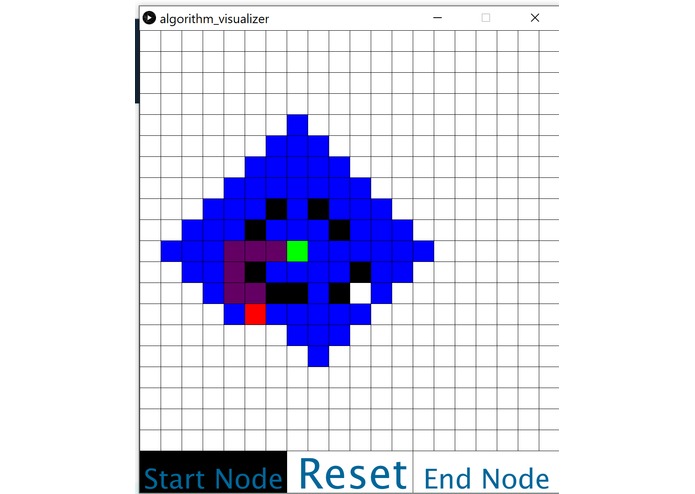
Inspiration - I had seen a cool project online which implemented a multitude of different searching algorithms with visual representations, and I wanted to try making one as well

What it does - Creates a visual representation of the breadth first search algorithm as it runs

How I built it - I built my program in processing, using java. I drew a grid of boxes, and maintained each box as a one or a zero in a 2-d array. I could then select two nodes to be my start and end nodes, as well as remove nodes (create "walls").

Challenges I ran into - I struggled to visualize the algorithm in an appealing way, as well as to properly associate the back end data with the front end visuals

Accomplishments that I'm proud of - I'm proud that I was able to make a relatively clear visualization of the way breadth first search works

What I learned - methods for connecting data and visuals, as well as interesting ways to get around constraints in the environment

What's next for Breadth first search visualization - I would like to implement more algorithms, so you can have an assortment of visualizations to play with. I would also like to make it overall more visually appealing.

Built With

Share this project:

Updates