-
-
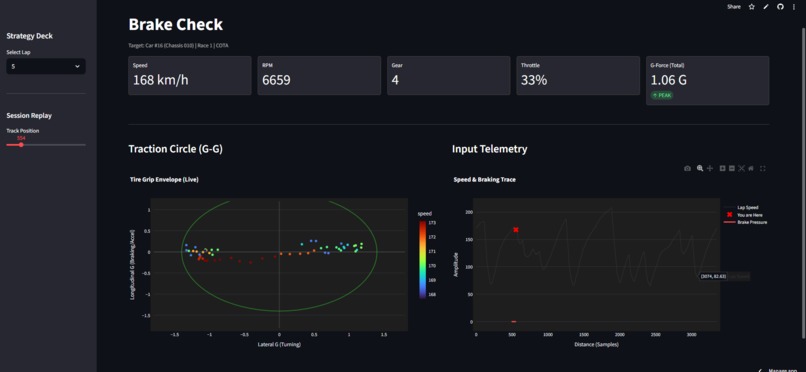
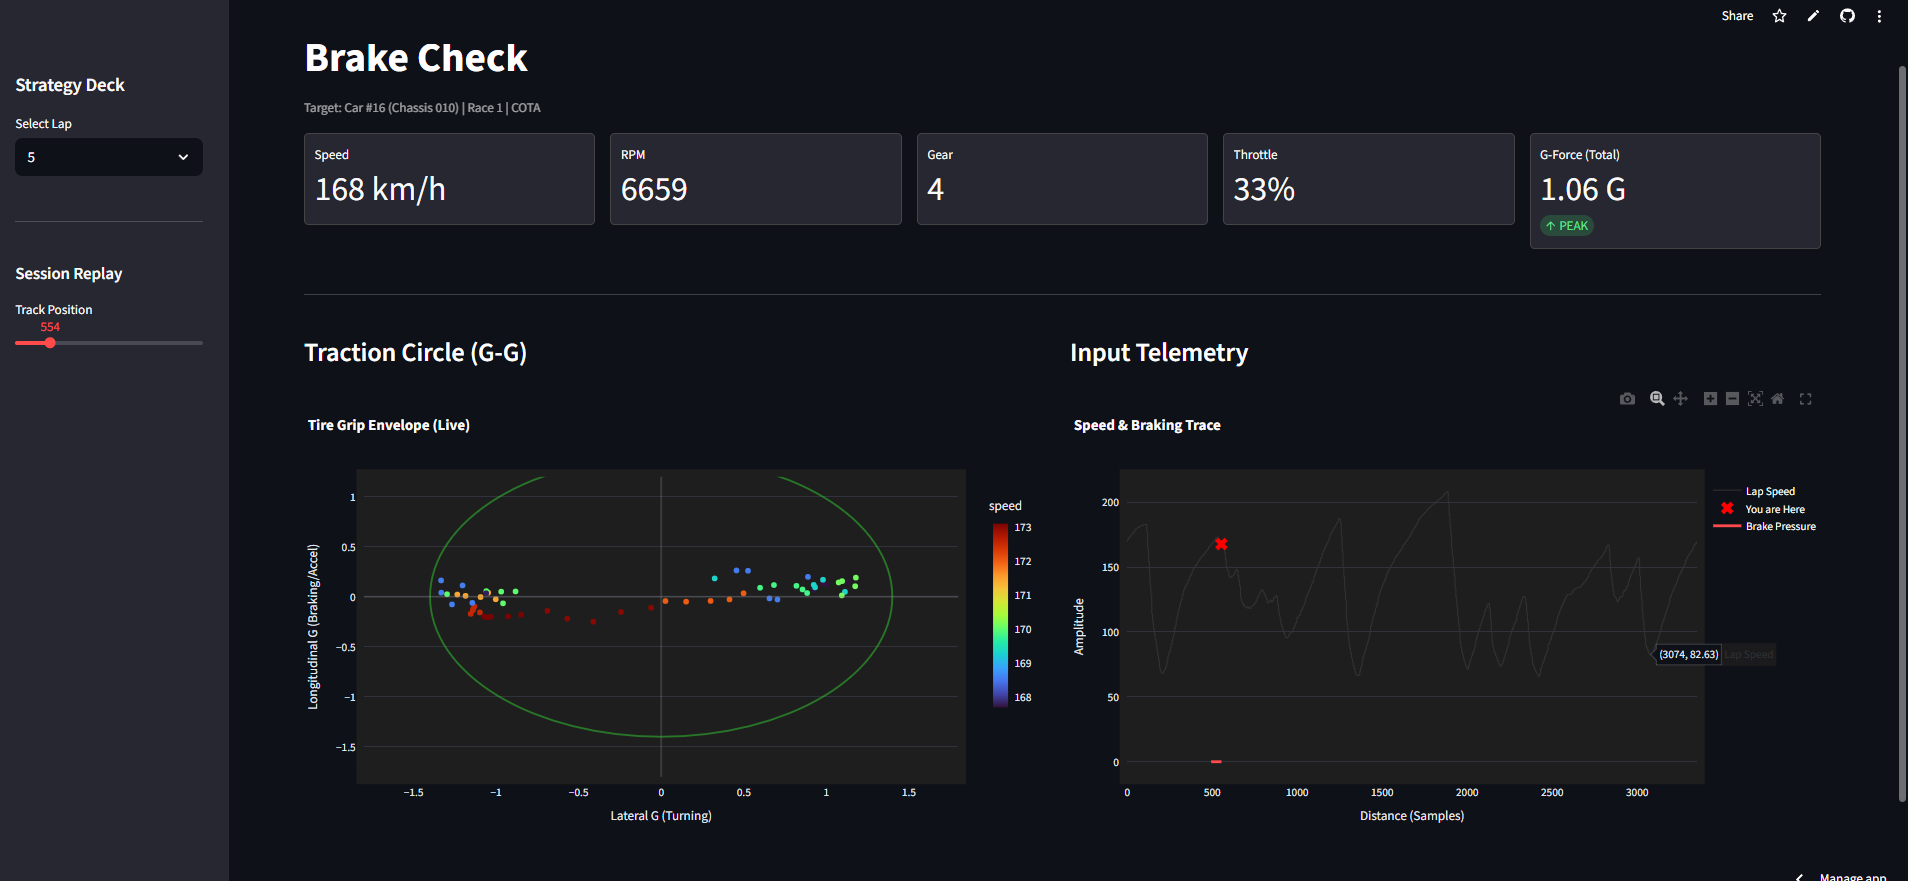
Brake Check Screenshot
Inspiration "Data is the new fuel." We heard this constantly, but when we opened the raw datasets for the Toyota GR Cup, we realized that raw data is actually an obstacle.
A driver doing 130mph cannot process a spreadsheet with 80,000 rows. They don't need numbers; they need physics. We noticed a gap between "Descriptive Analytics" (telling a driver they were slow) and "Prescriptive Analytics" (showing them why).
We wanted to build the tool we would want in the pit lane: a Digital Race Engineer that translates millions of sensor readings into a single, visual language of grip and momentum.
What it does Brake Check is a real-time telemetry dashboard designed specifically for the Toyota GR86. It transforms abstract sensor data into three actionable coaching tools:
The Live Friction Circle (G-G Diagram): A visualization of the tire's physical grip limit. It instantly reveals if a driver is "under-driving" the car or executing a perfect "trail-braking" maneuver (maximizing grip while turning).
Input Trace Correlation: A millisecond-accurate graph that overlays Brake Pressure and Throttle against Speed. This acts as a "Lie Detector," exposing lazy braking zones or hesitation on corner exits.
10Hz Lap Scrubber: Engineers can "scrub" through a specific lap to replay the exact physics state of the car at any corner, allowing for forensic analysis of lost time.
How we built it We treated this as a high-performance engineering challenge, mirroring the constraints of a race team:
The Engine (Backend): We used Python and Polars to handle the massive datasets (2GB+). Polars allowed us to perform "lazy execution" queries, processing millions of rows in milliseconds without crashing the memory buffer.
The Chassis (Frontend): We built the interface in Streamlit to create a dark-mode, high-contrast UI suitable for use on pit-lane monitors in bright sunlight.
The Physics (Math): We wrote custom vector calculations to derive "Total G-Force" from the raw accx and accy CAN-bus streams, and implemented a "Forward-Fill" algorithm to handle the asynchronous sensor frequencies (e.g., GPS vs. Engine RPM).
Challenges we ran into The track was slippery, and we hit several walls:
The "Temporal Rift": We initially tried to fuse Physics Data with Lap Timing Data, but our join algorithms kept returning 0 matches. We realized we were trying to map Friday Practice Telemetry to Sunday Race Lap Timers. We had to build a "Forensic Scan" script to identify the correct file pairs based on internal timestamps, not just filenames.
The "Ghost File" Crash: Our ingestion pipeline kept failing due to hidden MacOS metadata files (._filename.csv) disguised as data. We had to write a robust file-filtering logic to ignore these "ghosts."
The "Swiss Cheese" Effect: Because sensors report at different speeds (100Hz vs 10Hz), our pivoted data was full of NaN holes. We implemented a linear interpolation strategy to smooth the data for the graphs.
Accomplishments that we're proud of The "Heart Shape" Validation: The moment we plotted the Friction Circle and saw the data form a perfect mushroom/heart shape. This proved our physics engine was correctly interpreting the real-world dynamics of the GR86.
Zero-Lag Performance: Optimizing the Polars pipeline so that 89,000 rows of data load and render instantly in the browser.
The Pivot: Successfully abandoning a broken strategy (external lap files) and writing a new extractor to utilize the internal lap counters found deep in the Race 1 telemetry.
What we learned Data Hygiene is King: In racing, a single bad timestamp ruins the entire lap. We learned advanced data cleaning techniques that are applicable far beyond motorsports.
The Physics of Grip: We gained a deep appreciation for the concept of the "Traction Circle"—that a tire has a finite budget of grip to be shared between braking and turning.
Asynchronous Fusion: How to join time-series data streams that don't share perfectly aligned timestamps.
What's next for Brake Check Ghost Lap Overlay: We want to visualize the "Best Lap" as a shadow behind the current lap, showing exactly where the driver is losing time in real-time.
AI Coaching: Implementing a machine learning model that analyzes the Friction Circle and outputs text advice like: "Turn 1: You are braking 5 meters too early."
GPS Map Integration: Plotting the telemetry directly onto a track map of COTA to give spatial context to the data.
Built With
- python
- streamlit

Log in or sign up for Devpost to join the conversation.