-
-
visualizer_cpp
Inspiration BrainFlux was inspired by the growing need for intuitive and real-time visualization tools in neuroscience and neural engineering. As neural data becomes more complex, researchers and engineers require better ways to interpret brain activity, identify patterns, and analyze spike data. With the potential of Neuralink's brain-machine interfaces and other neural research, there’s a clear opportunity to create a tool that simplifies and enhances the process of visualizing brain data in a way that’s both efficient and engaging.
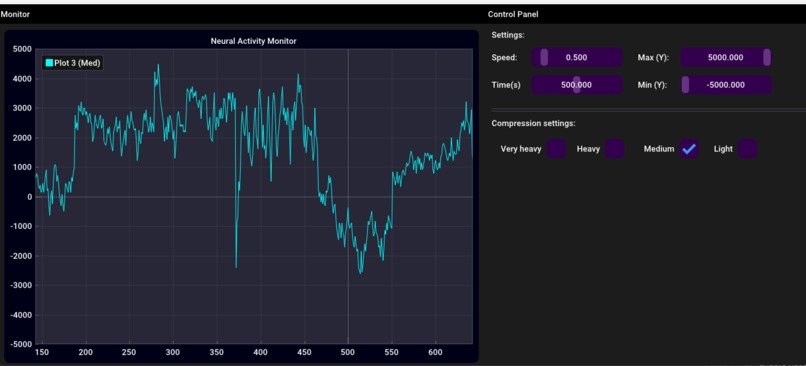
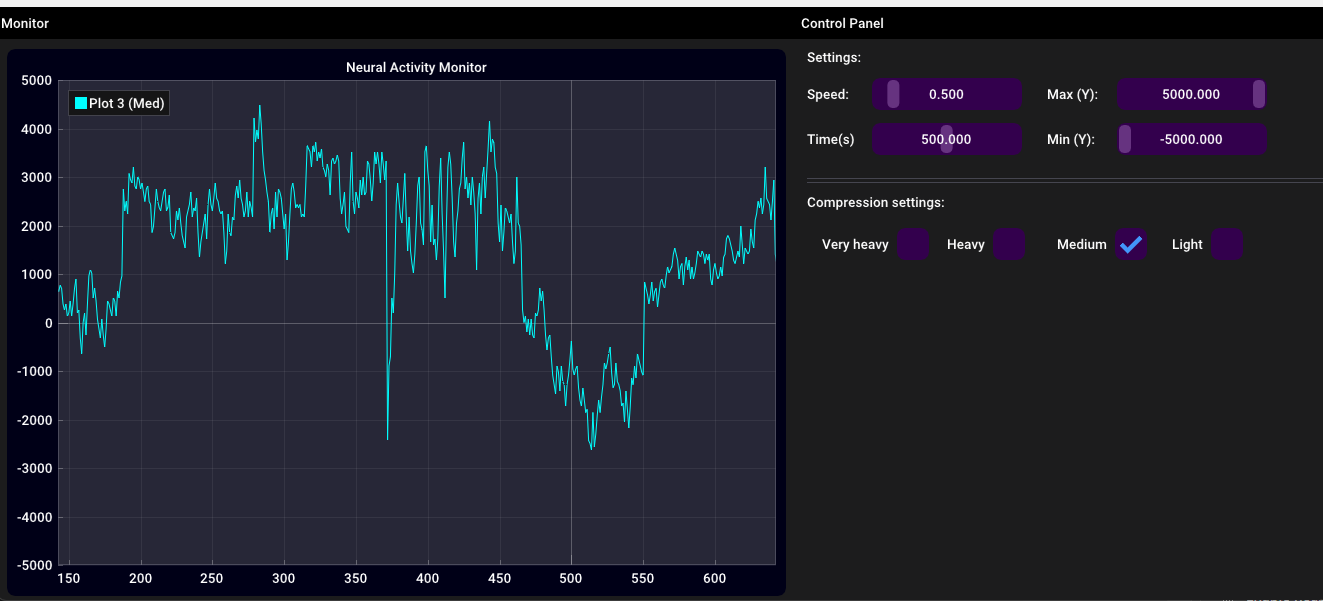
What it does BrainFlux is a powerful data visualization tool designed to render and analyze real-time neural data. It leverages the ImGui framework to present intricate graphs of brain activity, allowing users to interact with spike data, neural patterns, and synaptic activity. The tool enables researchers and engineers to explore and understand complex brain data through intuitive, customizable visualizations, helping them gain deeper insights into neural networks and their behavior.
How we built it BrainFlux was built using C++ and the ImGui framework for rendering and interaction. The backend leverages efficient algorithms for processing neural data and generating visual representations like spike detection, spectrograms, and MFCCs. We integrated real-time data analysis and ensured that the user interface is smooth, responsive, and lightweight, even with large datasets. To process the raw audio data, we used Python with the following script for noise reduction and amplification
Challenges we ran into We encountered challenges related to efficiently rendering large datasets without compromising performance. Real-time updates of neural data were difficult to manage without slowing down the system, so optimizing for performance was a major hurdle. Additionally, syncing multiple data sources, like spike times and neural activity graphs, required precise timing and robust handling of asynchronous data streams. Balancing complexity and usability in the interface was also challenging but crucial for ensuring the tool remains accessible for users.
Accomplishments that we're proud of We’re proud of successfully creating a smooth, real-time visualization tool that handles complex neural data efficiently. Using ImGui allowed us to build an intuitive interface that is both fast and responsive, even with large datasets. Our ability to integrate diverse data sources and visualize them in real time is a major achievement. BrainFlux also makes it easy for users to interact with and explore the data, making it more accessible for researchers and engineers.
What we learned We learned the importance of performance optimization when working with large and complex datasets. ImGui provided a great framework for creating responsive and lightweight interfaces, but we had to carefully manage memory usage and rendering processes. Additionally, the integration of real-time data sources, like neural spikes, taught us how to synchronize different streams of data effectively. We also gained valuable insights into designing user interfaces that balance functionality with simplicity.
What’s next for BrainFlux Moving forward, we plan to enhance BrainFlux with additional features like advanced data analytics, machine learning integration for pattern recognition, and more customization options for the visualizations. We also aim to integrate support for more neural data formats, enabling BrainFlux to be a versatile tool for a wide range of research applications. We are excited about the potential to expand BrainFlux’s capabilities and make it an essential tool for the neural engineering community.
Built With
- c++
- directx11
- imgui
- python
- visual
- visual-studio

Log in or sign up for Devpost to join the conversation.