Inspiration
A volume stage costs $200,000 to $500,000 a day. That's the whole reason this exists.
An LED volume looks perfect on set — the wall shows the world, the camera moves, everyone's happy. What nobody sees is a render node dropping frames, genlock drifting, VRAM spiking during a pyro cue. The take looks clean. It isn't. Nobody finds out until the 4K deliverable, weeks later, when the volume's booked for someone else and a reshoot means rebuilding the whole day.
The obvious fix is a dashboard — put the telemetry on a wall monitor and let a human watch it. Wrong fix. A dashboard only helps if someone's already staring at it the exact second something breaks, and nobody on a working set has that job. A chart can't pre-stage a corrective take, can't page an engineer, can't tell you in plain language whether a take is safe to circle.
So BrainBar is five agents instead of a wall monitor: one that knows what the shot was supposed to be, one that knows what the telemetry actually says happened, one that weighs both and makes the call, one that acts on it, one that hands editorial a package they can trust. Since the crew's own telemetry lives in the same Grafana Cloud stack as the stage's, it ended up watching itself too.
Partway through, a second question showed up: if the crew's reasoning is good enough to trust with a hero take, why should the only way to reach it be a dashboard nobody else can see? That's why BrainBar isn't just a consumer of Grafana's tools anymore. It's one itself.
What It Does
BrainBar is a five-agent crew that fuses a shot's creative intent (script, shot list, storyboard, call sheet) with the take's live technical telemetry (frame times, sync drift, tracking jitter, GPU and VRAM) in Grafana Cloud, and acts on what it finds.
The pipeline, per take
| Step | Agent | What Happens |
|---|---|---|
| — | First AD (concurrent, on hardware failure) | Fires the instant a render node goes down, in parallel with everything below rather than waiting behind it — opens the incident, drains the node, pages on-call, before a verdict even exists |
| 1 | Supervisor | Decides Flash or Pro for this take by reading its own recent verdict latency and quota-error telemetry back from Grafana first, before committing to a model that might be about to fail |
| 2 | Continuity | Grounds the take against the script, shot list, and storyboard (RAG Engine, Document AI), checks Loki for whether the scripted cues actually fired |
| 3 | Technical Director | Diagnoses Mimir, Loki, and Tempo telemetry for the take window, searches its own crew's annotation history for a matching prior incident, checks for an overlapping Grafana Sift investigation |
| 4 | Supervisor | Synthesizes both verdicts into one circle-take call, cites evidence, writes anything worth remembering to Memory Bank |
| 5 | First AD | Converts the verdict into action: annotate, pre-stage a corrective take if warranted, and check the VRAM forecast — already told what the hardware reaction above handled, so nothing gets done twice |
| 6 | DIT (at wrap) | Compiles technical dailies with a Grafana deep-link per shot, writes to Cloud Storage and BigQuery |
A dead node used to wait behind steps 2–4, because the old pipeline was one straight line: analyze, then act. Under real load that line can take over a minute, and a node on fire doesn't care what the creative verdict says — so that part no longer waits its turn.
What a real take looks like
A real sequence, from an actual run against a live Grafana Cloud stack and a live Vertex AI project, lightly generalized for readability.
CUT. Take sc03-setup4-take3 rolls. node-6 goes down mid-take.

First AD reacts immediately, before any verdict exists: opens a Grafana
incident, drains node-6, pages the on-call escalation chain. All three
happen while Continuity and Technical Director are still working.

Technical Director pulls Mimir frame-time and VRAM series for the take window,
checks Loki for warning and sync_loss events, searches its own annotation
history for a prior node-6 incident, checks for an overlapping Sift
investigation. Clean telemetry up to the failure. None found on either count.

Supervisor synthesizes: CIRCLE, technically clean before the failure, intent
matched.

First AD receives the verdict plus node_down=node-6, sees the hardware
reaction already ran, and does not repeat it:
  - annotates the Stage Health dashboard with the verdict and headline
  - checks the VRAM forecast on the remaining nodes, finds nothing at risk
  - reports honestly when the alerting tool cannot silence the storm
    without a specific rule ID, rather than pretending it succeeded
Every action in that log is a real MCP call against a real stack, not templated
demo copy — confirmed directly against the deployed production service: a real
take produced a real annotation in Grafana Cloud, and real Tempo traces naming
the actual tool calls (grafana_query_prometheus, grafana_query_loki_logs,
grafana_get_annotations, and others).
BrainBar does not just diagnose, it acts
| Capability | What It Does |
|---|---|
| Pre-staged corrective takes | First AD steers render load off an implicated node before the next take on that setup repeats the failure |
| Real incidents, driven to resolution | Opens, annotates, and resolves a Grafana incident on hardware failure, not just a comment |
| Real on-call paging | Pages a real escalation chain through Grafana Cloud IRM, grouped by node so repeats do not flood the same page |
| Predictive load-shedding | Reads a Grafana Machine Learning VRAM forecast every take and acts before the threshold is actually crossed, not after |
| A self-written playbook | Searches its own crew's past verdict annotations before diagnosing a new fault, and cites the precedent explicitly when it finds one |
| A second opinion from Grafana's own AI | Checks for and reconciles with any Grafana Sift investigation overlapping the take, agreeing or disagreeing in its own words |
| Technical dailies | A per-shot package with a Grafana deep-link, delivered to editorial at wrap, no manual compilation |
| One evidence bar, no matter which model answers | A shared, code-level check keeps a not-clean verdict from shipping unless it actually cites a real node, a real metric, a real reason — run identically whether Flash or Pro produced it |
| Callable directly, not just watchable | The same diagnosis the crew runs on every cut is also exposed as an MCP server other tools can call — ask it "is take X clean?" and get a real answer, no dashboard needed. Deployed and IAM-protected, guarded by Google Cloud Model Armor against a caller trying to manipulate its inputs |
| A flapping node doesn't get a second full model call | A plain dictionary lookup, no tokens spent, skips firing a fresh hardware-reaction call (and a fresh page to on-call) if the same node already triggered one in the last five minutes |
Two ways to trigger it
Automatic, on every cut. The simulator posts directly to the backend the moment a take starts and ends. The crew reacts within seconds.
On demand, for judging. The dashboard's Run demo scenario button drives a scripted, escalating three-take run — a clean plate, a VRAM spike, a node death — narrated live as each step lands, so the same real pipeline is visible end to end in one click.
How We Built It
The AI core: Google ADK and Gemini on Vertex AI
Five separate LlmAgent instances, each with a typed Pydantic output_schema —
structured results, never free text to re-parse. Continuity and Technical
Director run in parallel through asyncio.gather on every cut. The Supervisor is
deployed twice: once in-process for on-set latency, once independently to Agent
Engine as a hosted, queryable agent, same underlying object both times.
Backend (FastAPI) -> agents.supervisor.orchestrate.handle_cut
  -> Supervisor decides model tier (reads its own Grafana telemetry first)
  -> Continuity + Technical Director run in parallel via asyncio.gather
  -> Supervisor synthesizes the circle-take call
  -> First AD converts the verdict into action
  -> (at wrap) DIT compiles technical dailies
Every agent's Grafana access goes through one shared McpToolset connection
point. ADK discovers the live tool set from the Grafana MCP server at runtime —
nothing hardcoded — and a tool filter per agent narrows what it's allowed to
call, not just what it can see.
The crew, callable directly
Every one of those Grafana calls is BrainBar acting as an MCP client. It became obvious the same thing should work in reverse: Technical Director and Continuity already query Grafana themselves and hand back one bounded, structured verdict, so wrapping those same functions behind an MCP server was a small amount of code, not a second product.
Now any MCP-speaking caller — a coding agent, Grafana's own Assistant, something
we haven't thought of — can call diagnose_take_technical or
diagnose_take_creative directly and get back the same verdict the crew
produces on its own. It runs as its own Cloud Run service, IAM-protected the
same way the Grafana MCP proxy already is, and its inputs are screened by Google
Cloud Model Armor before they ever reach a model — a tool surface other people's
code can call needs both.
Not every failure deserves a fresh model call
A node that's actually failing doesn't die once cleanly — it flaps, comes back for a frame, drops again. Reacting every single time means a second full Gemini call for information the crew already has, and paging the same on-call engineer twice for one failure.
The fix sits in front of the model: before First AD's hardware-reaction call fires, a plain dictionary lookup checks whether this node already triggered a reaction in the last five minutes. If it has, nothing gets called — no tokens, no duplicate page, no duplicate incident. It's barely a check at all, and that's the point: catch the expensive mistake with the cheapest possible thing, before it happens.
The Supervisor's model-tier routing works the same way — deciding Flash or Pro is a few lines of Python before any Gemini call is made, not a judgment handed to the model that's about to run.
The crew watching itself, and being watched back
Grafana AI Observability already exported the crew's own Gemini and tool-call telemetry into the same stack it queries, which is how the Supervisor checks its own latency and quota errors before routing to a stronger model. We added Grafana's newer Agent Observability layer (their Sigil SDK) on top, which groups every agent's calls into a real conversation per take, tracks time-to-first-token, and shows every tool call with its own input, output, and duration.
The useful part was the evaluation layer: an LLM judge in Grafana Cloud grades Technical Director's verdicts on whether the reasoning is actually grounded in the telemetry it queried, not just whether the JSON is valid — fed both the verdict and the raw tool results, so a plausible-sounding made-up number gets caught. A cheaper version of the same check runs in our own code on every verdict regardless of model tier. Two depths of the same question, one nearly free, one asked by an independent model.
Grafana integration, at real depth
Mimir, Loki, and Tempo for the stage's telemetry. Alerting and Incidents for hardware failures. Annotations as a live, self-writing playbook instead of a runbook file nobody reopens. A Grafana Machine Learning forecast the crew acts on before a threshold is crossed, Grafana Sift consulted as a second, independent opinion, continuous profiling with Pyroscope linked to the crew's own traces, and real on-call paging through Grafana Cloud IRM. Dashboards and alert rules are provisioned as code, reviewed and versioned like everything else.
The memory layer
Vertex AI Memory Bank carries cross-take and cross-day notes for the Supervisor — coverage owed, recurring problems on a specific node. A second kind of memory lives directly in Grafana: every take's verdict annotation is itself institutional memory Technical Director searches before diagnosing the next fault, so the playbook updates itself instead of going stale in a document.
Infrastructure
| Layer | Technology |
|---|---|
| AI model | Gemini 2.5 Pro and Flash on Vertex AI, Gemini Live API for spoken narration |
| Agent framework | Google Agent Development Kit |
| Grafana | MCP server (both directions), Mimir, Loki, Tempo, Machine Learning, Sift, Pyroscope, Agent Observability, Incident Response and Management |
| Backend | FastAPI, WebSocket, REST |
| Grounding | Vertex AI RAG Engine, Vector Search, Document AI |
| Memory | Vertex AI Memory Bank on Agent Engine |
| Security | Google Cloud Model Armor (guards the public MCP server's inputs) |
| Storage and analytics | Cloud Storage, BigQuery |
| Secrets | Secret Manager |
| Hosting | Cloud Run (4 services), Agent Engine, Cloud Build |
| Frontend | React, Vite |
Try it now
Live, no signup, no local setup: https://brainbar-frontend-854441956422.us-central1.run.app — click Run demo scenario on the Production Wall for 3 scripted takes against the real, deployed crew and a real Grafana Cloud stack. Switch to Crew Wall to watch live cost, latency, and model routing.
To run it locally instead: full step-by-step setup (Python venvs, the Grafana MCP server, one-time RAG ingestion) is in the repo's README's Local Setup section.
Proof this is real runtime use, not README claims: every Google Cloud and Grafana
service below is imported and called in code — file paths are in the README's
Grafana Cloud Integration
table. Independently verified against the live deployed backend, not just local
dev: a real take produced a real annotation in Grafana Cloud and real Tempo traces
naming the actual tool calls (grafana_query_prometheus, grafana_query_loki_logs,
grafana_get_annotations, and others).
All 4 services (frontend, backend, stage simulator, and BrainBar's own MCP server) are deployed and verified live, not just running in a local demo.
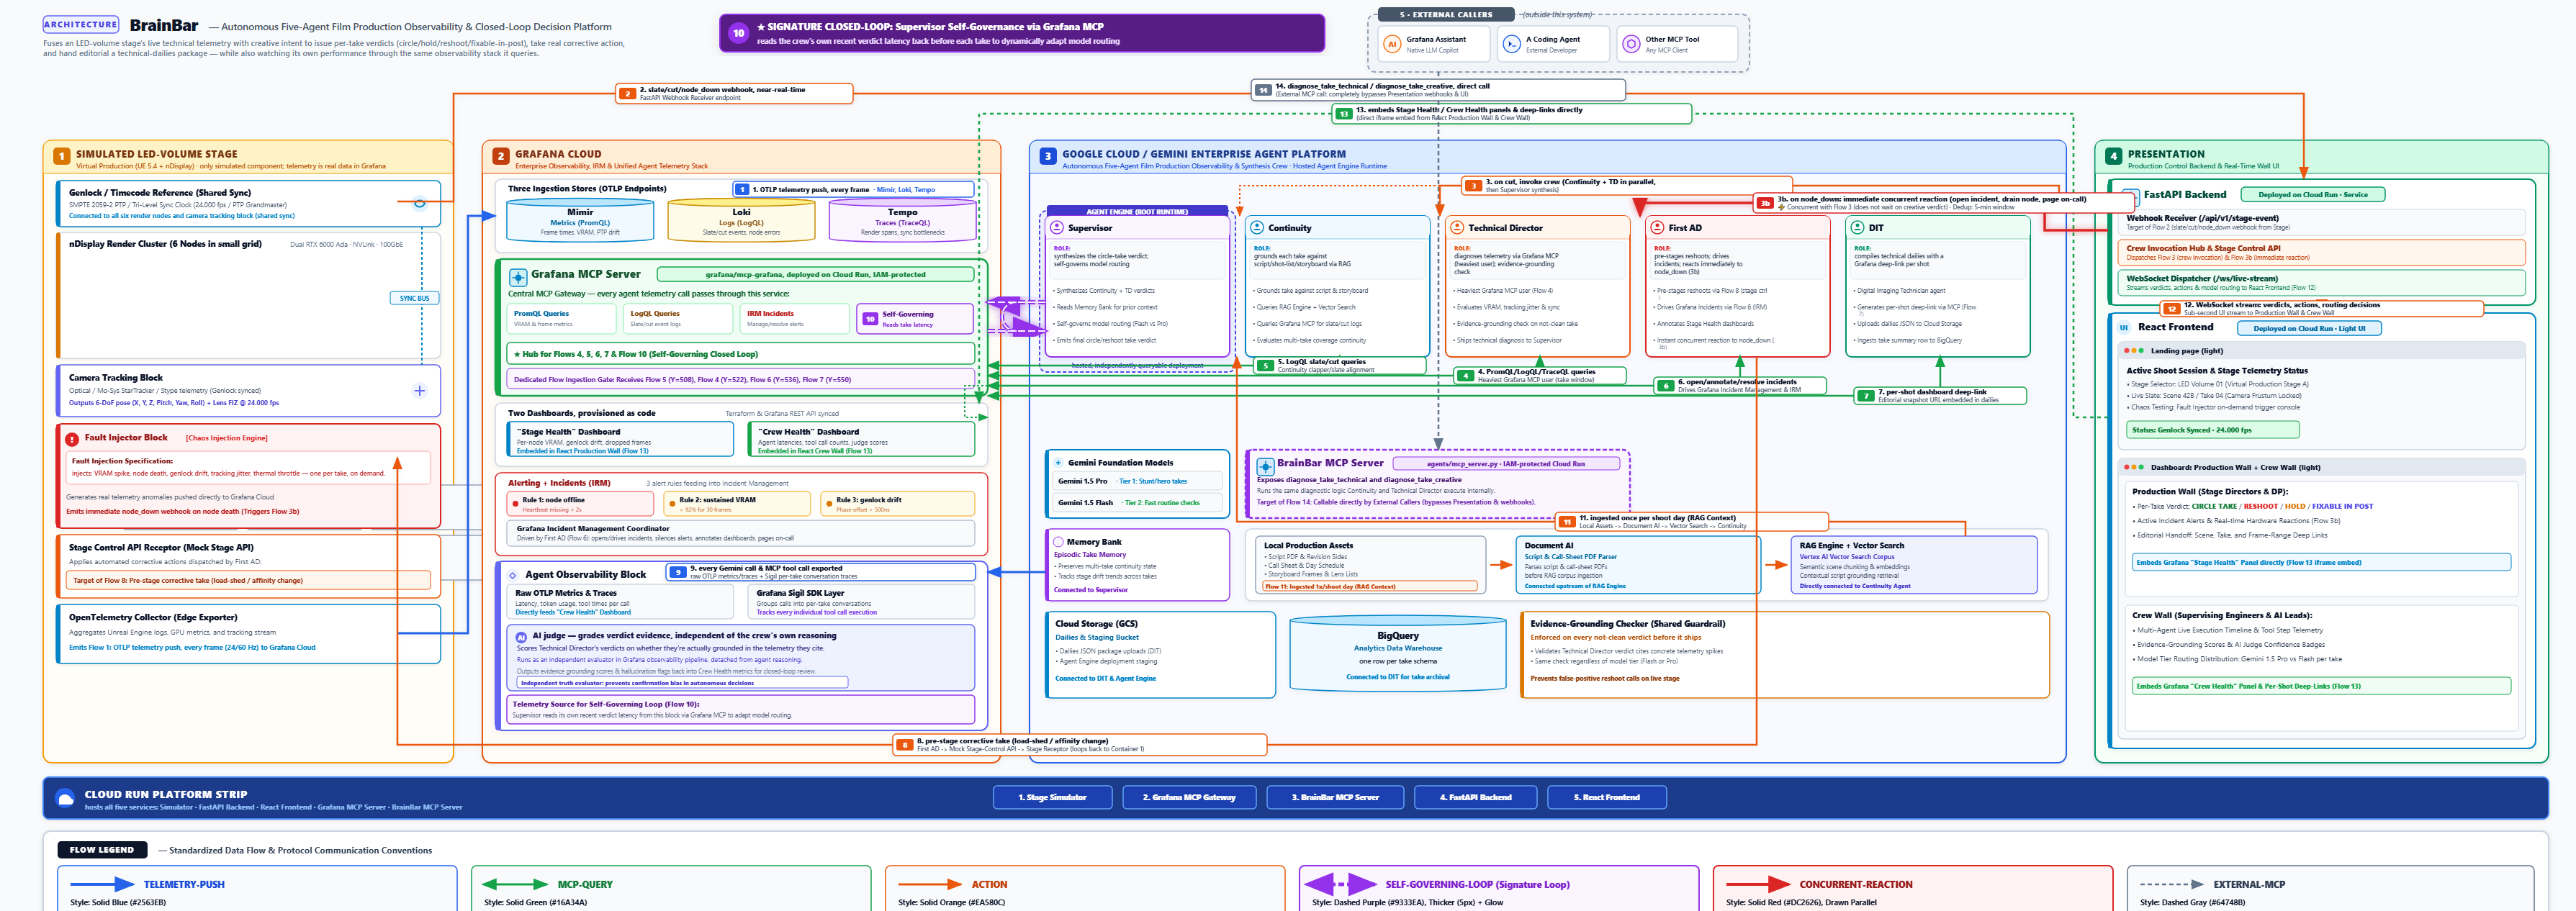
The Architecture
Challenges We Ran Into
A tool call that named a metric endpoint that didn't exist. A diagnosis run
failed calling query_prometheus_range — a plausible name that simply wasn't in
the real Grafana MCP server's tool list. Fixed with precision, not a workaround:
the instruction now names the one real query tool explicitly, states exactly
which parameters it needs, and says outright never to invent a name. The same
failure now also increments a Grafana counter, so if it happens again it's a
metric, not a silent crash.
A blank string Vertex AI's own backend refused. A full end-to-end test died on a raw 400: a required search field was empty. The Supervisor had called its own memory-recall tool with a blank query, and Memory Bank's backend rejected it outright — nothing between the model and that backend was checking. Fixed at the tool boundary: a blank query never reaches Vertex AI, the tool hands the model something to react to, and it retries with a real query in the same turn.
A Python evaluation-order bug only two agents at once could expose. The
per-agent cost panel crashed with a KeyError the first time two agents had real
token data in the same request. The code read
by_agent.setdefault(agent, {...})[token_type] = by_agent[agent].get(...) —
reads like "ensure the key, then read it," but Python evaluates the right side
first, so the read happened before the key existed. It had simply never run
with two agents' data at once until it did for real.
A config value that was set correctly and used nowhere. Every take failed locally with an empty verdict, even against a healthy stack. The cause: a config flag telling the app to use Vertex AI instead of the free, rate-limited Gemini API was read correctly into our own settings object but never propagated to the real environment variable the SDK actually checks. Every local call was silently hitting a 5-request-per-minute free tier. It worked in deployment purely because that platform sets real env vars directly.
Grafana's own backend had a setup gap, not us. The first full hardware-failure scenario got four of five First AD actions right, and the fifth — opening a Grafana incident — failed with a database error inside Grafana Cloud's own service. Not our bug: Incident Response and Management had never been activated on that stack, a one-time step most teams only discover under pressure. First AD logged the failure honestly instead of pretending it worked.
Sift has no "start an investigation" tool. The instinct was to have Technical Director trigger one automatically. The Grafana MCP server has tools to read an existing investigation, none to start one. Rather than fabricate a call that would fail the same way the hallucinated Prometheus tool did, the design changed: Technical Director checks whatever investigation already exists and reconciles with it explicitly.
A function that stores a result isn't the same as one that sends it. This cost the most time, because it produced no error at all, just silence. Every call was wrapped correctly for Agent Observability and none of it showed up in Grafana. The actual cause: the method we called to hand off a result only stores it in memory — a separate method finalizes and queues it for export — and we were never calling the second one. Made worse because the app had never configured Python's own logging, so even library warnings were being dropped. Once real logs existed, the gap was obvious in a minute.
A dependency pin that only broke on a truly clean install. A fix that worked locally for over an hour still broke the next automated deploy. Locally we'd upgraded packages one at a time into an already-populated environment, which never re-checks the whole dependency tree. A real clean install — exactly what the deploy pipeline runs every time — correctly refused it: the newer telemetry library needed a version just above the ceiling the agent framework declares. Fixed by removing the unnecessary pin and letting the installer settle on the version that satisfies both.
A deploy that always shipped the previous commit. Every Cloud Run service's build pushed its image only after the whole build succeeded — meaning the deploy step in that same run could never use the image just built, only whatever a prior build had already pushed. Backend, frontend, and simulator had been silently redeploying one commit behind for as long as those pipelines existed; it only surfaced when a brand-new service had no previous image to fall back on and failed outright. Fixed by pushing explicitly before deploying, on all four services.
Accomplishments We're Proud Of
A full hardware-failure scenario ran end to end against live infrastructure. A real node death produced a real incident, a real drain, a real attempted page, and an honest report of the one action the tool genuinely couldn't complete.
The hardware reaction runs while the verdict is still being figured out. A dying node no longer waits behind a minute-plus analysis — the two run at the same time, and the verdict-time agent is told what already happened so nothing repeats.
The crew is callable from outside itself now. The same diagnosis running on every cut is also live as its own access-controlled, Model Armor-guarded MCP server — deployed, not just coded.
A real AI judge grades the crew's own reasoning, not just its output format — backed by a second, cheaper check running in our own code on every verdict.
The crew's cost is real, not estimated. Live per-agent token cost came back at a fraction of a cent per take, computed from real Grafana telemetry.
Predictive VRAM forecasting is a live query, not a slide. First AD reads a Grafana ML forecast every take and load-sheds before a node actually exhausts.
Self-governance came from a real incident, not a hypothetical. After this project's own Vertex AI quota ran out mid-shoot, the crew now exports its own quota errors as a Grafana metric and reads them back before routing to Pro again.
Every bug above was found by actually running the system, several of them invisible until two real agents ran at once, until a real clean deploy ran the exact install a laptop never does, or until a real production take was checked against Grafana Cloud instead of trusted on faith.
What We Learned
A tool parameter that's technically present isn't the same as a value that's usable — an empty string satisfies a schema and still breaks a backend expecting a real one. Validate at the tool boundary; don't trust that "provided" means "meaningful."
No errors isn't evidence of success. Storing a result and delivering it can look like one step when they're two, and you can't catch that gap without turning logging on and actually looking — the same is true of a deploy pipeline that reports success while quietly shipping last week's code.
Forecasting beats reactive alerting for the failure mode that causes the most real damage — VRAM exhaustion — and the same logic applies to actions as much as thresholds: react to a hardware failure the instant it happens, not after a slower analysis finishes.
When a platform only exposes half a feature — read tools, no write tools — build around what's actually there. Consulting an existing Sift investigation instead of faking a way to start one produced a more honest feature.
Once an agent's reasoning is trustworthy enough to act on telemetry no human is watching, keeping it reachable through only one dashboard is a self-imposed limit, not a real one.
The most valuable bugs only show up under real, concurrent, end-to-end conditions — several of ours only existed because two things that had always run separately finally ran at the same time, or because we checked the actual deployed system instead of trusting that a green build meant a correct one.
What's Next
Forecasting beyond VRAM. The same Grafana ML approach applies to frame time and genlock drift.
A wider evaluation net. The AI judge grades Technical Director specifically — Continuity's creative reasoning and First AD's action choices are the obvious next agents to hold to the same bar.
Longitudinal analytics across a whole production. BigQuery already gets one row per take; querying across a whole show's shoot days is next.
A model that's seen this stage before. Verdict history in Memory Bank and BigQuery becomes training signal for a model that starts already knowing this stage's failure patterns.
More than one stage at once. The same five agents and the same Grafana stack generalize to multiple concurrent stages on the same production.
A summary that reaches the whole crew, not just on-call. A wrap-time summary pushed to everyone who wasn't staring at the dashboard all day.
Built With
- adk
- bigquery
- cloud-build
- cloud-logging
- cloud-run
- cloud-storage
- docker
- document-ai
- fastapi
- gemini-2.5-flash
- gemini-2.5-pro
- gemini-enterprise-agent-platform
- gemini-live-api
- grafana-cloud
- grafana-cloud-pyroscope
- grafana-ml-forecasting
- hosted-supervisor-agent
- memory-bank
- opentelemetry
- react
- secret-manager
- vertex-ai-agent-engine
- vertex-ai-rag-engine
- vertex-ai-vector-search

Log in or sign up for Devpost to join the conversation.