-

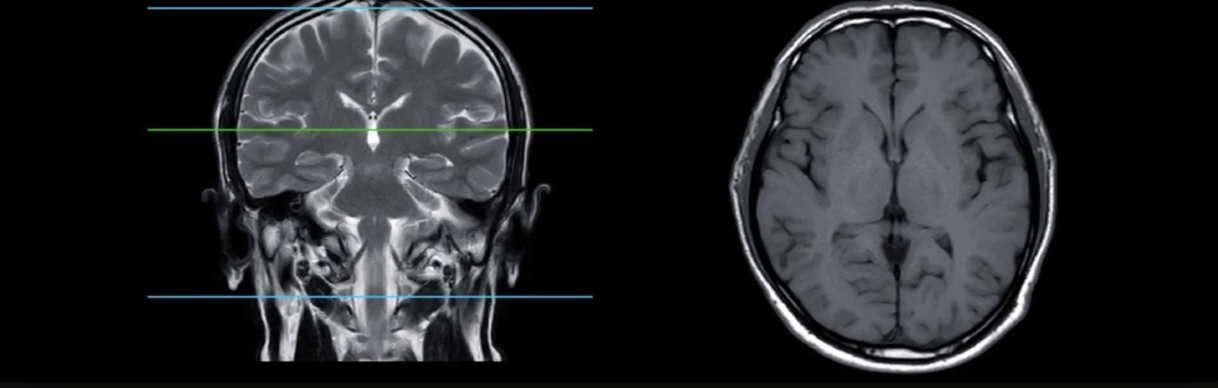
Sample MRI scan
Inspiration
Brain tumor patients often wait months between scans just to find out if their tumor is growing. That uncertainty is devastating. We wanted to build something that gives clinicians an earlier, data-driven answer so patients spend less time waiting and more time acting.
What it does
Our model analyzes 3D volumetric MRI scans to detect brain tumors and predict whether they will progress (>20% growth) or stabilize. It captures both the spatial structure of a tumor and how it changes over time, delivering a clear binary prediction to support clinical decision-making.
How we built it
We designed a hybrid CNN + LSTM architecture. The CNN extracts spatial features from 3D MRI volumes, learning tumor shape, density, and boundary characteristics. The LSTM then processes these features across sequential scans to capture temporal progression patterns. The pipeline handles volumetric preprocessing, normalization, and augmentation to work with real-world MRI data.
Challenges we ran into
Working with 3D volumetric data is computationally expensive. Balancing model complexity with training feasibility was a constant challenge. We also had to handle irregular scan intervals between patient timepoints and class imbalance between progressing and stable tumors.
Accomplishments that we're proud of
We successfully combined spatial and temporal modeling into a single end-to-end pipeline for a clinically meaningful prediction task. Framing tumor behavior as a binary progression threshold gave our model a concrete, actionable output rather than a vague risk score.
What we learned
We deepened our understanding of 3D convolutions, sequence modeling for medical imaging, and the importance of clinically grounded evaluation metrics. We also learned how much preprocessing matters when working with MRI data in the real world.
What's next for Brain Tumor Classification Model
We want to validate on larger, multi-institutional datasets, incorporate additional modalities like contrast-enhanced MRI, and explore explainability tools so oncologists can see which regions drove the prediction.
Built With
- 3d-cnns
- google-colab
- lstm
- nibabel
- numpy
- python
- pytorch
- scikit-learn

Log in or sign up for Devpost to join the conversation.