-
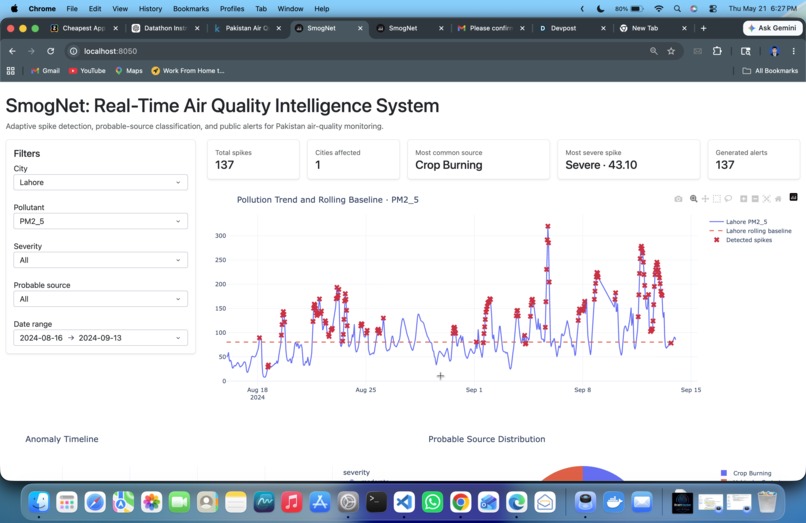
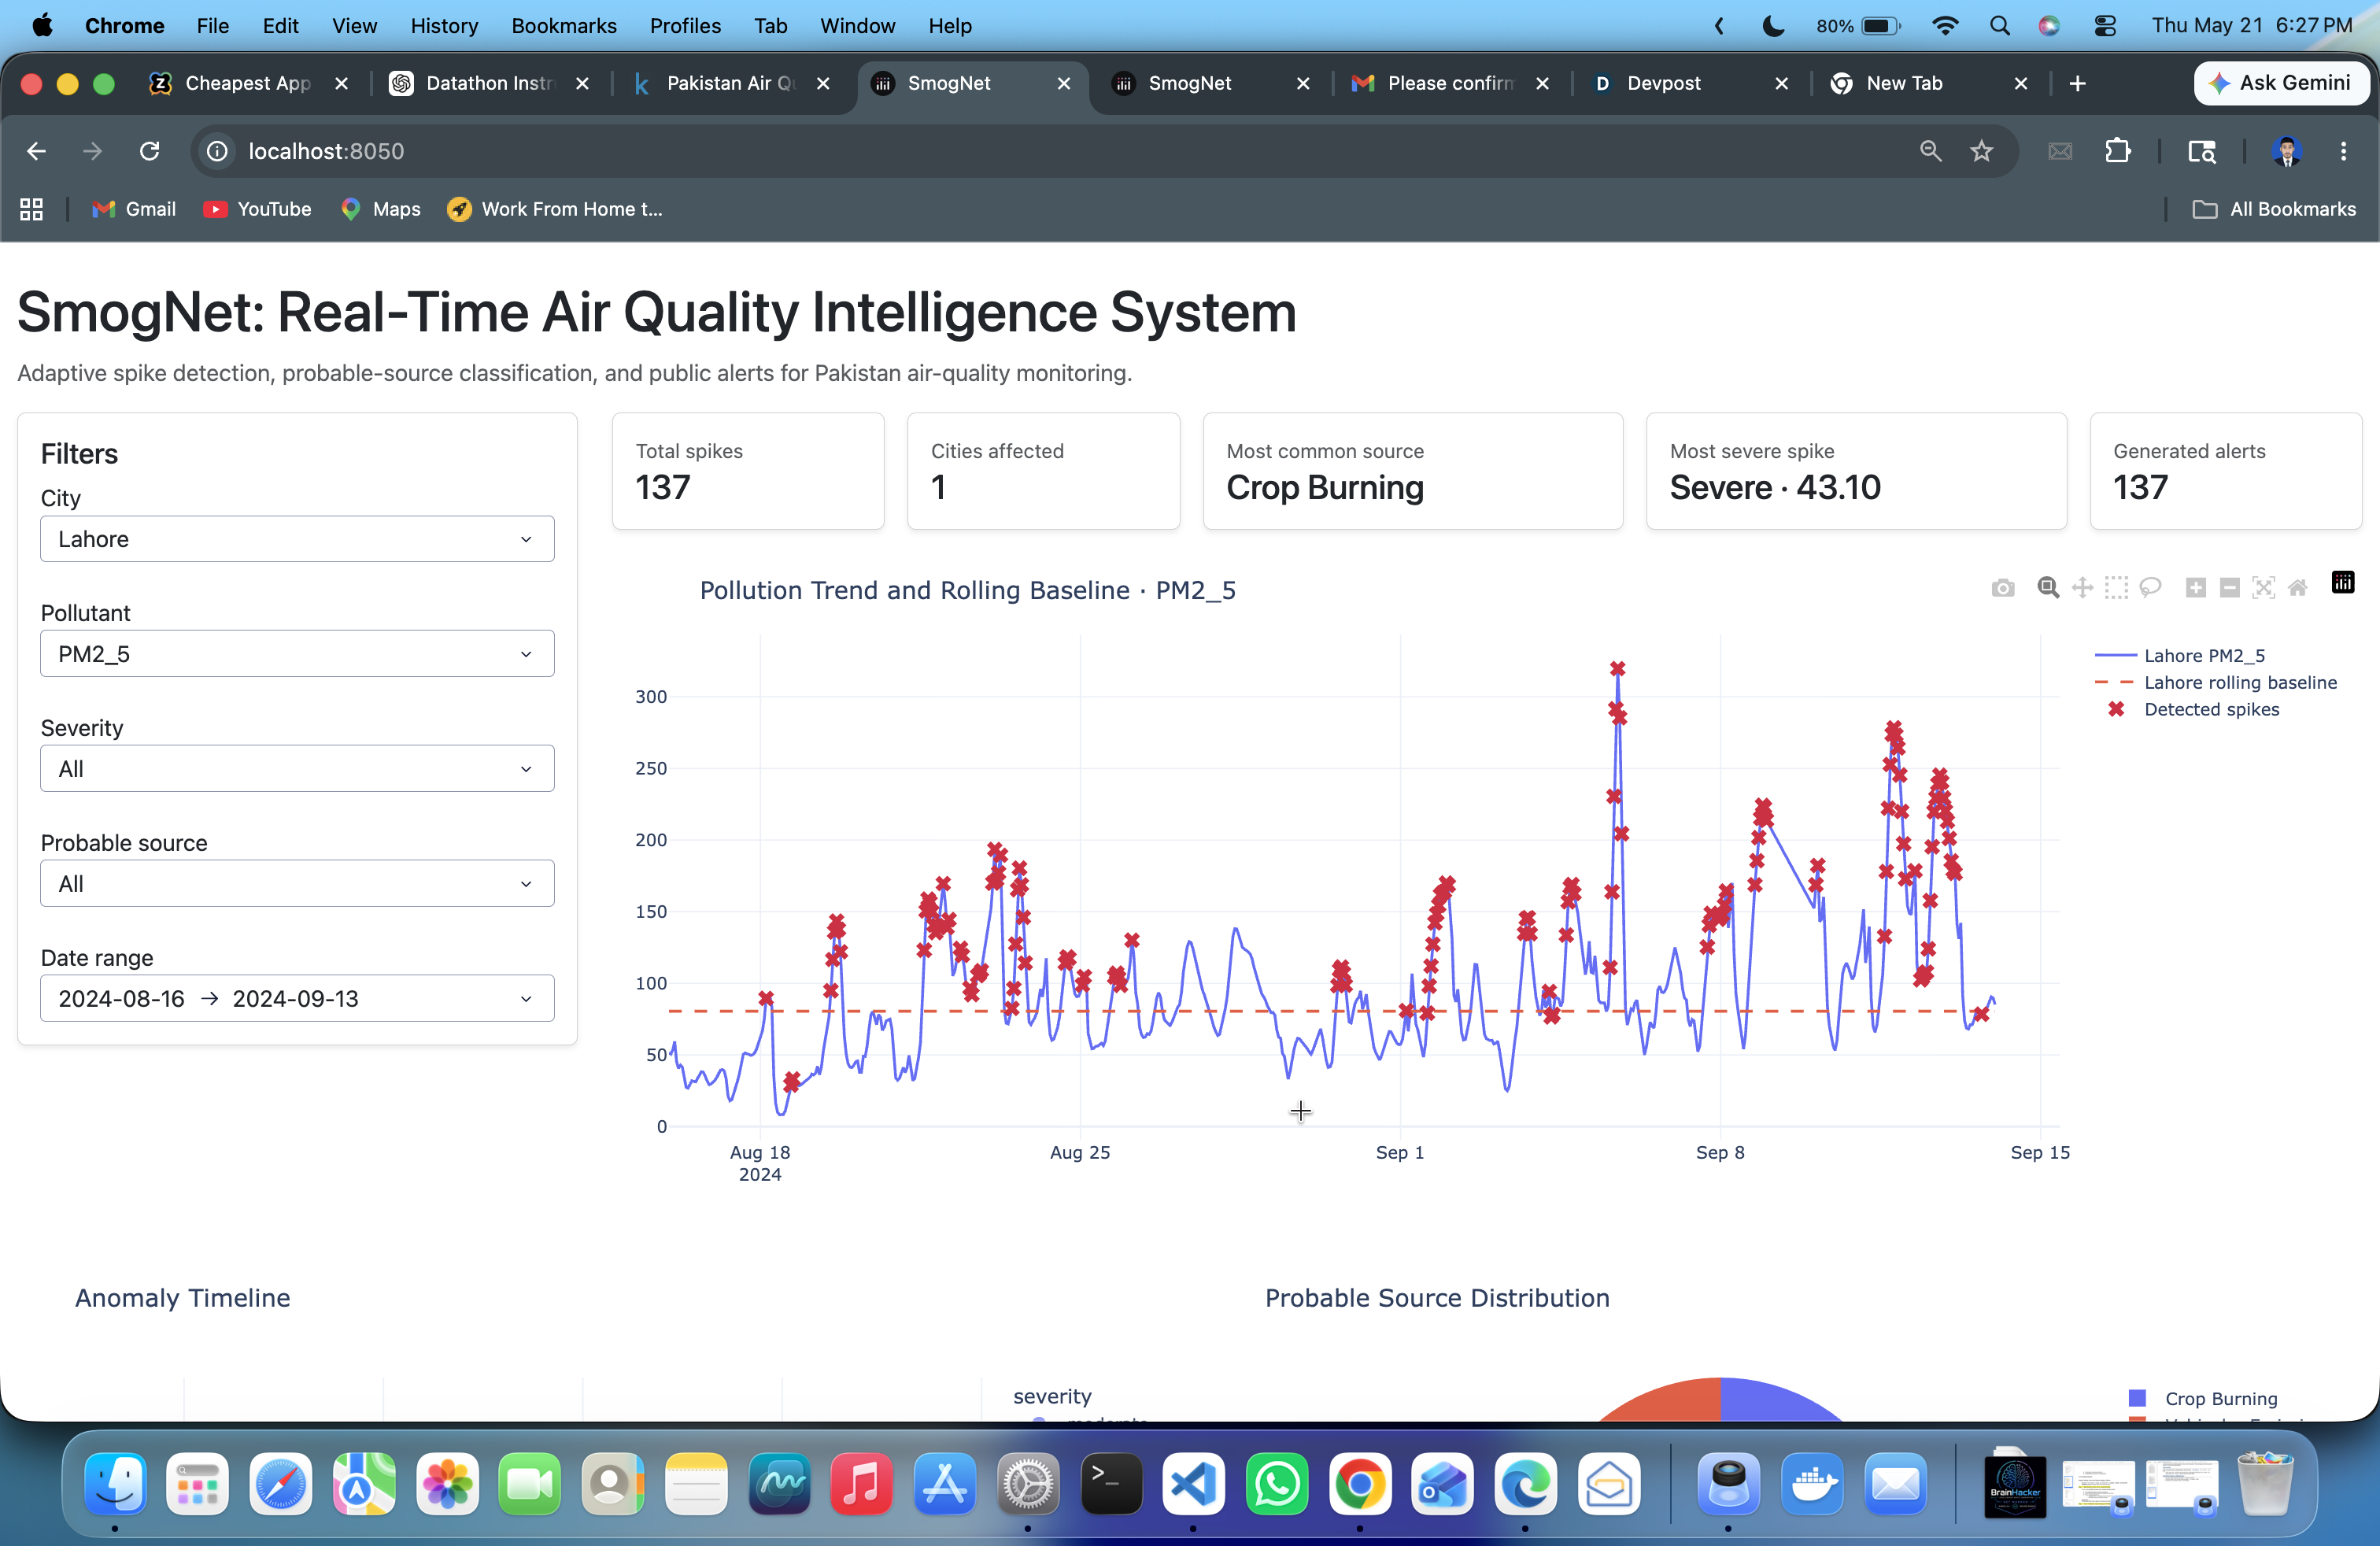
Dashboard
-
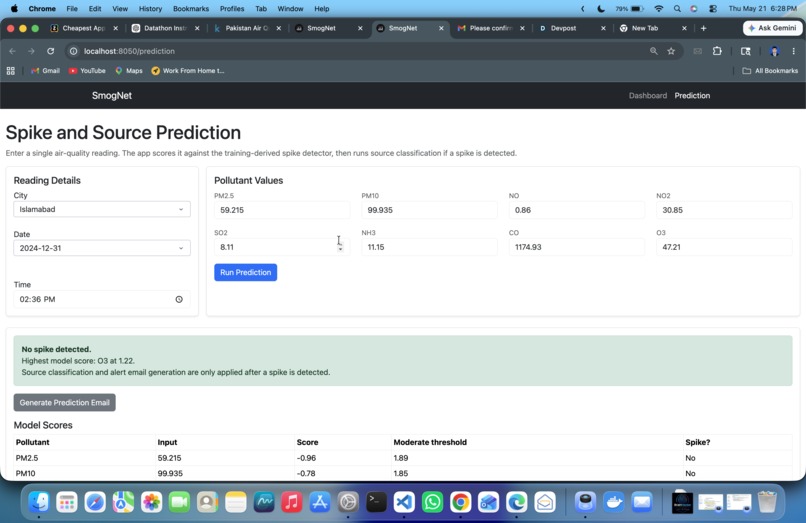
Machine Learning Model Prediction
-
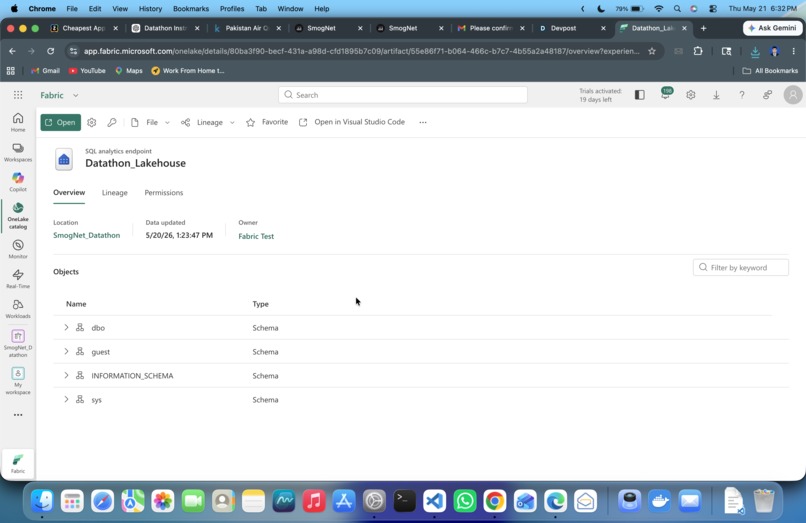
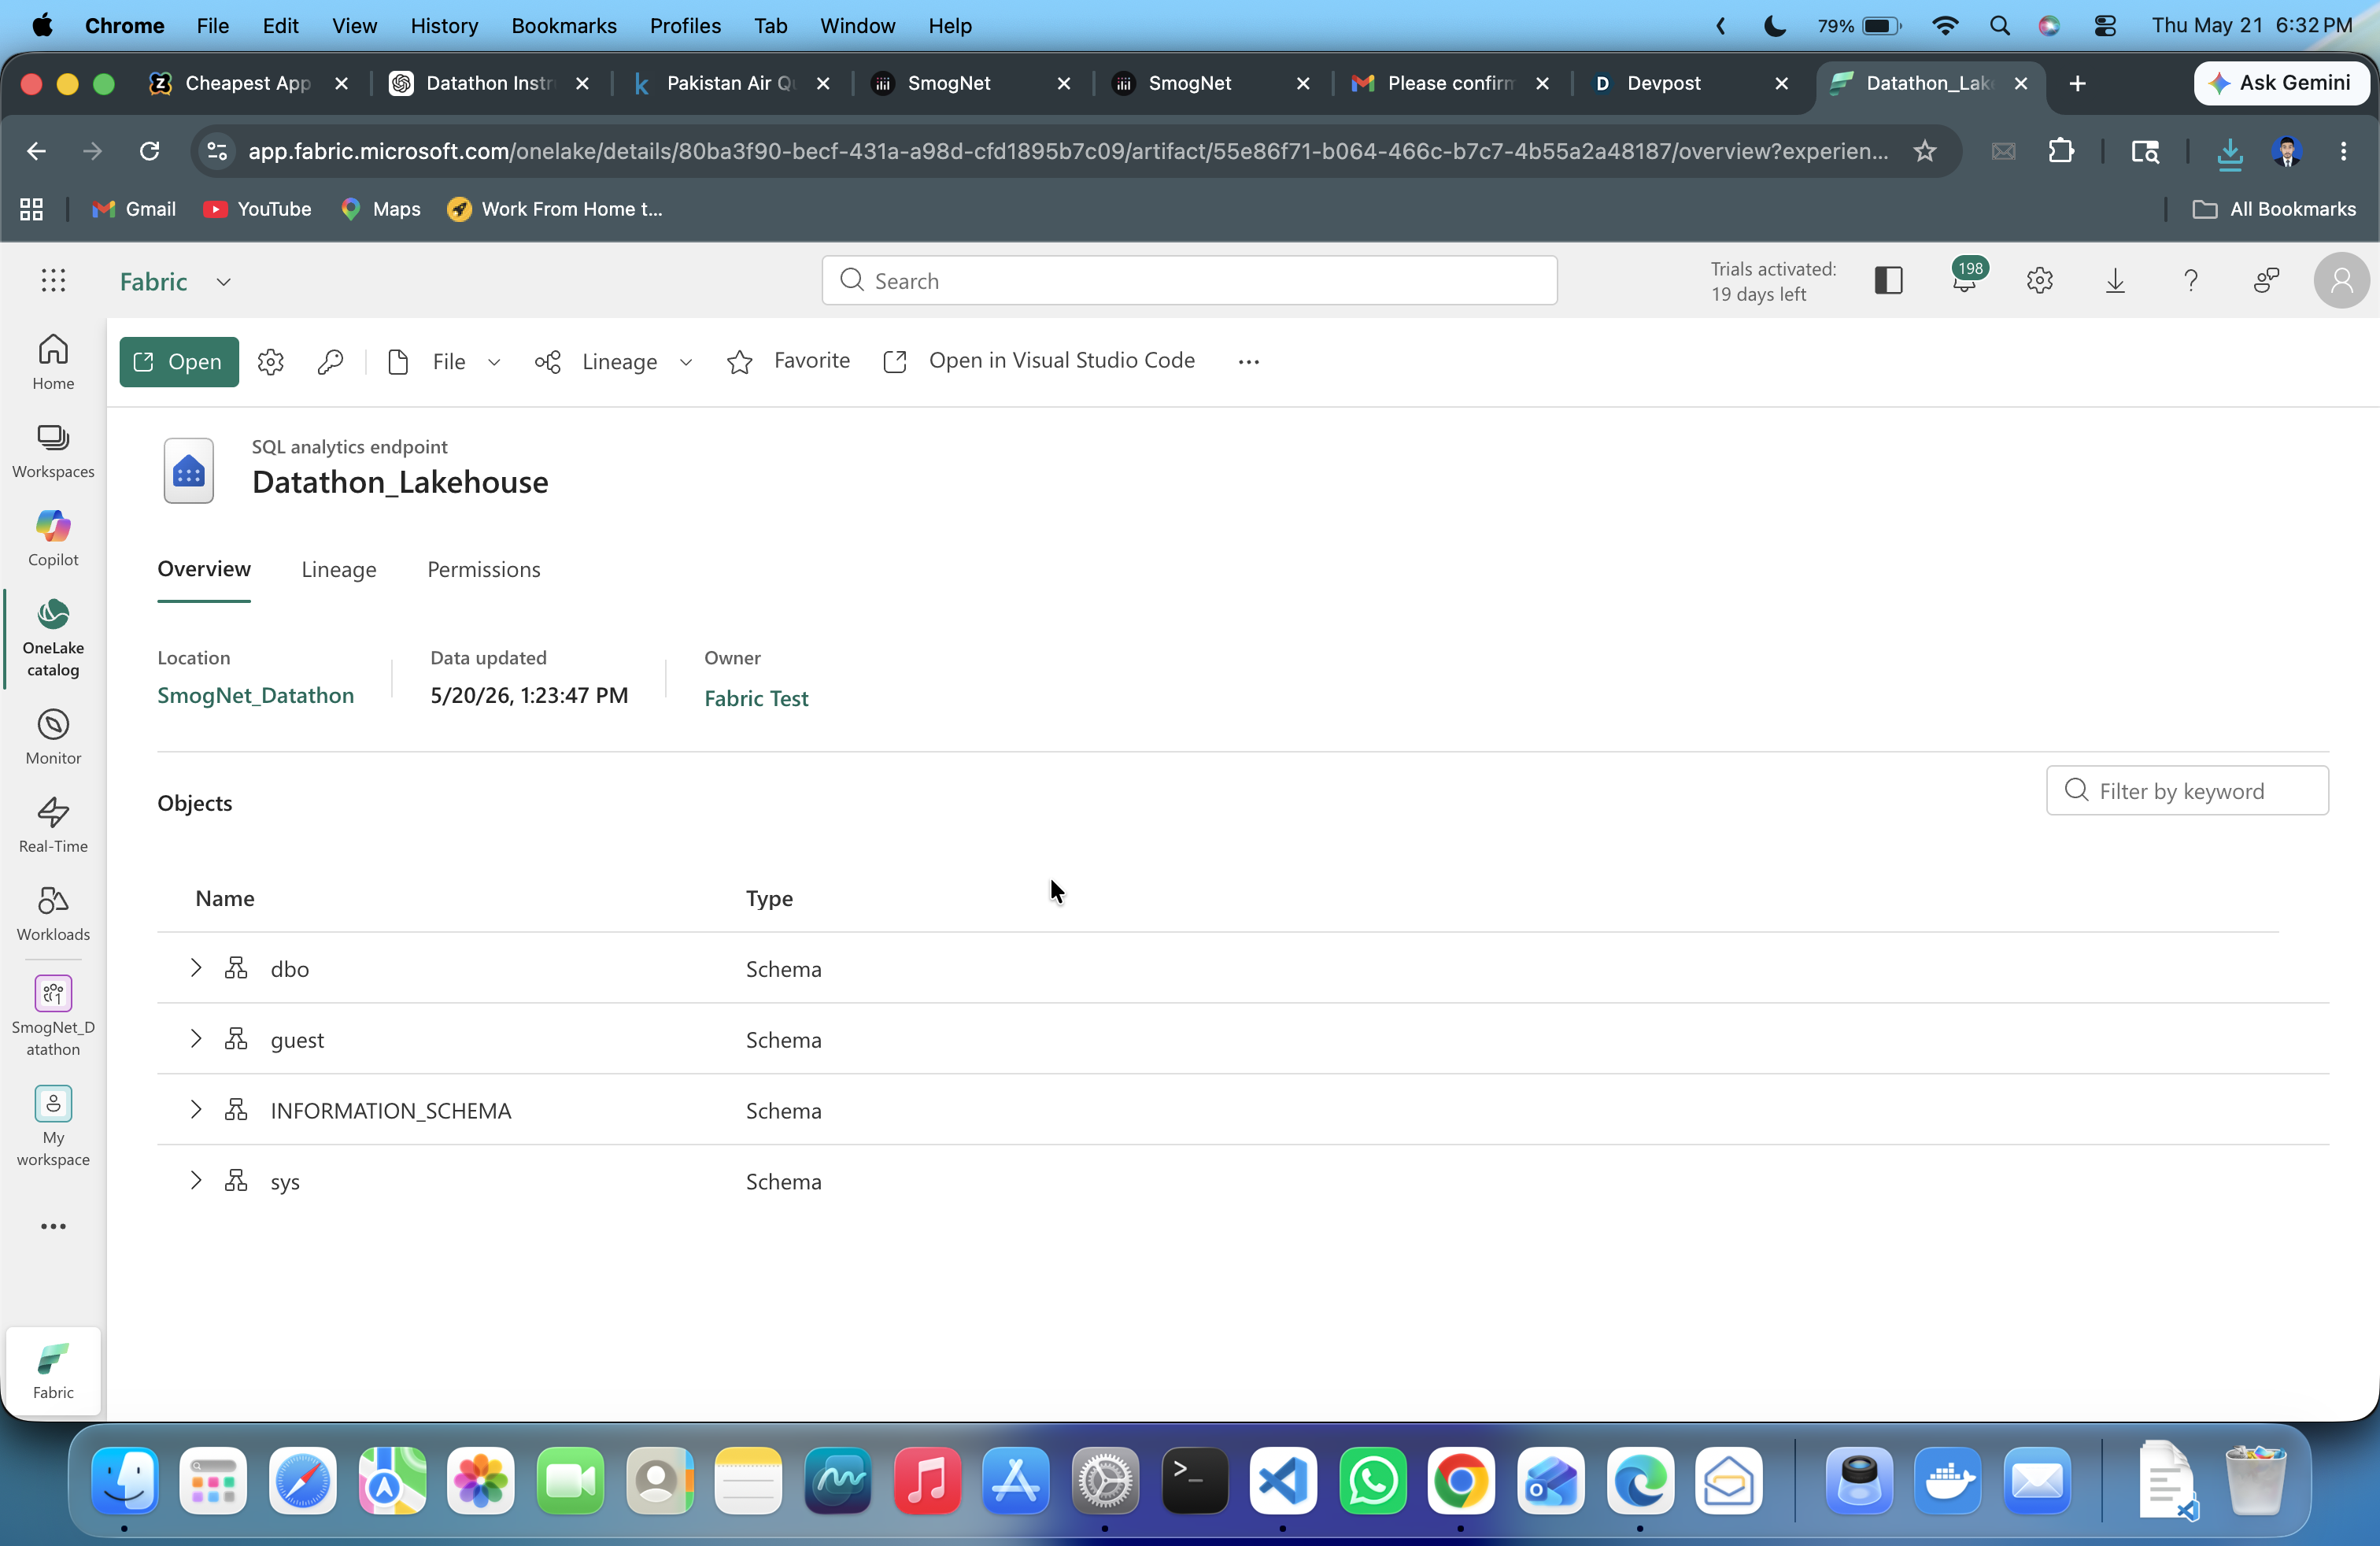
Data Lake House
Inspiration
Smog episodes are not just numbers on an air-quality chart. They affect school days, commutes, outdoor workers, elderly people, children, and patients with heart or lung conditions. We wanted to build something that could look at pollution data the way a public-health team would: not only asking whether a pollutant is high, but asking whether it is unusually high for that city, season, and historical context.
That became the inspiration for SmogNet, an interpretable air-quality intelligence system for Pakistan's pollution data. Our goal was to turn raw pollutant readings into clear spike detection, probable source reasoning, and public alerts that people could actually understand.
What it does
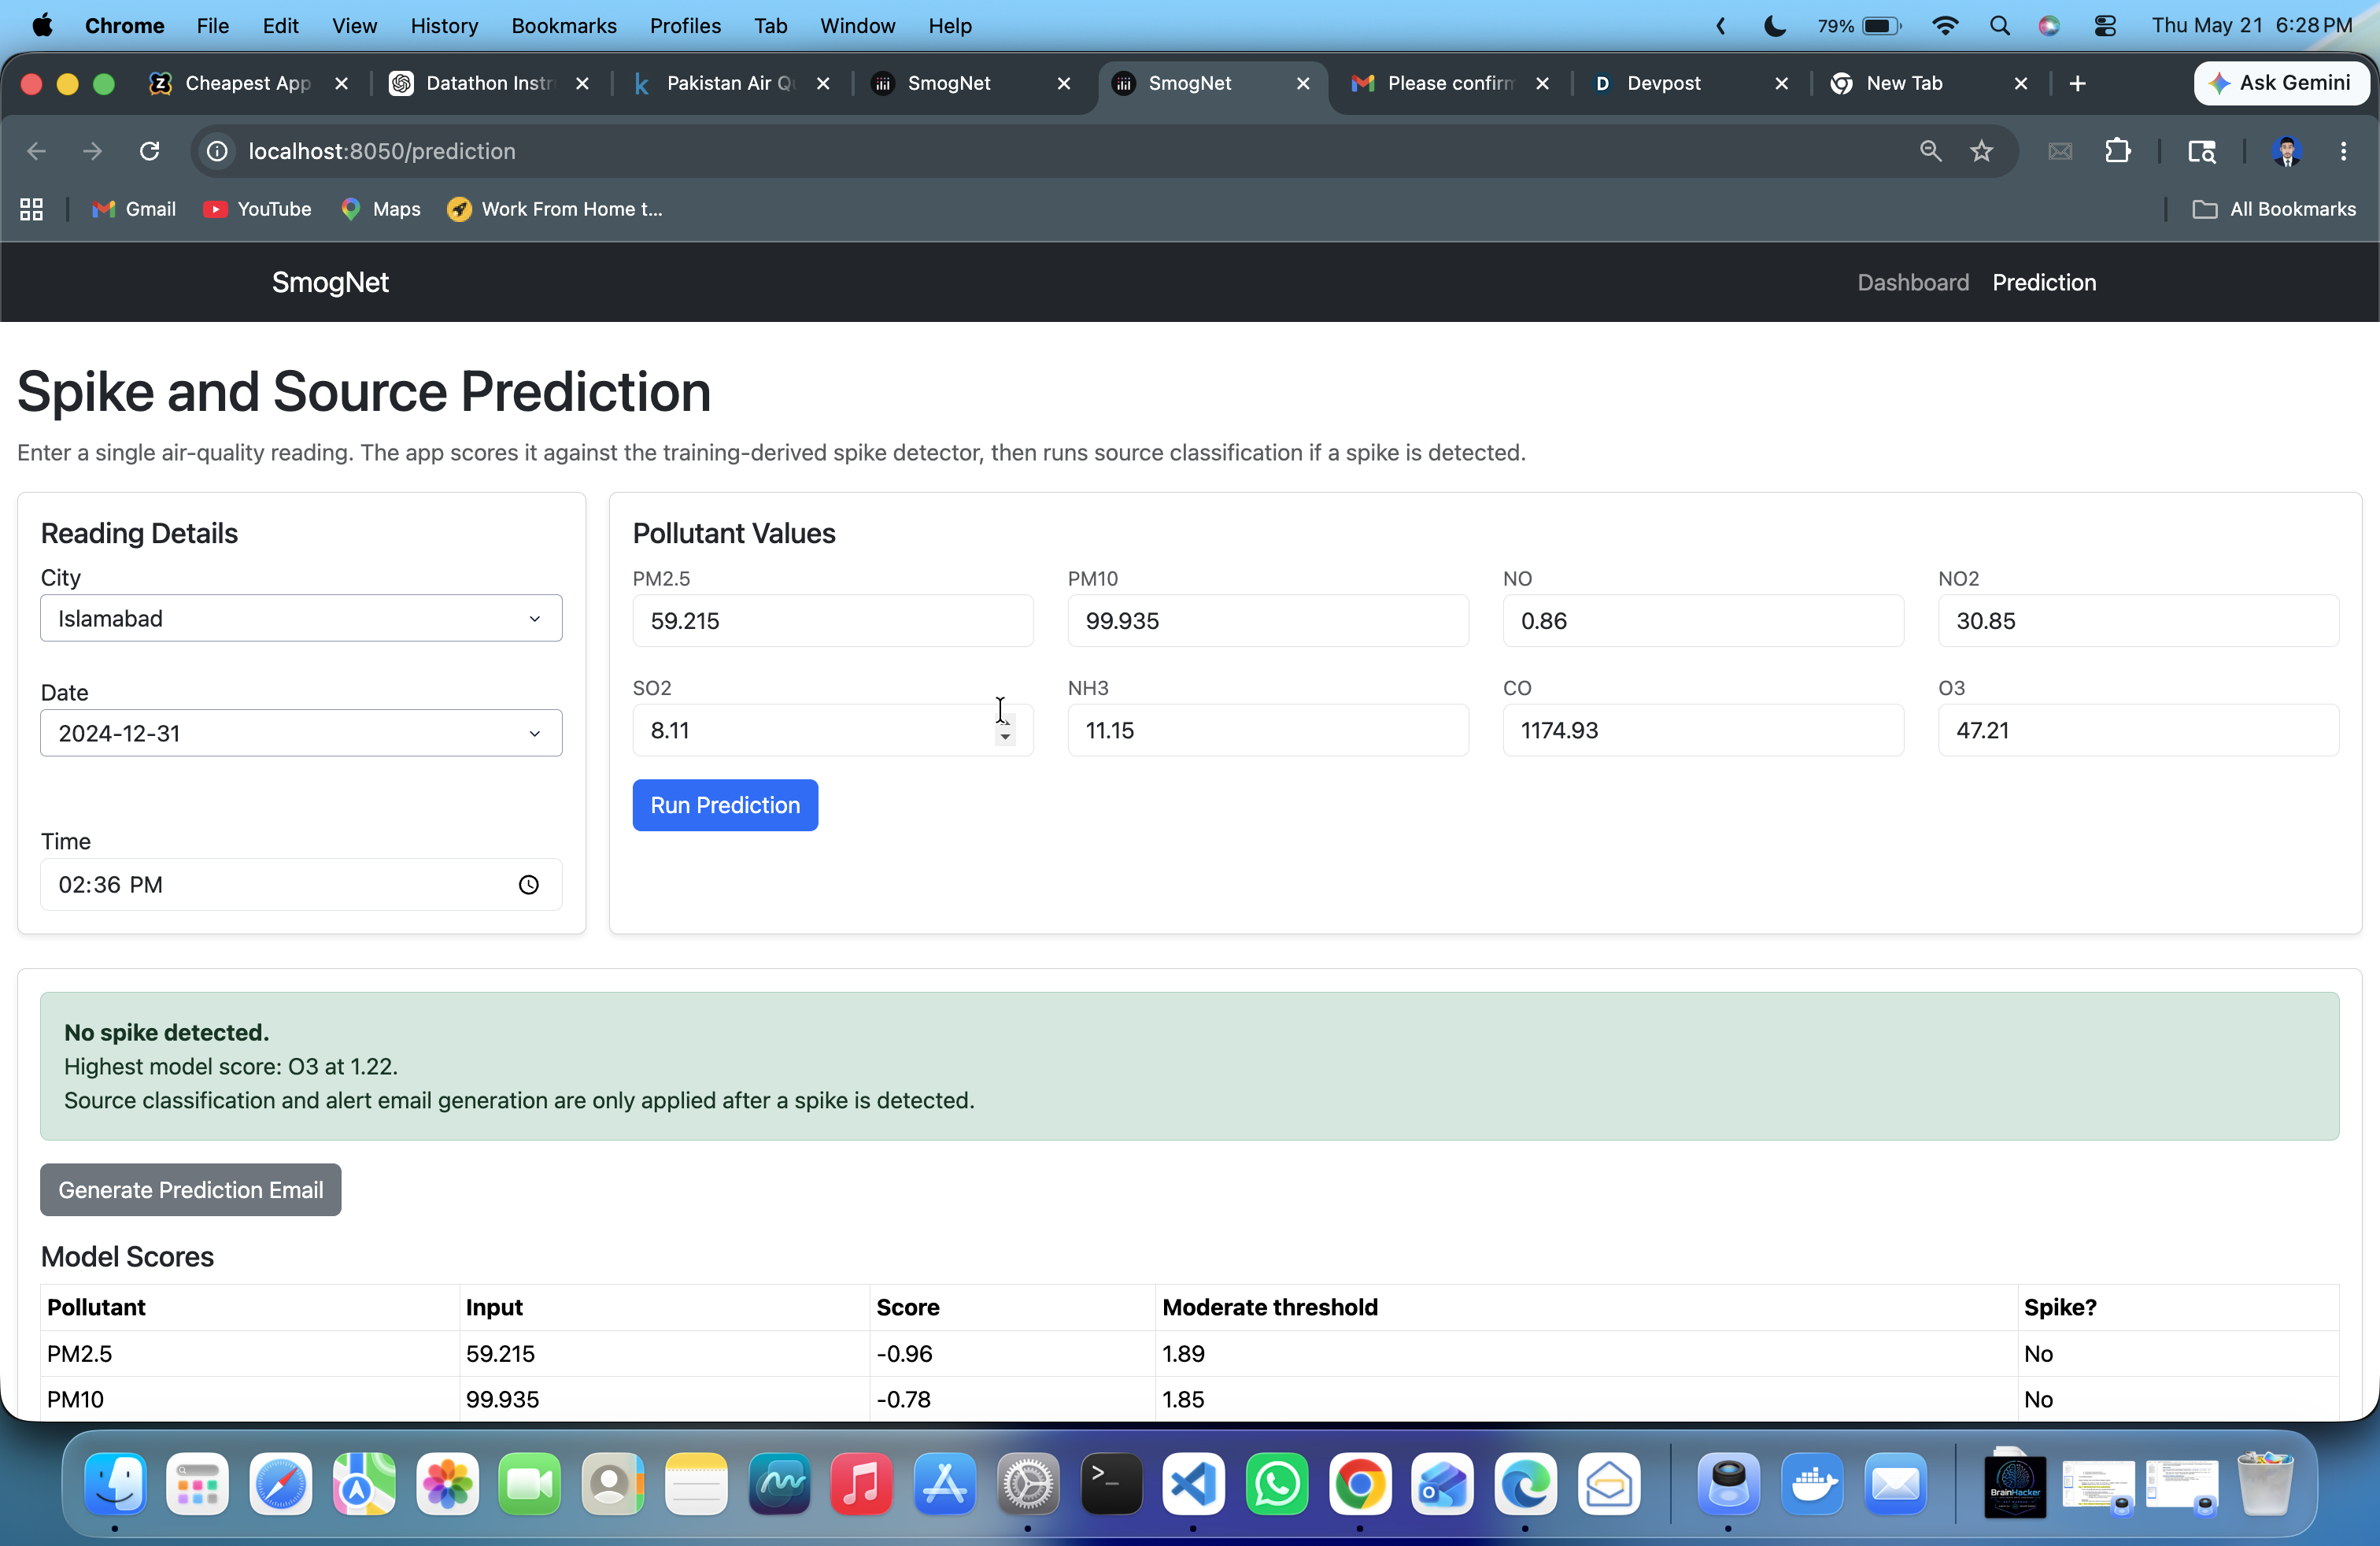
SmogNet detects abnormal pollution spikes across cities, explains which pollutant is driving the event, estimates the probable source, and generates a calm public-health alert.
The system answers four practical questions:
- When did pollution become abnormal for this city and season?
- Which pollutant pattern most likely explains the spike?
- How severe is the event compared with historical behavior?
- What should the public be told right now?
Instead of using one fixed pollution cutoff for every city, SmogNet learns local behavior from training data. The main anomaly score is:
$$ \text{score} = \frac{x - \text{rolling median}}{\max(\text{rolling IQR}, \epsilon)} $$
Thresholds are learned from training score quantiles:
$$ \text{moderate}=q_{0.95}, \quad \text{high}=q_{0.975}, \quad \text{severe}=q_{0.99} $$
After detecting a spike, SmogNet classifies probable sources using interpretable pollutant fingerprints such as NH3 + CO for crop burning, NO + NO2 for vehicular emissions, SO2 for industrial emissions, and PM10/PM2.5 ratios for dust events. The dashboard then presents KPIs, trend charts, anomaly markers, source summaries, city comparisons, public alerts, and a simulated near-real-time prediction panel.
How we built it
We built SmogNet as an end-to-end Python pipeline and dashboard.
The pipeline starts by scanning raw CSV and Excel files, detecting timestamp, city, and pollutant columns, and normalizing inconsistent pollutant names such as PM2.5, PM25, ozone, and components_* fields. It then preprocesses the data by parsing timestamps, assigning seasons, sorting by city and time, interpolating missing pollutant values within each city, and filling remaining gaps with city and global medians.
For spike detection, we used robust statistical modeling instead of a black-box classifier. SmogNet computes rolling medians and rolling IQRs for each pollutant, learns city-season baselines from training data only, and falls back to broader references when a city-season group has too little history:
- city + season
- city
- global + season
- global
For source classification, we used transparent rule-based pollutant fingerprints because the dataset does not provide confirmed source labels. We intentionally report a probable source, not a confirmed cause.
Finally, we built an interactive Plotly Dash dashboard so judges and users can explore spikes by city, pollutant, severity, source, and date. We also added deterministic public alert generation so the same event always produces a clear, validated message for vulnerable groups.
Challenges we ran into
One major challenge was that air-quality data is messy. Column names were not guaranteed to follow one schema, cities could appear in filenames instead of a city column, and pollutant names needed normalization before modeling.
Another challenge was avoiding misleading claims. The dataset did not include ground-truth labels for anomaly events or pollution sources, so training a supervised source classifier would have required artificial labels. We chose explainability over false precision and designed a probable-source classifier based on defensible pollutant patterns.
We also had to be careful with missing values and extreme readings. High pollutant values may be real events, so we could not simply remove them as outliers. The preprocessing and rolling-IQR approach helped preserve those spikes while still making the data stable enough to model.
Accomplishments that we're proud of
We are proud that SmogNet is not just a notebook experiment. It is a complete workflow from raw files to processed data, spike detection, probable source classification, public alerts, and an interactive dashboard.
We are especially proud of the adaptive detection logic. A fixed threshold can miss context, but SmogNet asks whether a reading is unusual for its own city and season. That makes the system more realistic for a country-wide air-quality problem where Lahore in winter, Karachi in summer, and Quetta in another season may all have different baselines.
We also like that the system communicates uncertainty responsibly. It does not pretend to know the exact source of pollution. It shows the evidence, gives a probable source, and keeps public alerts calm, practical, and understandable.
What we learned
We learned that strong data projects are often less about using the most complex model and more about choosing the right model for the evidence available. For this problem, robust statistics, adaptive baselines, and transparent source rules were more appropriate than a black-box model with unsupported labels.
We also learned how important context is in environmental data. A pollutant reading only becomes meaningful when compared with time, place, season, and historical variation.
Most importantly, we learned that civic-tech systems need trust. People should be able to understand why an alert was generated, what evidence supports it, and what actions they can take next.
What's next for Brain Hackers
Next, Brain Hackers wants to make SmogNet closer to a real operational system. We would add live API ingestion from air-quality monitors, weather and wind data, satellite fire or hotspot feeds, traffic indicators, and industrial-area context to improve source reasoning.
We also want to deploy the dashboard publicly, add automated alert delivery, support multilingual public messages, and validate the model against confirmed pollution episodes when labeled event data becomes available.
Our bigger vision is to turn SmogNet into a practical decision-support tool for cleaner, faster, and more explainable air-quality response.


Log in or sign up for Devpost to join the conversation.