Inspiration
Education is moving online faster than educators can adapt. Millions of students now learn through recorded lectures, video lessons, and digital content — but not every student processes information the same way. Children with dyslexia may struggle when a lesson leans too heavily on on-screen text. Students with ADHD can disengage when visuals are static and monotonous. Learners with auditory processing disorders may miss key concepts delivered only through speech. Traditional analytics tell teachers when students click away, but never why the lesson failed to land.
We asked: what if educators could replay their lesson through a simulated human brain and literally see which cognitive channels — visual, auditory, language — light up or go dark, second by second? Meta's TRIBE v2 neural encoding model made that possible. Brain Fresh was born from the conviction that every child deserves engaging lessons, and that a faster, neuroscience-grounded feedback loop can help educators reach even the students who are hardest to reach.
What it does
Brain Fresh lets educators drag-and-drop any lesson video and receive a full neural engagement breakdown — pinpointing exactly where and why a lesson may lose students:
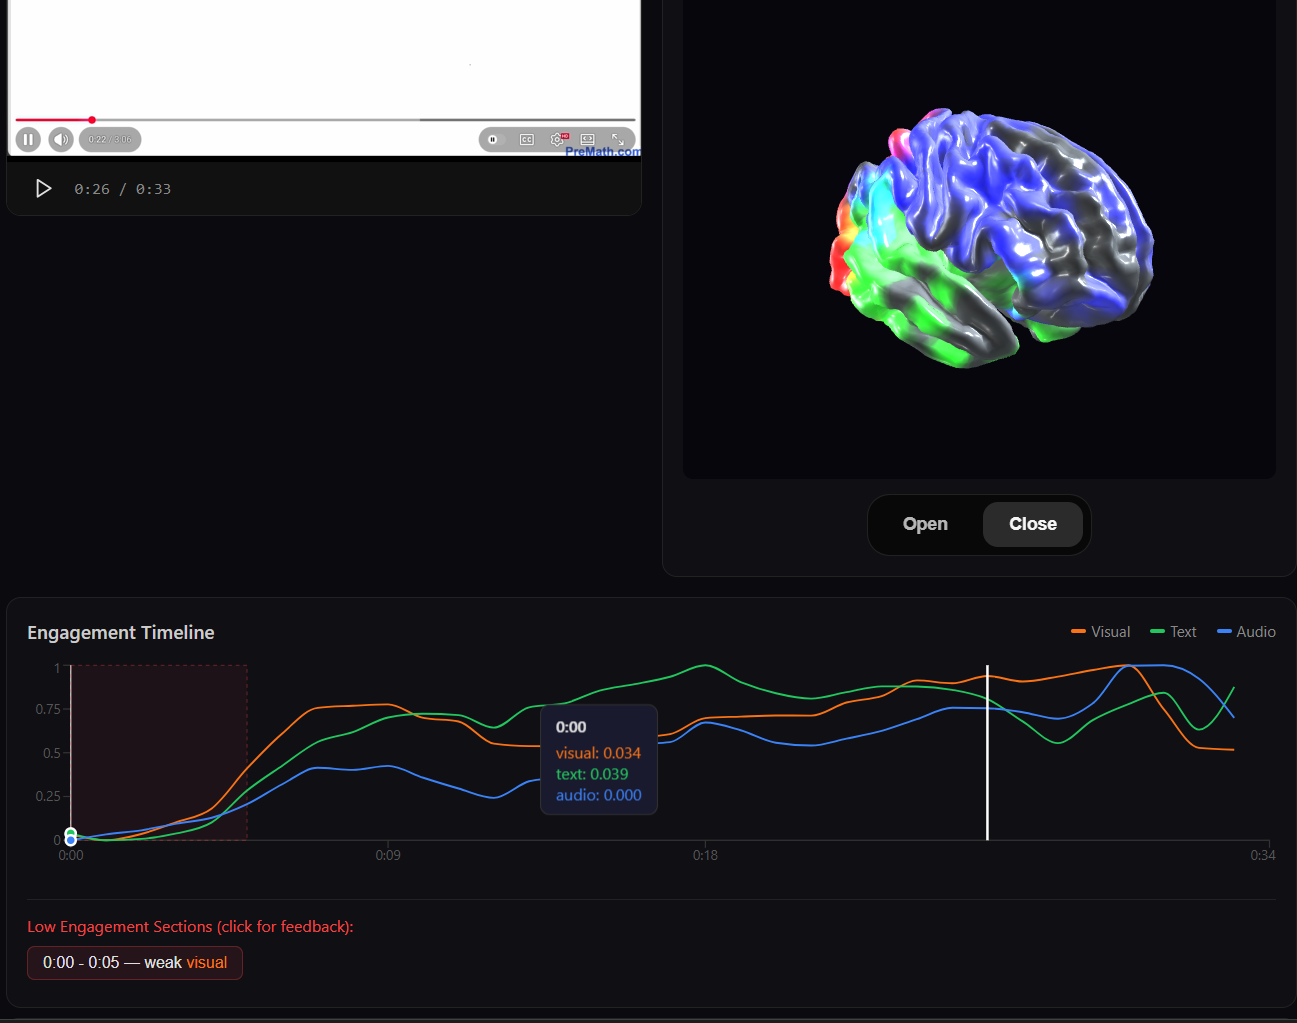
- Three-channel timeline — a synchronized line graph beneath the video plots visual, audio, and text engagement scores over time, derived from predicted brain activations in the corresponding cortical regions. An educator can instantly see, for example, that a segment relies almost entirely on spoken explanation with no visual support — a red flag for visual learners or students with auditory processing challenges.
- 3D brain visualization — a real-time Three.js cortical mesh shows activation intensity across ~10k+ vertices, updating as the video plays. Teachers can toggle modality overlays (visual / audio / text) to see which brain regions are being stimulated at any moment, building intuition for how their content engages different types of learners.
- Low-engagement detection — sections that fall in the bottom 30th percentile of combined engagement are automatically flagged on the timeline, highlighting the moments most likely to lose students' attention.
- AI-powered feedback — clicking a flagged section sends the time range, weakest modality, score, and transcript to Claude (Anthropic API), which returns targeted, educator-friendly suggestions for improving that specific segment (e.g., "this section is heavy on narration with minimal visual change — consider adding a diagram or animation to support students who are visual learners").
The result is an intuitive dashboard that turns abstract neuroscience into actionable teaching improvements — helping educators create lessons that work for every learner, not just the average one.
How we built it
Backend — Python / FastAPI / uv
- Built a FastAPI server managed with uv for dependency resolution.
- Integrated Meta's TRIBE v2 neural encoding model by loading four separate model checkpoints: one full multimodal model (for the 3D brain) and three ablated models that mask out two of three modalities each (for the individual timeline curves). This decomposition lets each timeline line reflect "what engagement looks like when only that sensory pathway is active" — critical for understanding which learners a lesson may be failing.
- The processing pipeline extracts events via TRIBE's feature extractors (audio, transcription, visual), runs prediction across all four models, builds per-second engagement scores by averaging absolute activations over anatomically-grouped vertex regions (occipital for visual, temporal for auditory, language areas for text), and normalizes to [0, 1].
- Brain activations are stride-subsampled from ~20k fsaverage5 vertices, 99th-percentile normalized, and clipped to [-1, 1] for the 3D visualization payload.
- Low-engagement sections are detected as contiguous runs below the 30th percentile threshold (minimum 3 seconds), with the weakest modality identified per section.
- Claude API (with Moonshot fallback) generates pedagogical feedback using a system prompt that positions the model as a video engagement expert interpreting neural encoding data.
- A WebSocket endpoint streams real-time processing progress to the frontend.
Frontend — React / Vite / TypeScript / Three.js / Recharts
- Drag-and-drop upload screen with a clean, modern UI designed for educators who may not be technical.
- Video player synced to a Recharts
LineCharttimeline showing three color-coded engagement lines plus highlighted low-engagement regions. Clicking anywhere on the chart seeks the video. - 3D brain model built with
@react-three/fiberanddrei, rendering a cortical mesh from a static brain-mesh JSON. Per-vertex colors are driven by TRIBE activation data at the current playhead time, with optional modality-specific RGB overlays. - Transcript panel with clickable, auto-scrolling segments synced to playback.
- Feedback panel slides in when a low-engagement section is selected, showing Claude's analysis and numbered suggestions.
- Vite dev proxy forwards
/apiand WebSocket traffic to the backend.
Infrastructure
- Colab notebook and CLI export script for GPU-based offline inference, with a JSON import path for educators or teams without local GPU access.
Challenges we ran into
- TRIBE v2 is research code, not a product SDK. Getting four separate model configurations (full + three ablated) to load and predict correctly required reverse-engineering the config update mechanism for masking individual modalities, and working around undocumented device-placement issues (e.g., MPS not supporting certain neuralset extractors).
- Mapping neuroscience to pedagogy. TRIBE outputs ~20k vertex activations per timestep — raw data that means nothing to a teacher. We had to design a meaningful reduction: anatomically-grouped region averaging for the timeline, stride-subsampled vertex data for the 3D brain, and percentile-based normalization so the visualization stays interpretable regardless of lesson length or subject matter.
- Making it accessible to non-technical educators. The UI had to communicate complex neuroscience concepts through intuitive visuals. We iterated on color coding, labeling, and the feedback panel's language to ensure a teacher with no data science background could understand and act on the results.
- Real-time synchronization. Keeping the video player, timeline chart, 3D brain, transcript panel, and feedback panel all in sync required a shared
useVideoSynchook and careful state management to avoid jank, especially with the Three.js render loop updating vertex colors every frame. - GPU accessibility. TRIBE inference is slow on CPU, so we built a Colab export workflow and a JSON import path so anyone — including teachers on a school laptop — can still experience the full product.
Accomplishments that we're proud of
- End-to-end neuroscience-to-classroom pipeline — from a raw lesson recording to predicted brain activations to a fully interactive dashboard with AI-generated teaching suggestions, all in one app.
- Modality decomposition — running three ablated TRIBE models to isolate visual, audio, and text contributions is (to our knowledge) a novel use of the model that goes beyond the original paper's evaluation. For education, this is powerful: it directly shows whether a lesson is multi-sensory enough to reach diverse learners.
- The 3D brain actually means something — it's not a gimmick. The vertex colors are real TRIBE predictions mapped onto cortical geometry, updating in real time with the video. It helps educators build genuine intuition about how their content stimulates the brain.
- Actionable feedback loop — low-engagement detection + Claude analysis turns abstract neural data into concrete suggestions an educator can apply to their next lesson immediately.
What we learned
- Neural encoding models like TRIBE v2 are powerful but designed for research benchmarks, not production pipelines. Bridging that gap requires significant engineering around device placement, feature extraction, and output interpretation.
- Reducing high-dimensional neuroscience data to intuitive visualizations is as much a design problem as a technical one — especially when your audience is educators, not data scientists. Every normalization choice and color mapping decision changes what the teacher "sees."
- Multi-sensory lesson design isn't just good practice — it's essential for inclusion. Seeing the engagement timeline flatline on one modality makes the case for diverse teaching methods more viscerally than any pedagogical paper could.
- Claude is remarkably good at generating teaching-oriented feedback when given structured context (time range, weakest modality, transcript, score) rather than vague prompts.
What's next for Brain Fresh
- Learning disability profiles — let educators select learner profiles (e.g., ADHD, dyslexia, auditory processing disorder) to weight the engagement analysis toward the modalities those students rely on most, surfacing problems that average-case analysis would miss.
- PowerPoint / slide deck support — convert presentations to video and analyze them, helping teachers improve before they ever step in front of a classroom.
- Modality-linked 3D brain — hovering over a point on the timeline highlights the corresponding cortical regions on the 3D model, making the connection between the chart and the brain tangible for educators learning how their content affects the brain.
- Comparative analysis — upload two versions of the same lesson and diff their engagement profiles to see if revisions actually improved neural engagement.
- Classroom integration — connect with LMS platforms (Google Classroom, Canvas) so educators can analyze lesson recordings directly from their existing workflow.
- Real-time processing — stream video frames through TRIBE for live feedback during lesson recording sessions.
- Export reports — generate shareable PDF/HTML engagement reports with timestamped suggestions for department heads, curriculum designers, and accessibility coordinators.
Built With
- python
- react
- tribe-v2
- typescript


Log in or sign up for Devpost to join the conversation.