-
-
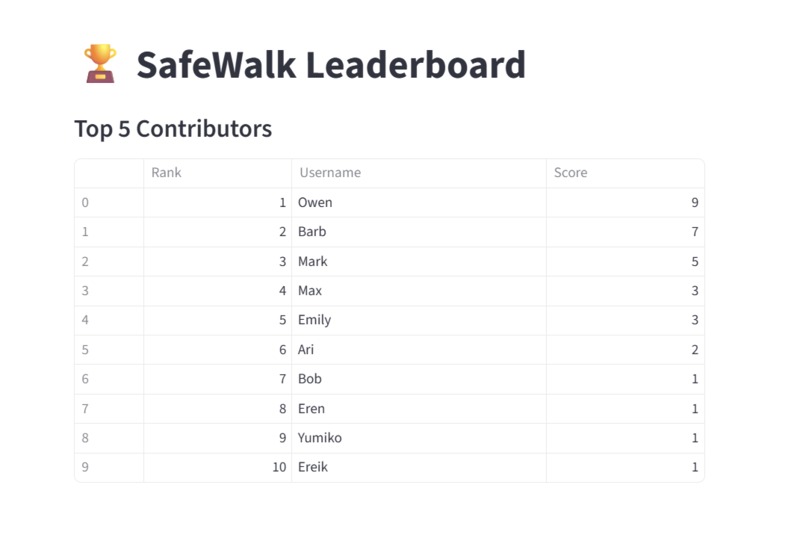
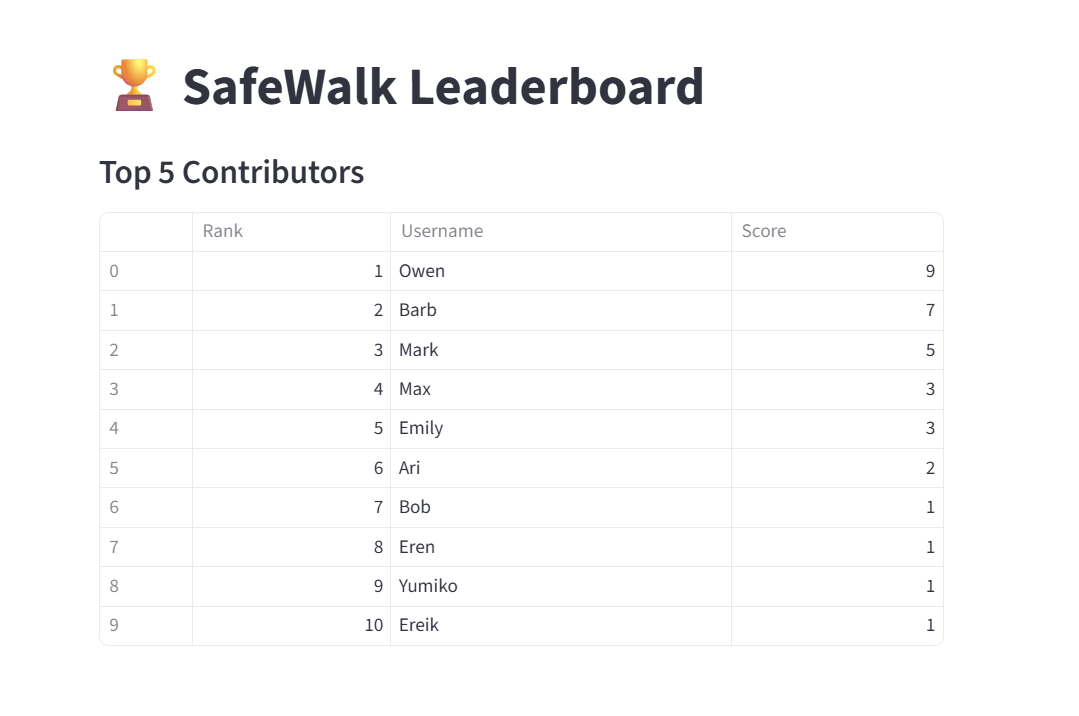
Leaderboard
-
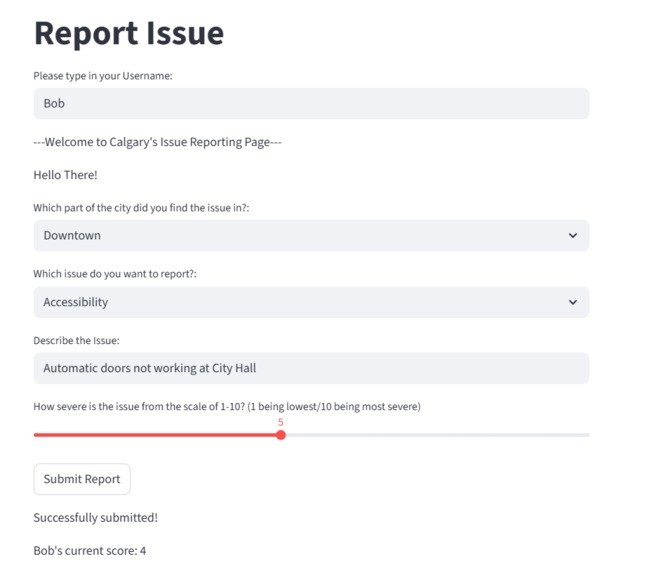
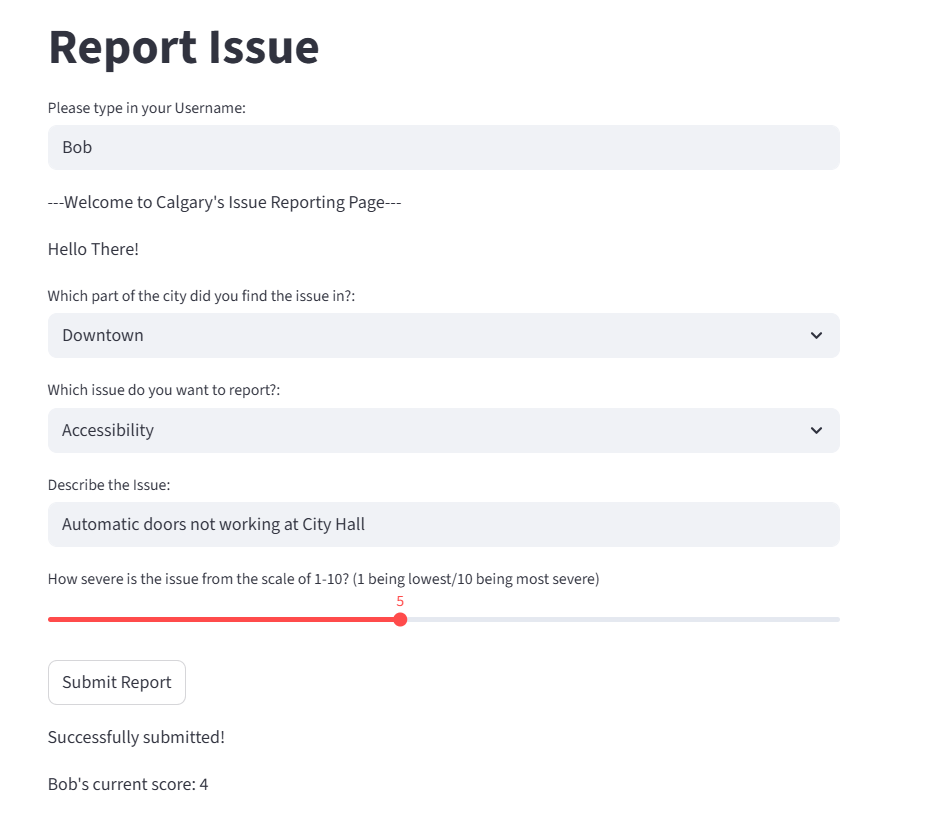
Report a Issue Form
-
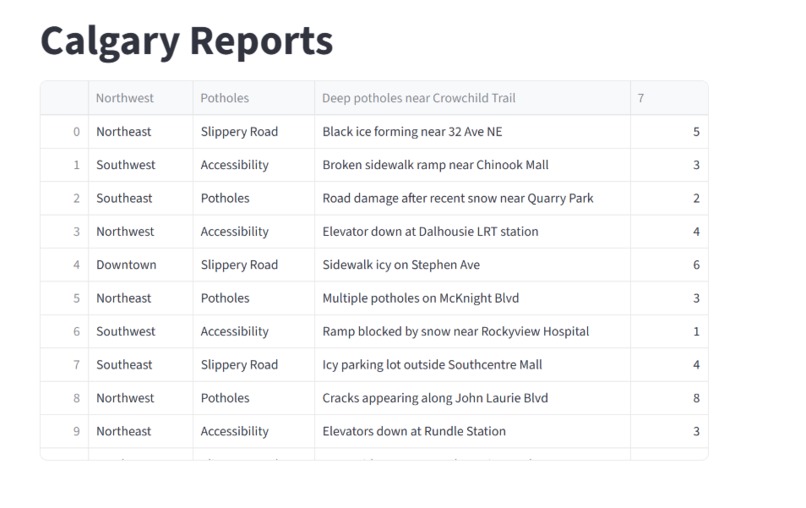
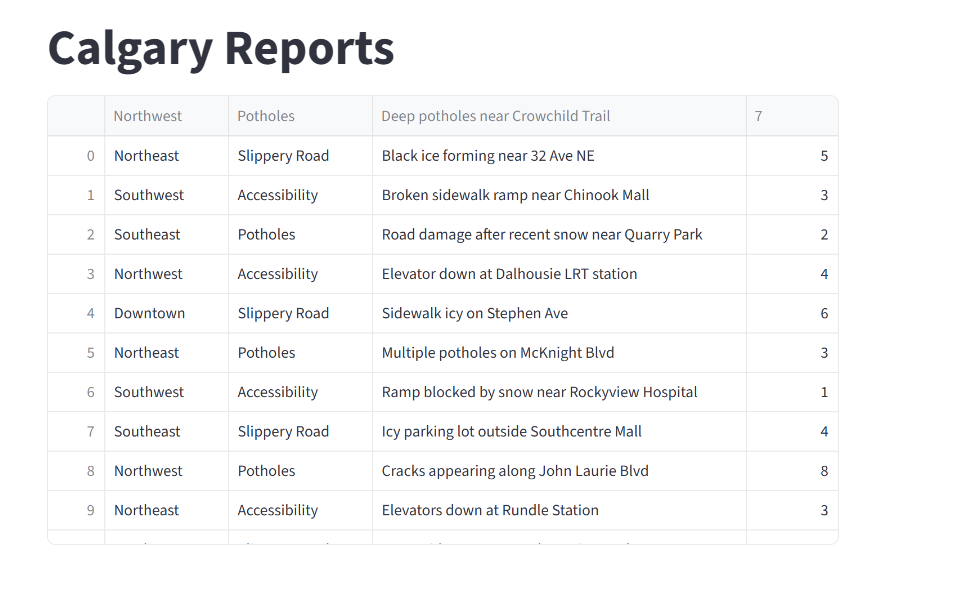
Calgary Reports
-
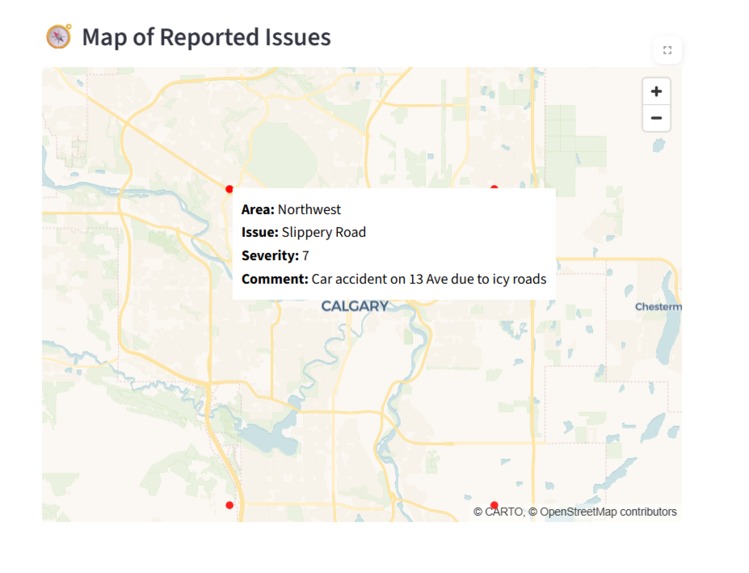
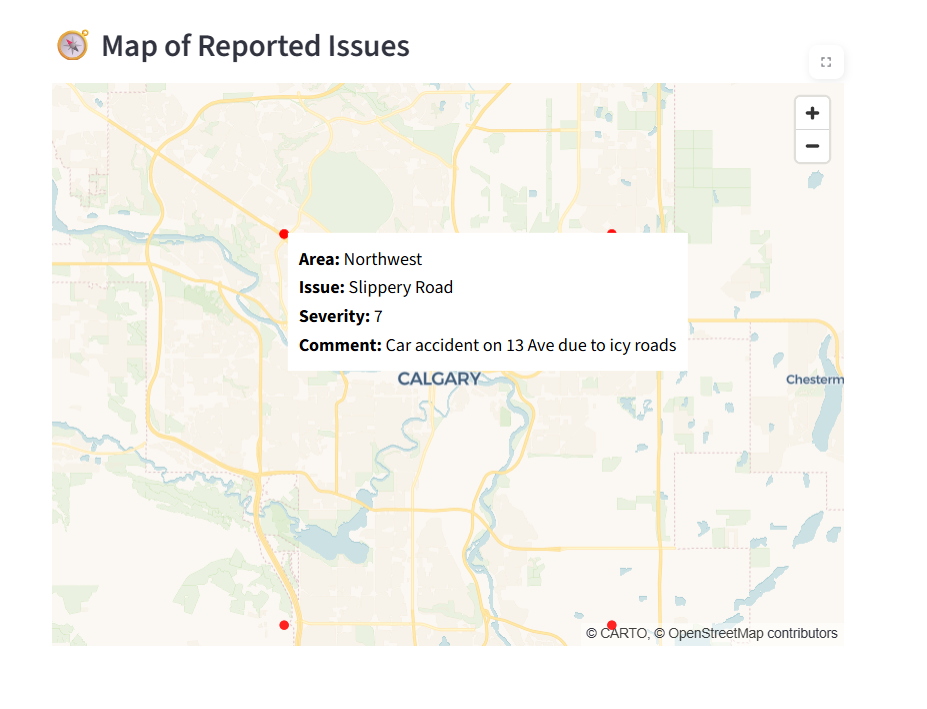
When Hovered shows the Alert Information
-
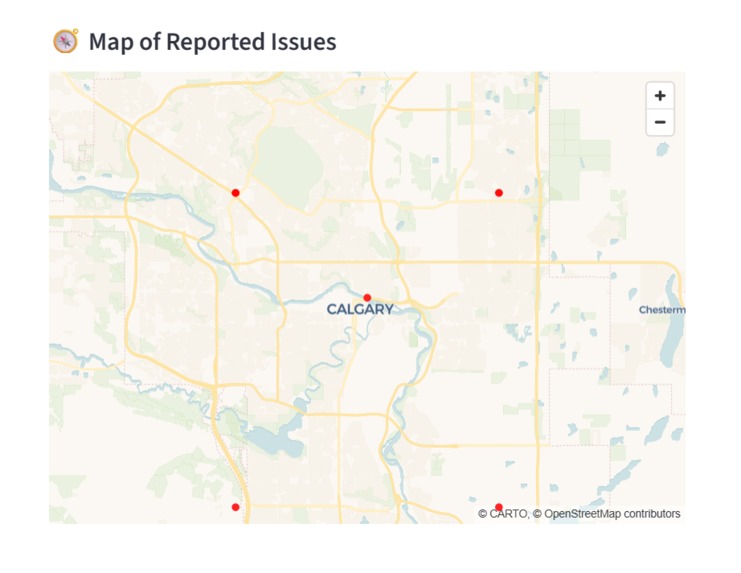
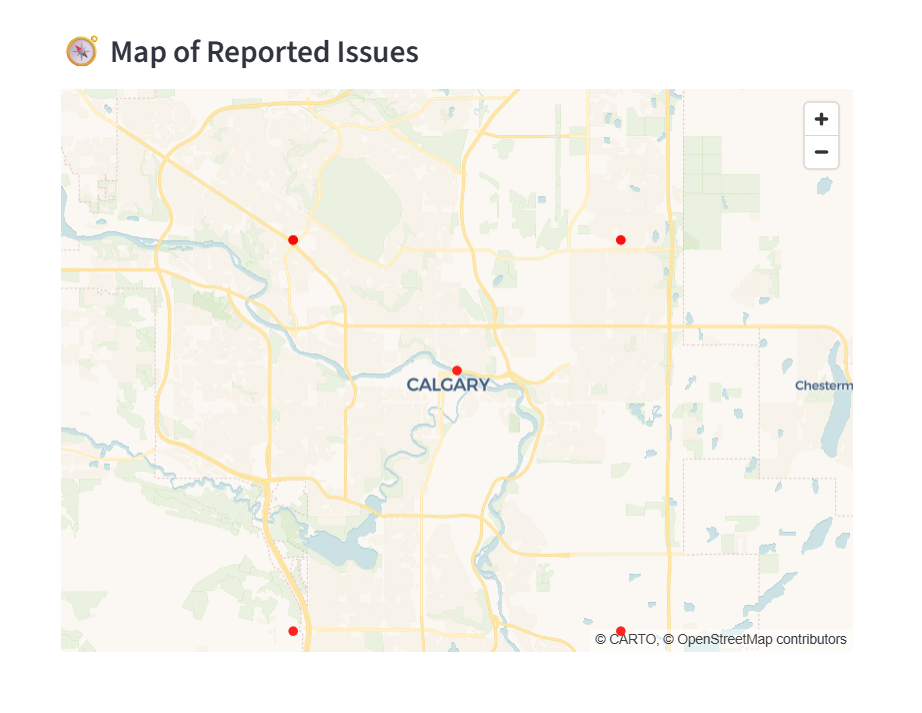
Map shows Alerts
Inspiration
We wanted to make Calgary safer. People often run into icy sidewalks, potholes, broken elevators, and other hazards — so we thought, why not let the community help each other out?
What it does
SafeWalk lets anyone report safety issues in their neighborhood. Users can add a description, severity, and exact location. All alerts show up on a live map, so everyone knows what’s happening around them. Bonus: you get points for submitting reports!
How we built it
We used Streamlit to make the app interactive and quick to use, PyDeck for the map, and simple CSV files to store reports and scores. Users can drop a pin or enter coordinates to mark the hazard.
Challenges we ran into
Making the map show pins exactly where the issues are. Getting hoverable info on pins. Figuring out how to refresh the map when new reports come in.
Accomplishments we’re proud of Live, interactive map that updates with reports. Fun point system to encourage users to report hazards. Simple, user-friendly design that anyone can use.
What we learned
How to make interactive maps in Streamlit. How to collect and manage community data. Designing for easy and fun user experience matters a lot.
What’s next for SafeWalk
Let users search addresses or click a map for faster reporting. Color-code pins by severity. Add alerts for nearby hazards in real-time. Work with city services to act on urgent reports faster, and get incidents looked over more effectively


Log in or sign up for Devpost to join the conversation.