-

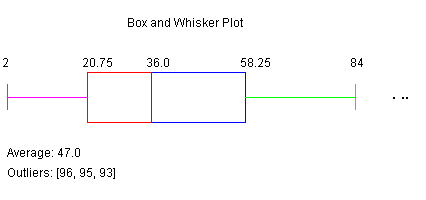
Sample box-and-whisker plot produced
Inspiration
Constantly needing to look up how to import data into excel properly, when a program could do the same thing instantly from the command line.
What it does
It takes in a data file with a single column of integers and produces a simple box-and-whisker plot, with min, Q1, Q2, Q3, and max labeled.
How I built it
Staring with a data structure for storing the data, one for computing the plot information, and one more to make the plot itself.
Challenges I ran into
Getting proper formulas for where the quartiles should be in the data set, given there are an even number, odd number, or a number divisible by 4. Properly spacing the plot, so it looked appropriate.
Accomplishments that I'm proud of
Getting most of the to-do list accomplished.
What I learned
How to use Java's JFrame to make plots that change based on what data is used.
What's next for Box-and-Whisker Plot Maker
Adding functionality to make histograms (fixed-width and fixed-frequency) and allow for datafiles with multiple columns.

Log in or sign up for Devpost to join the conversation.