-
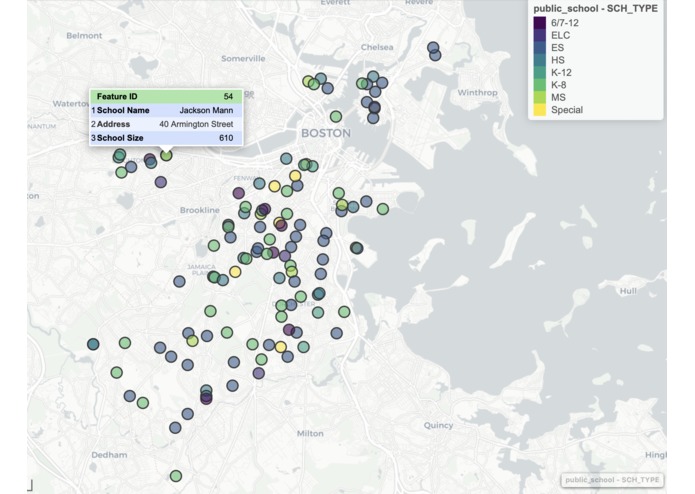
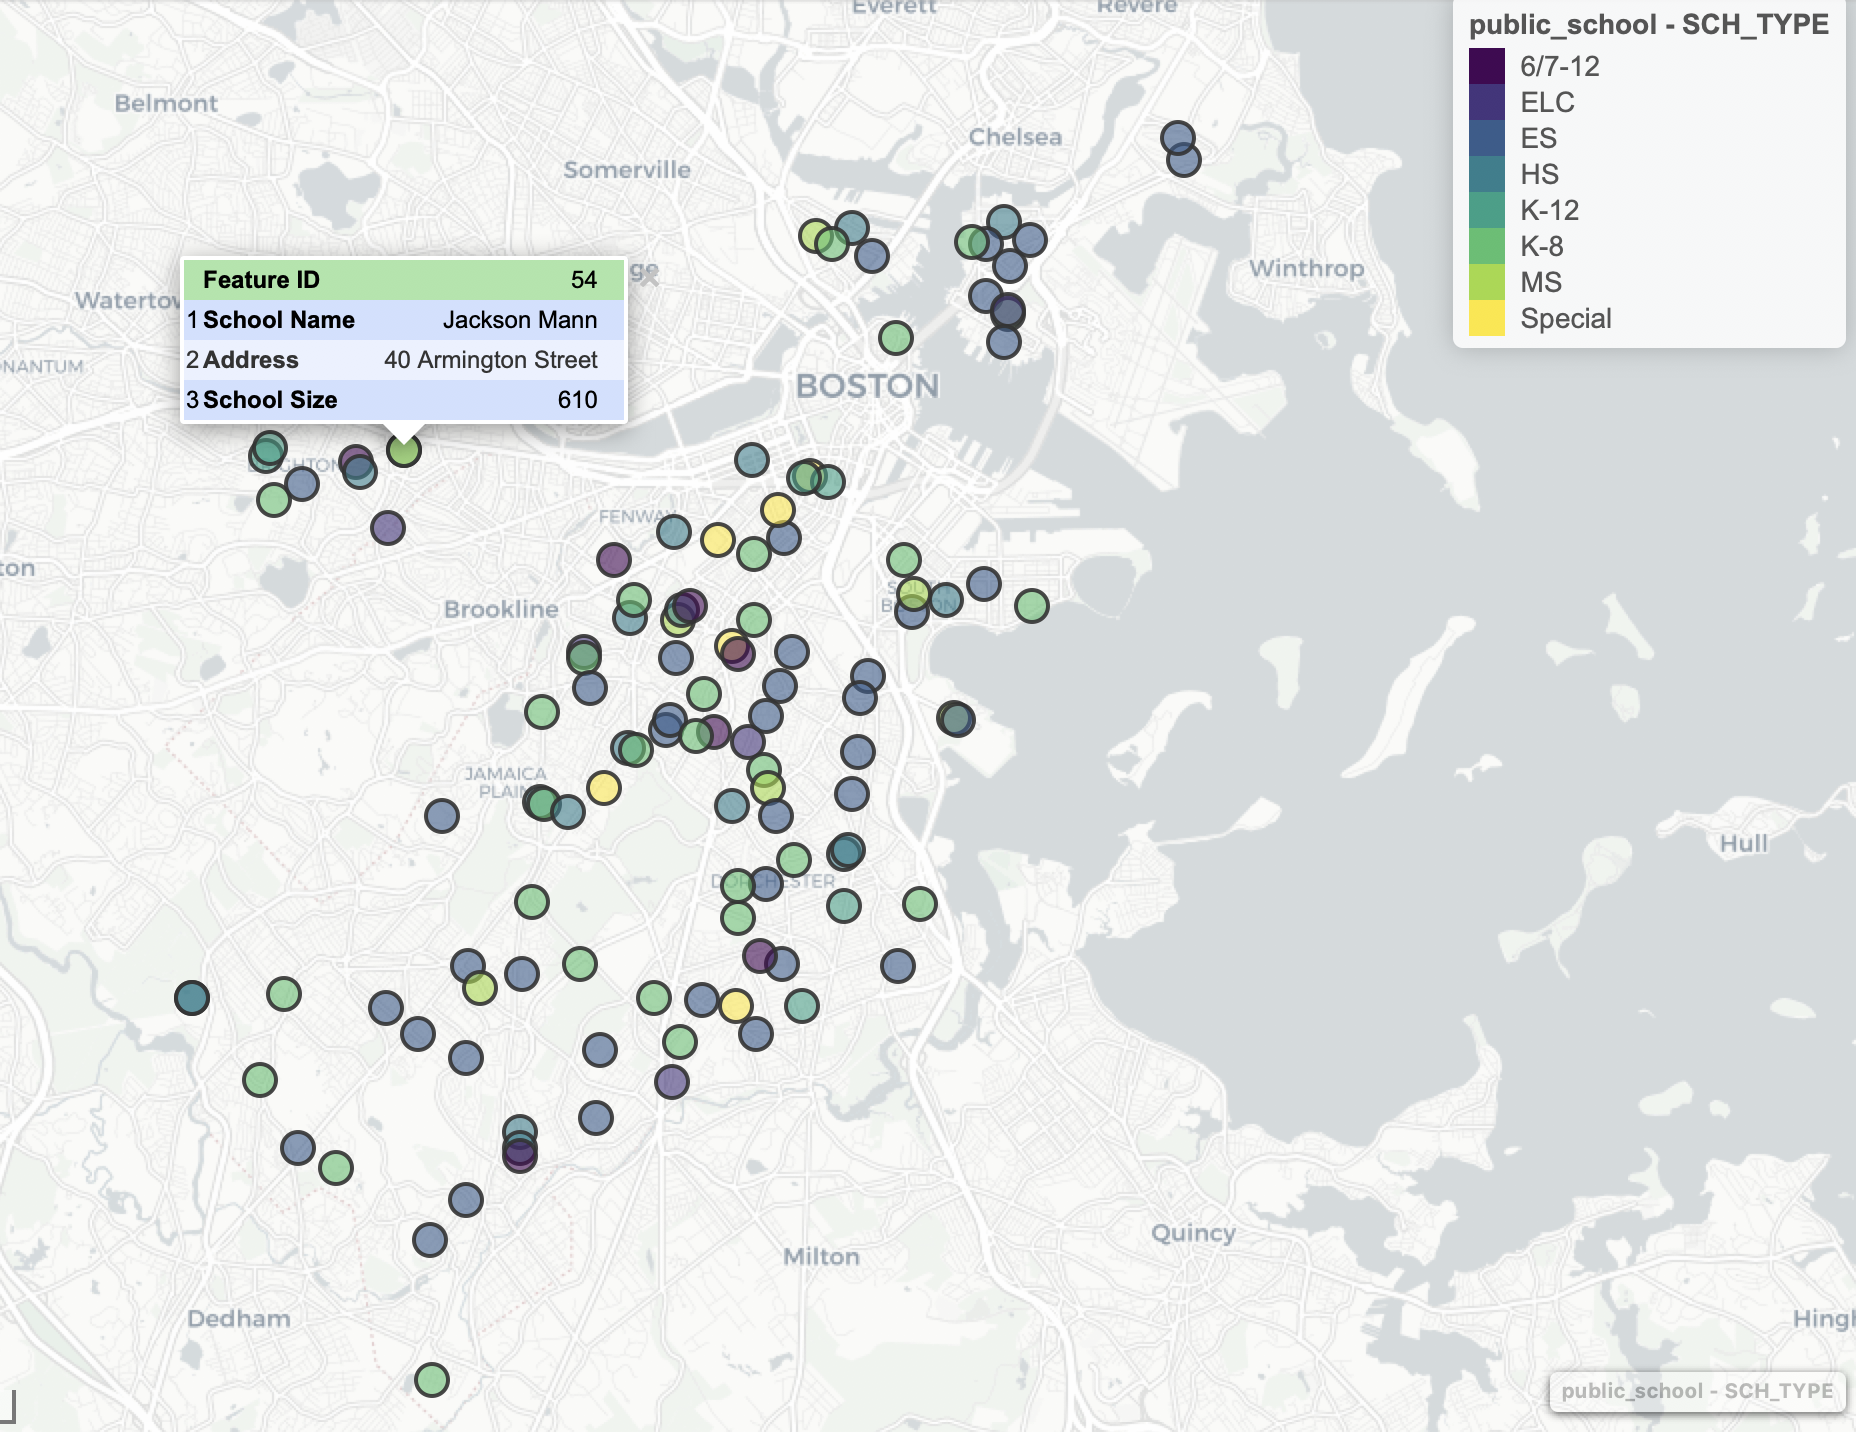
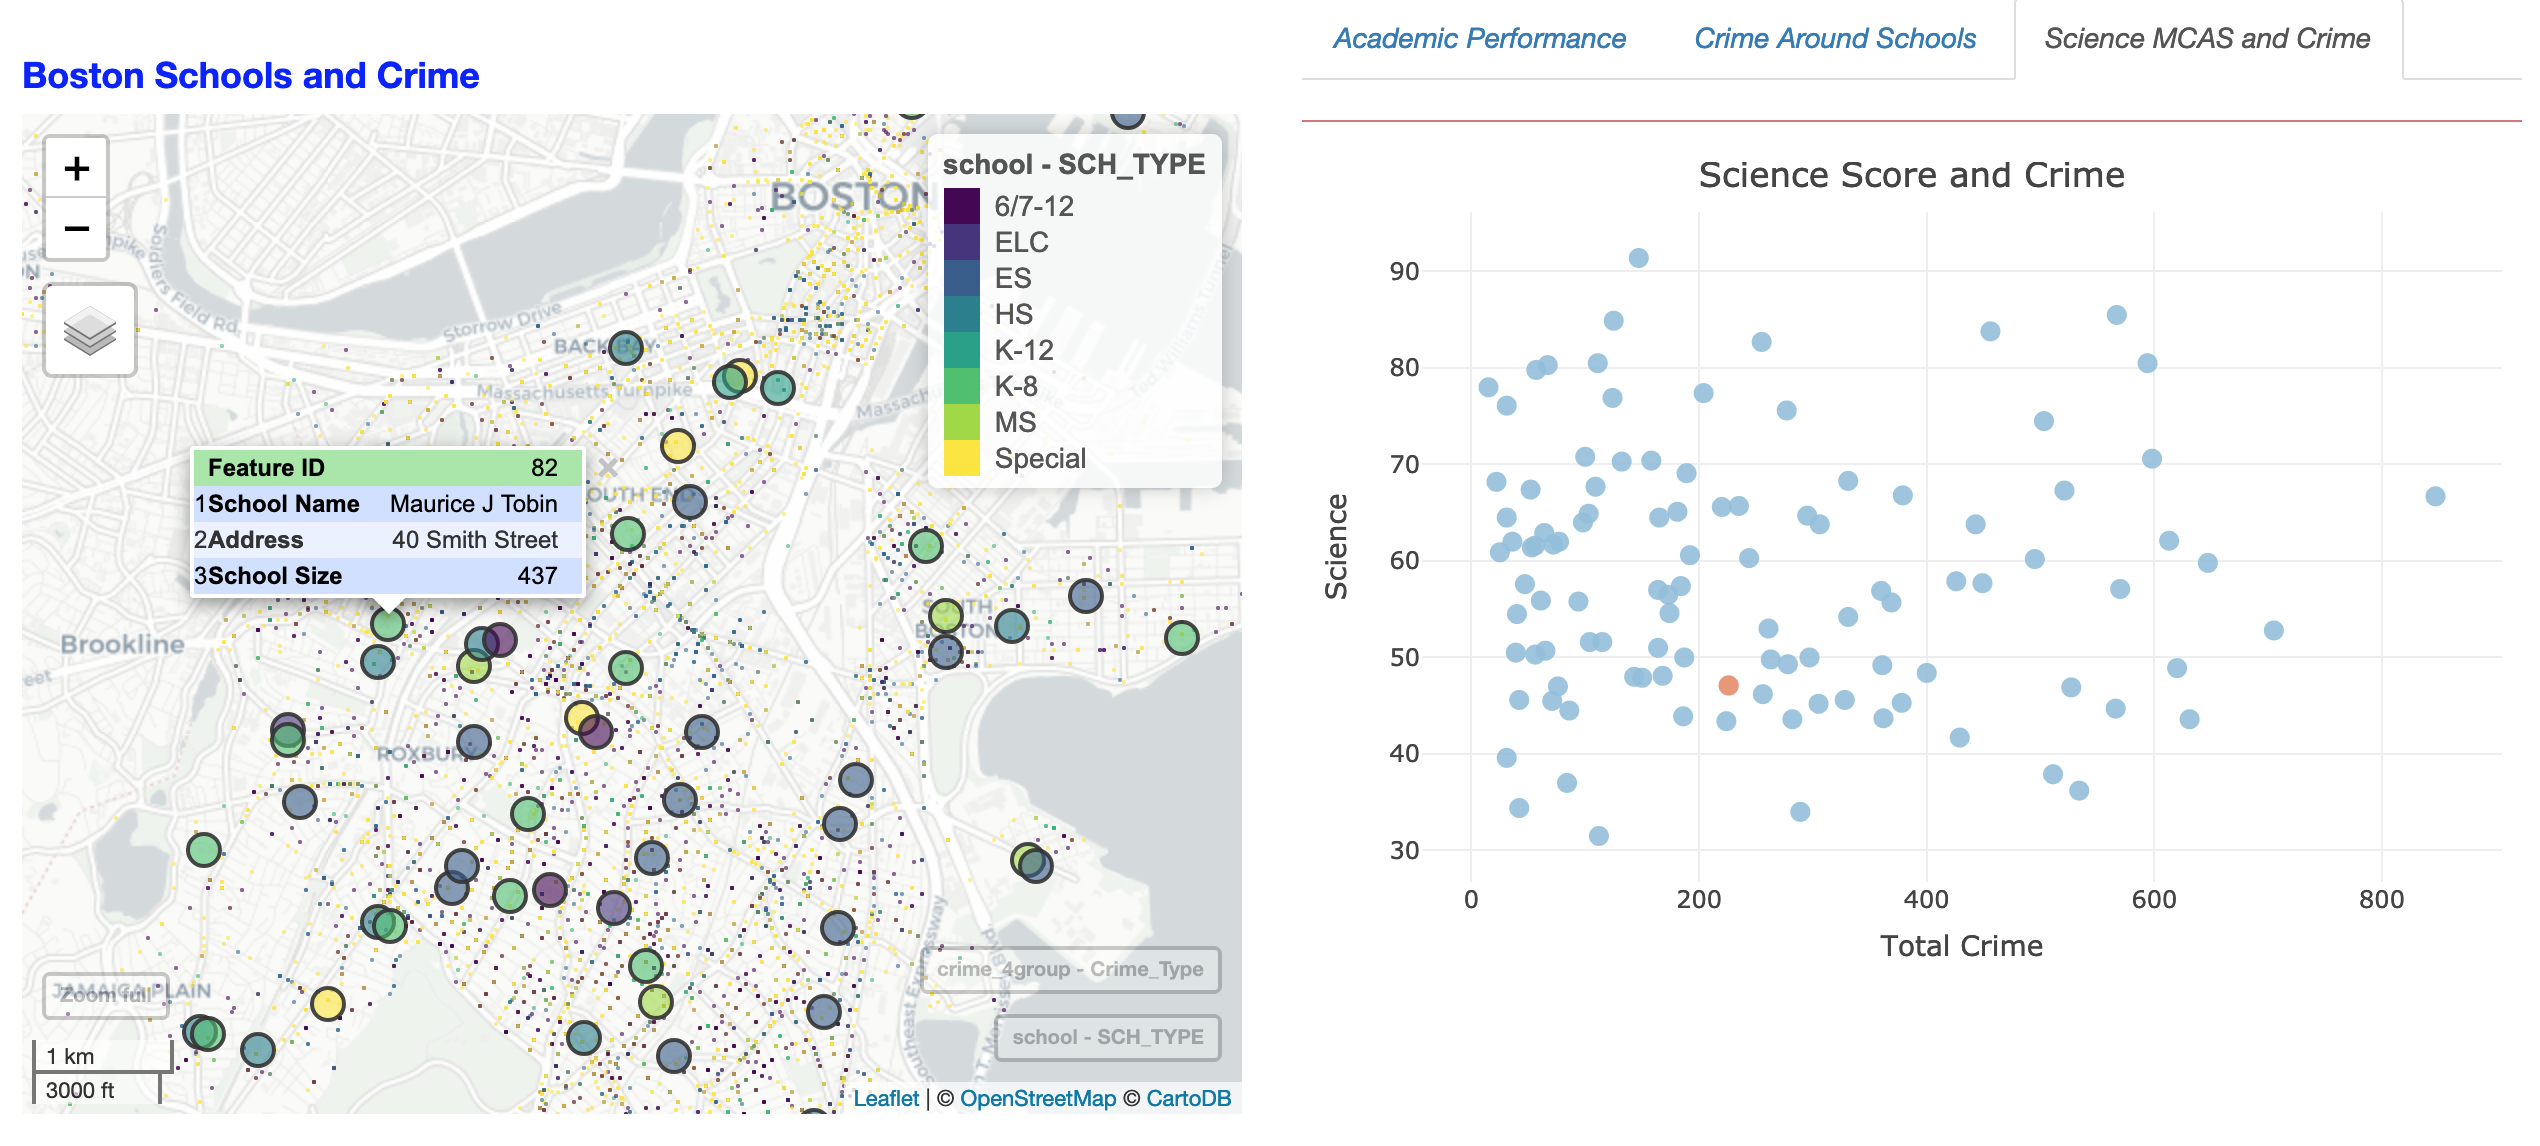
Schools on map
-
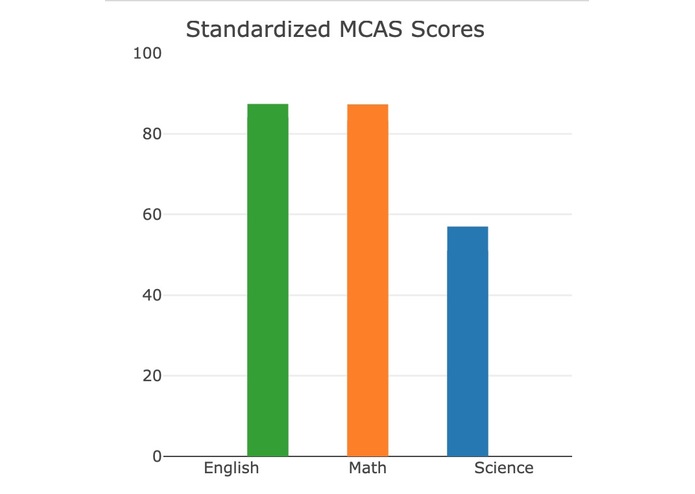
Academic performance of the school which pops up on the map
-
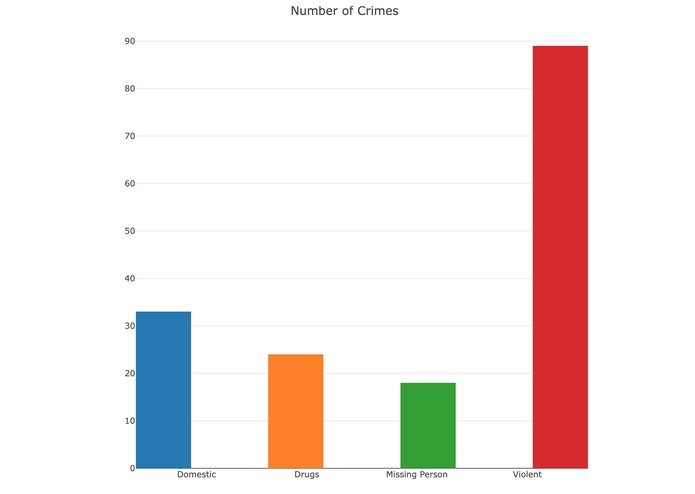
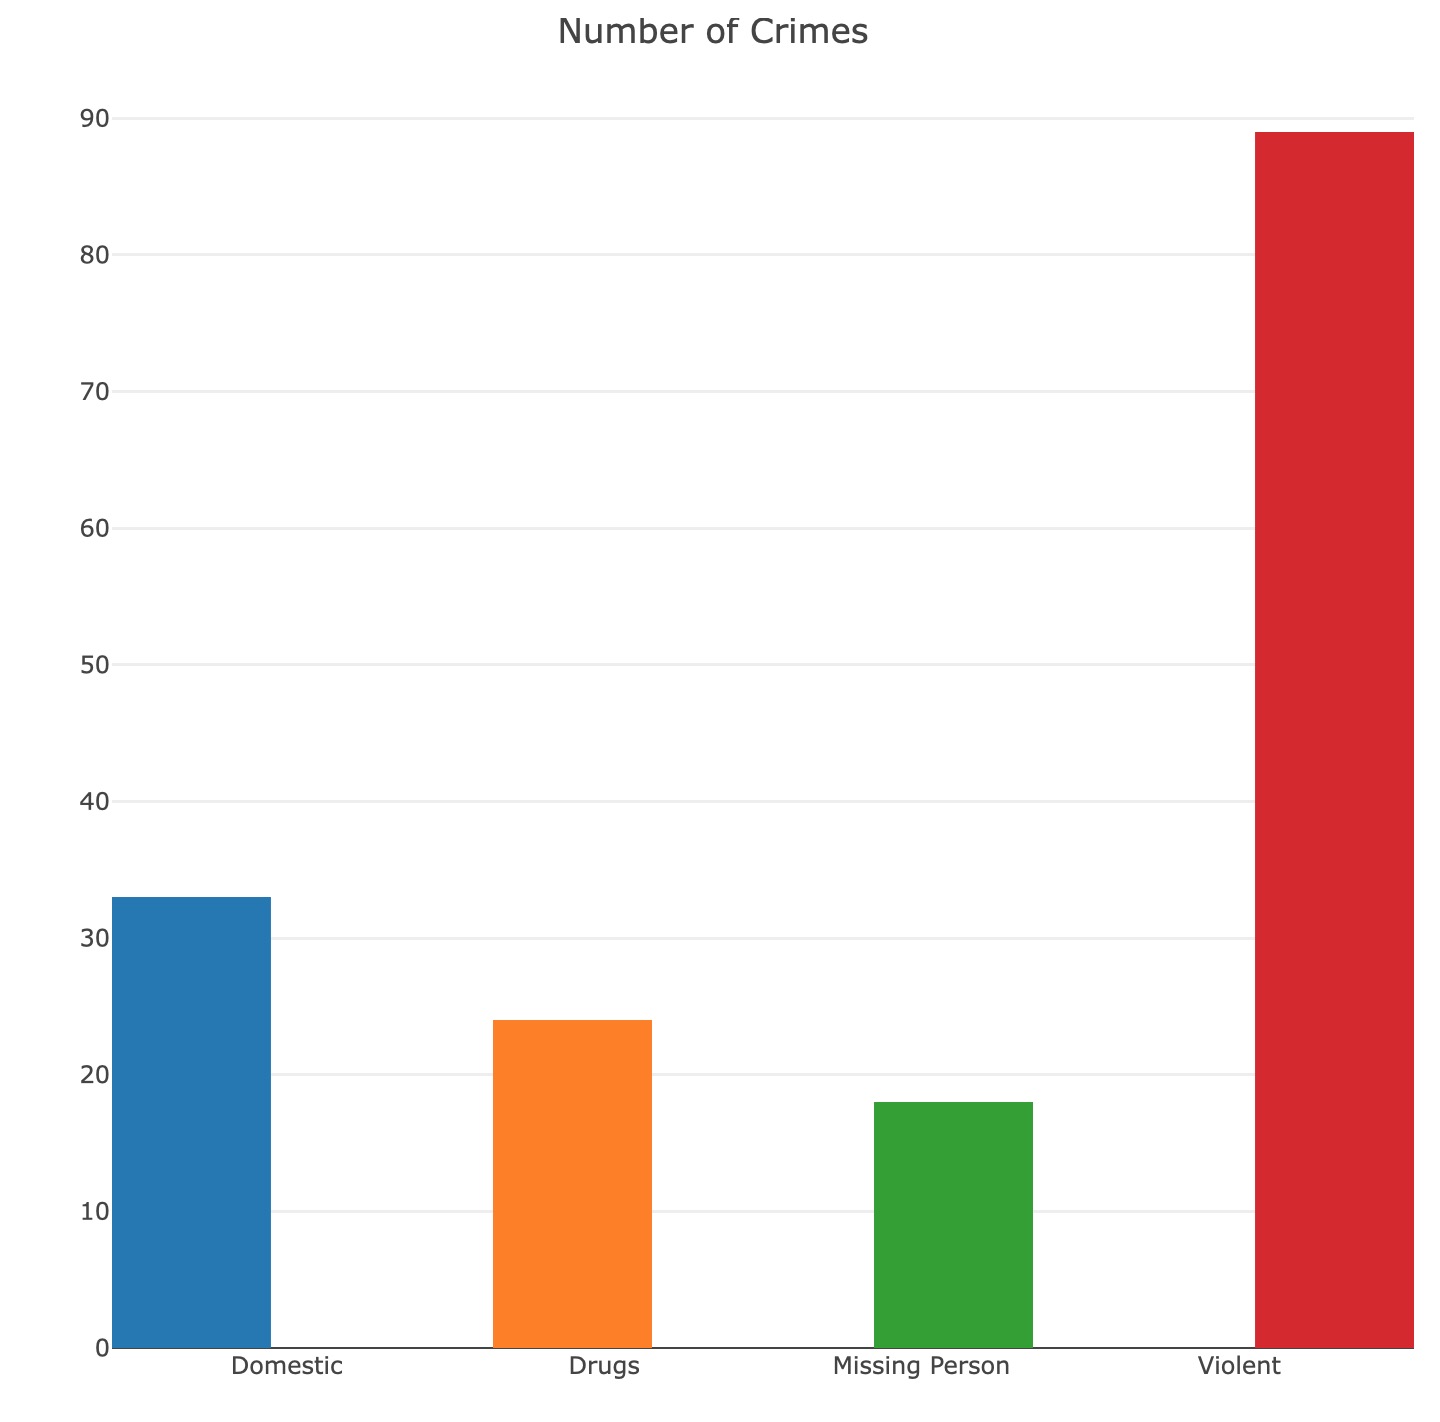
Crimes happened around the school which pops up on the map
-
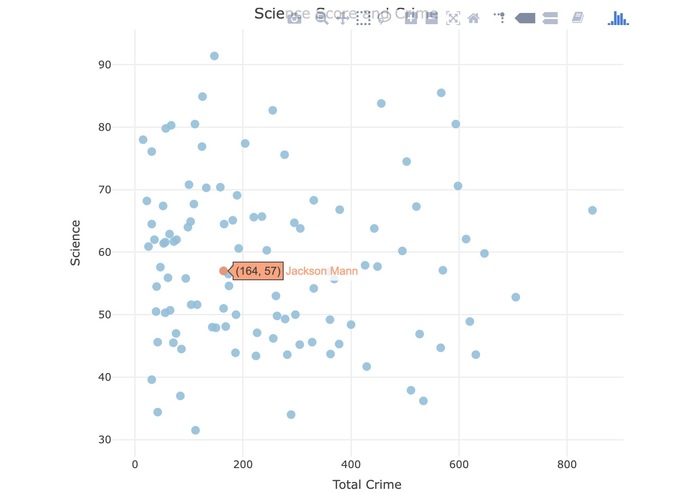
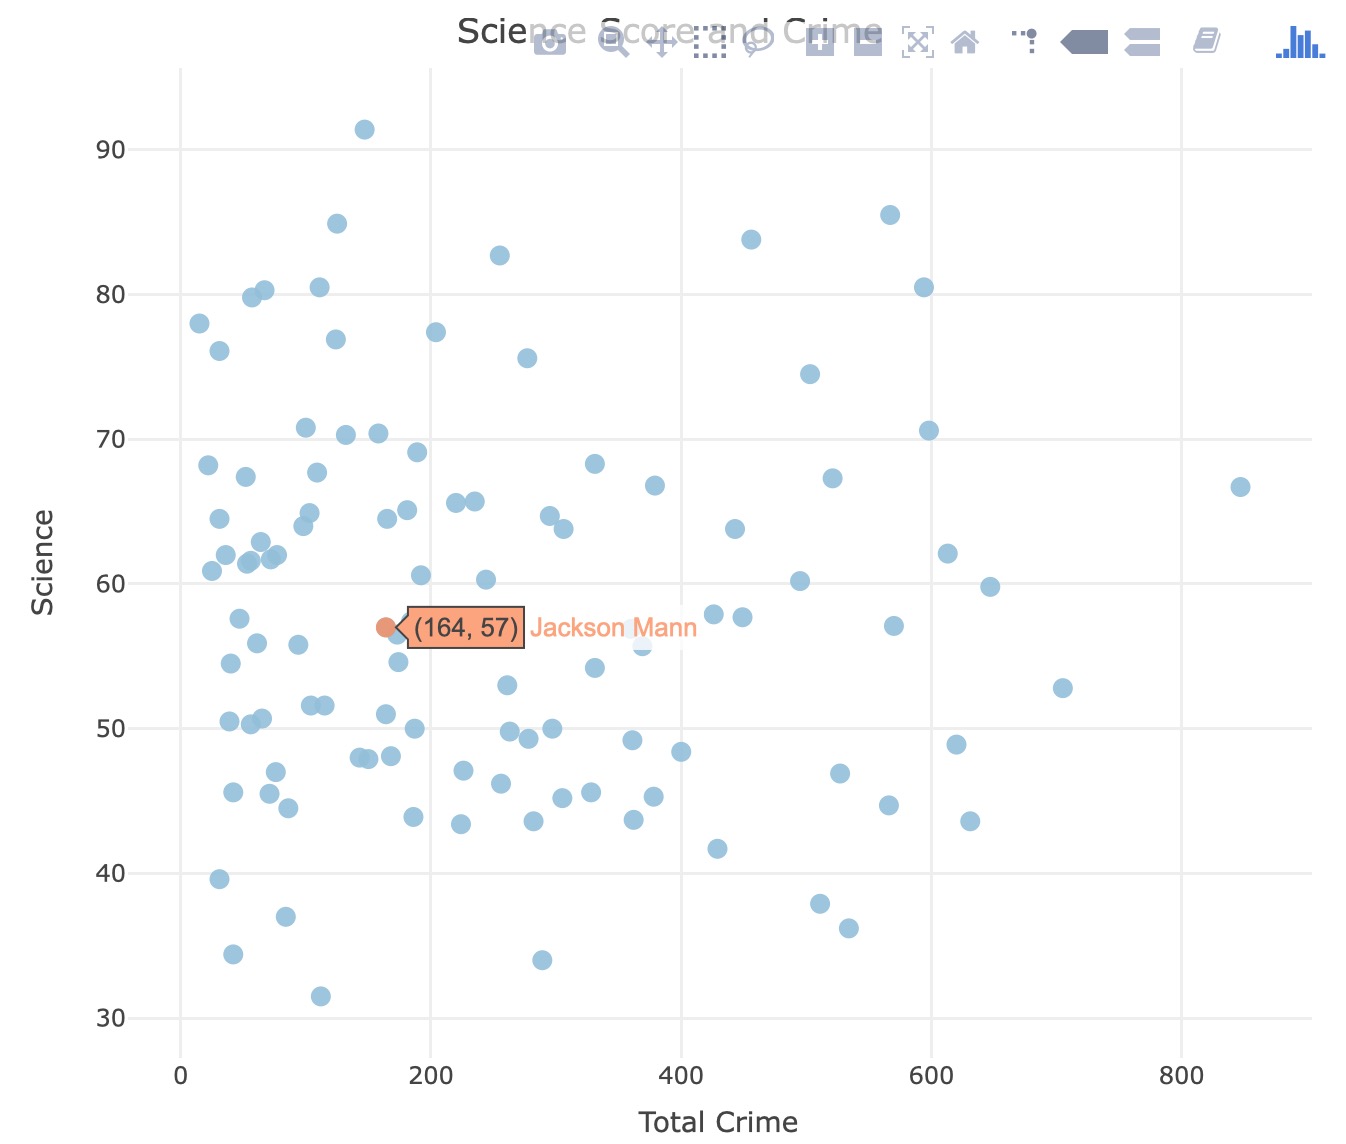
Relationship between crime rate and academic performance
-
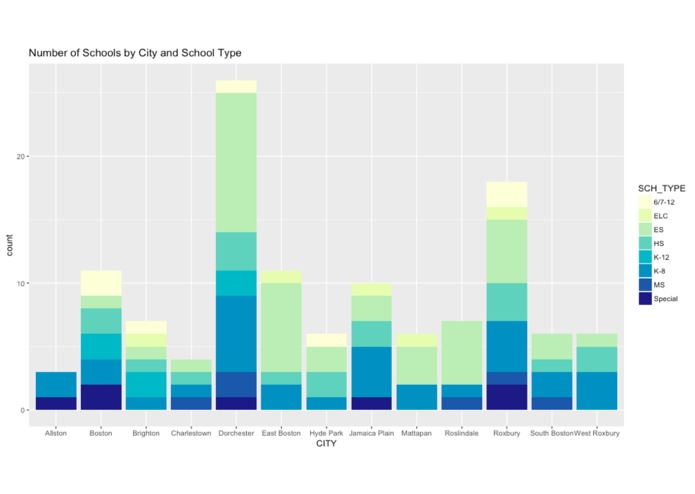
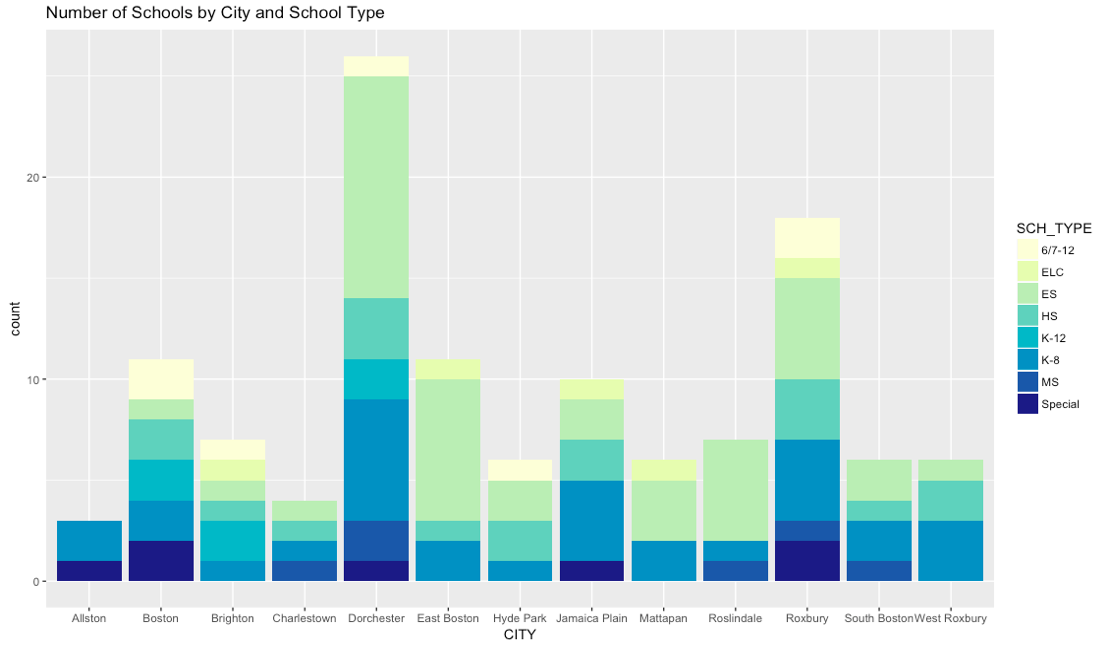
Number of Schools by City and School Type
-
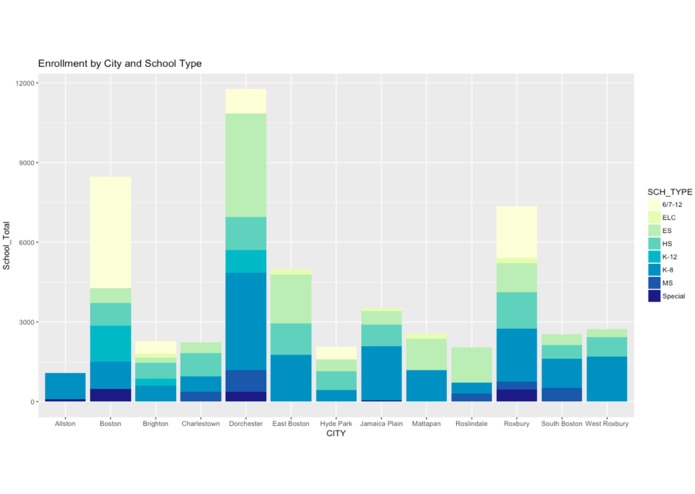
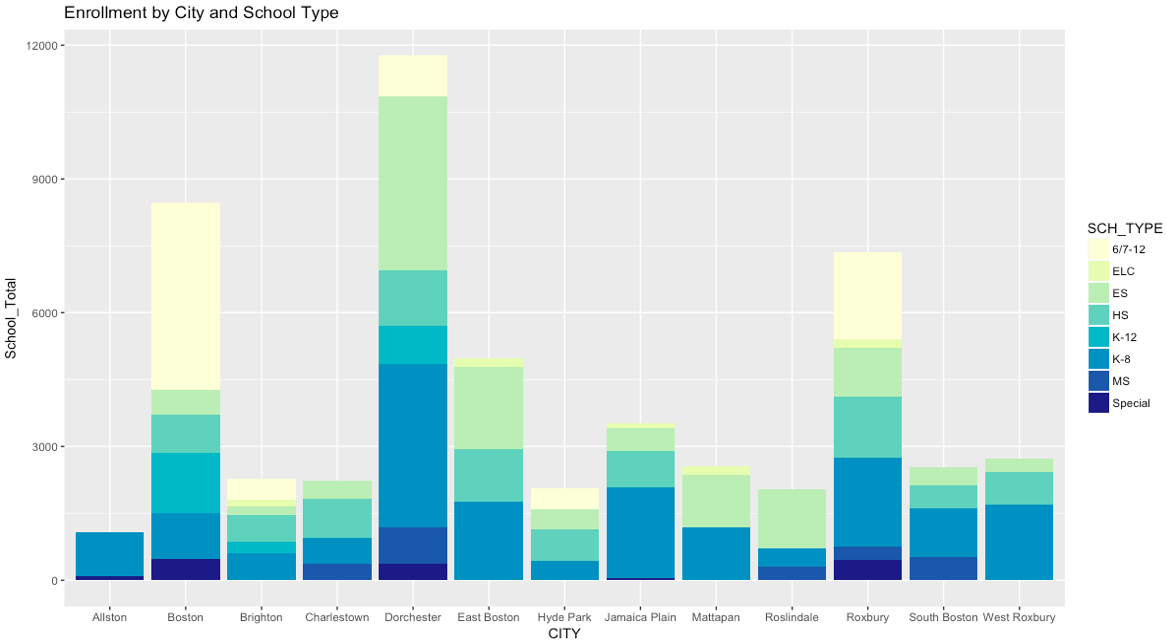
Student Enrollment by City and School Type
-
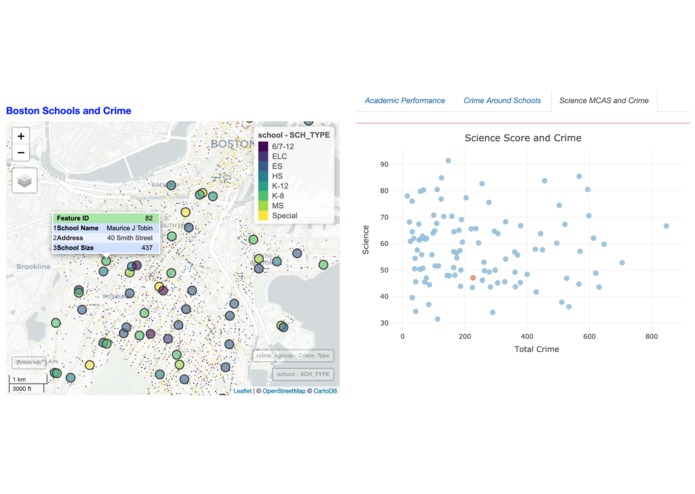
Screenshot of the Shiny App
-
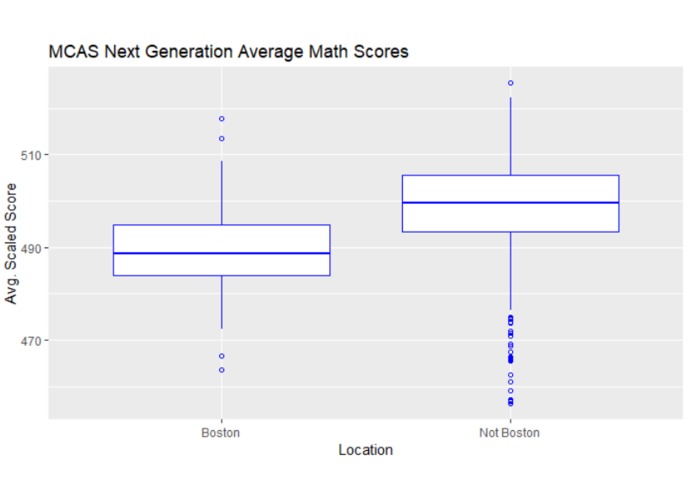
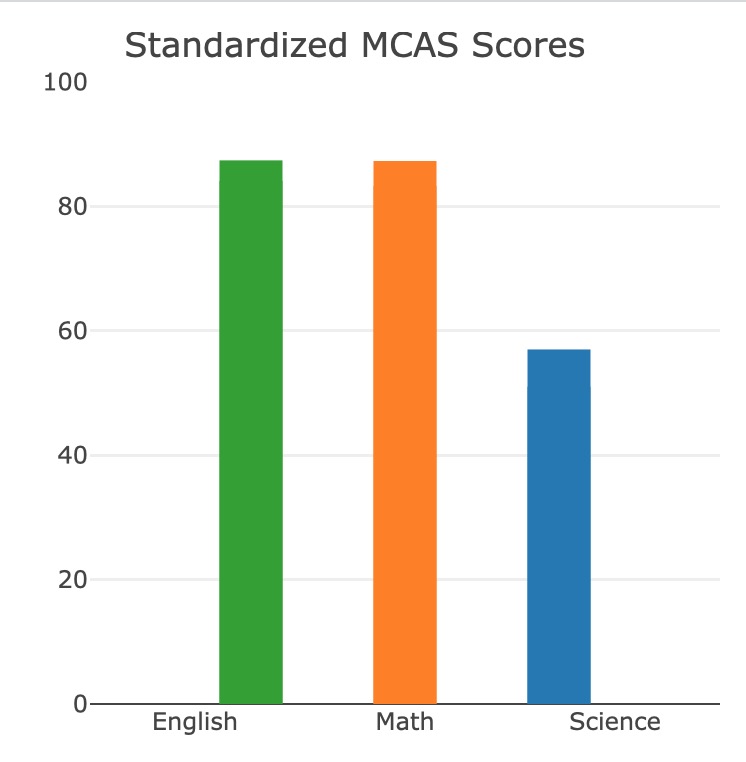
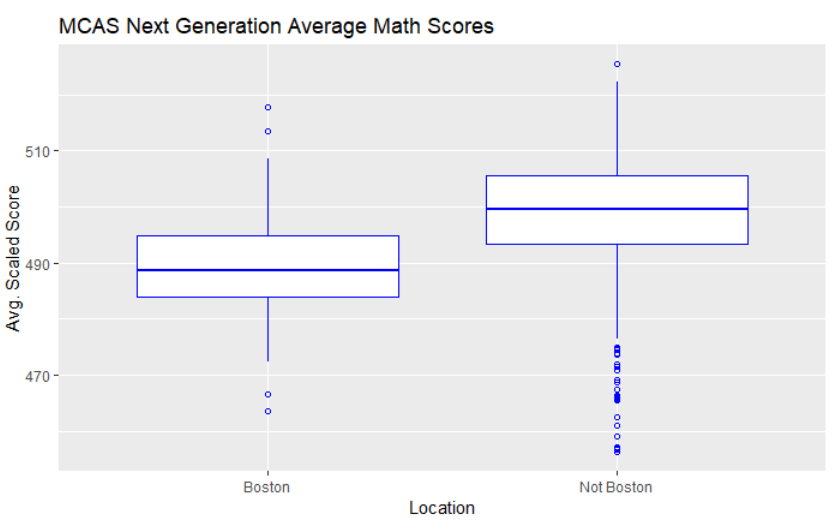
Math Test Scores in and out of Boston
-
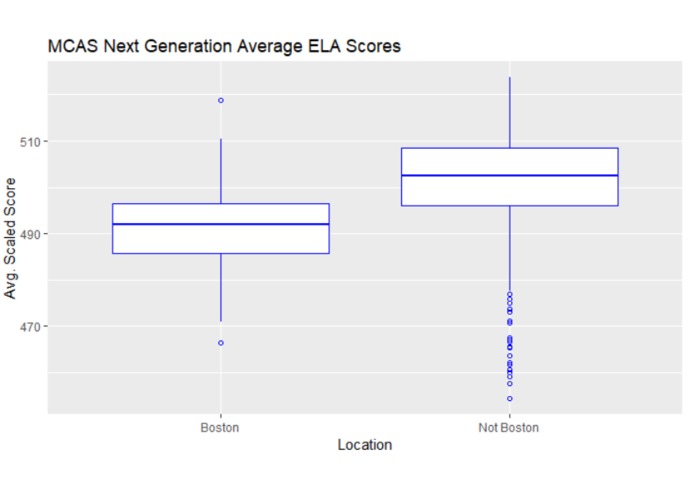
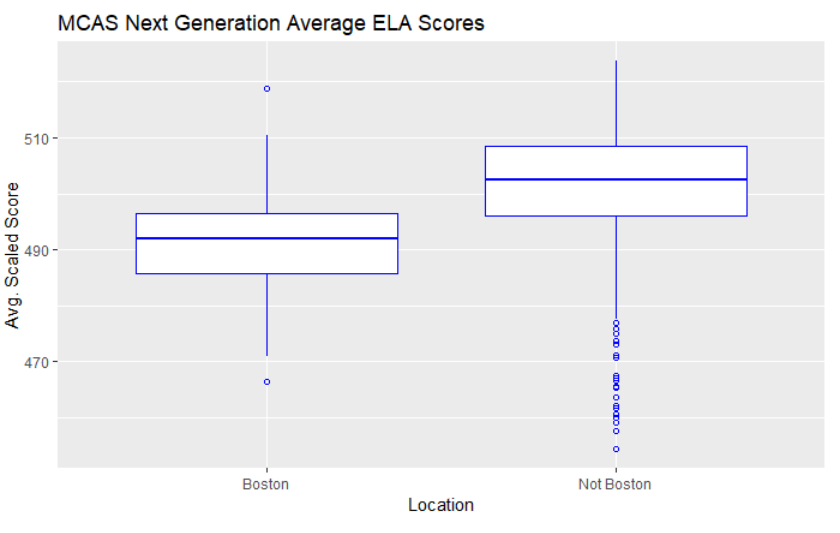
English Language Arts Scores in and out of Boston
-
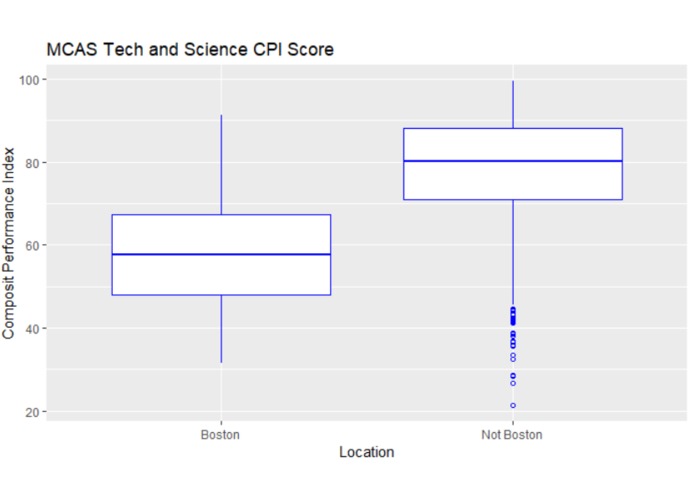
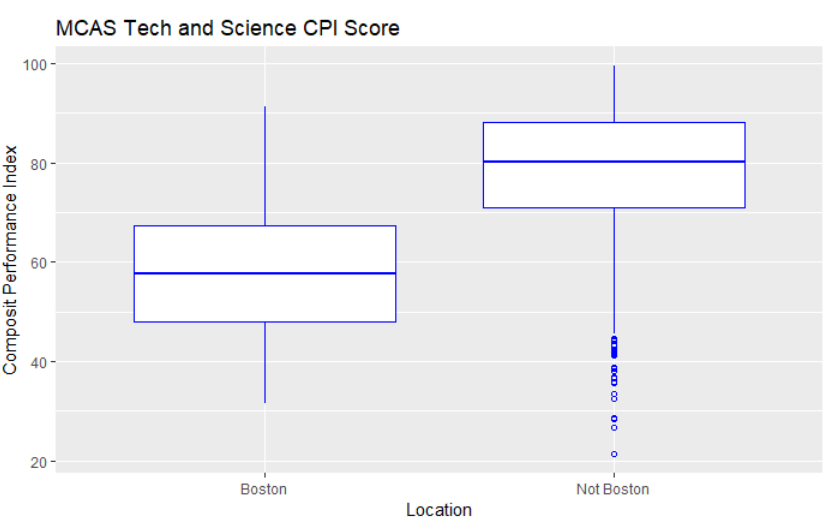
Science Test Scores in and out of Boston
Inspiration
Combining a love of education and local community.
What it does
We have created visuals and a shiny app to explore the relationship between instances of particular crime types, and the statistics regarding a school's performance.
How we built it
Police incident reports for Boston were explored and filtered to better describe crime types that are thought to have a higher relationship with people of school-age. We then collected information on test scores, including the MCAS and SAT, for schools across Massachusetts. Because we had the latitude and longitude of every school and crime incident, we were able to map these to observe any interesting phenomenons.
Challenges we ran into
Displaying school statistics in an interesting way on the Shiny app.
Accomplishments that we're proud of
The amount of data we were able to source.
What we learned
That Boston is overall a safe city, but the schools are performing poorly.
What's next for Boston Schools and Crime Rate
It would be interesting to look at the phenomenon of crime and test statistics from a longitudinal standpoint, to see if there is a relationship over time.


Log in or sign up for Devpost to join the conversation.