-
-
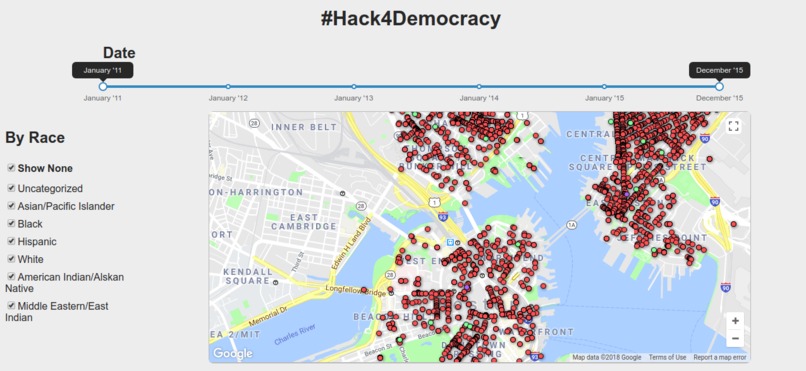
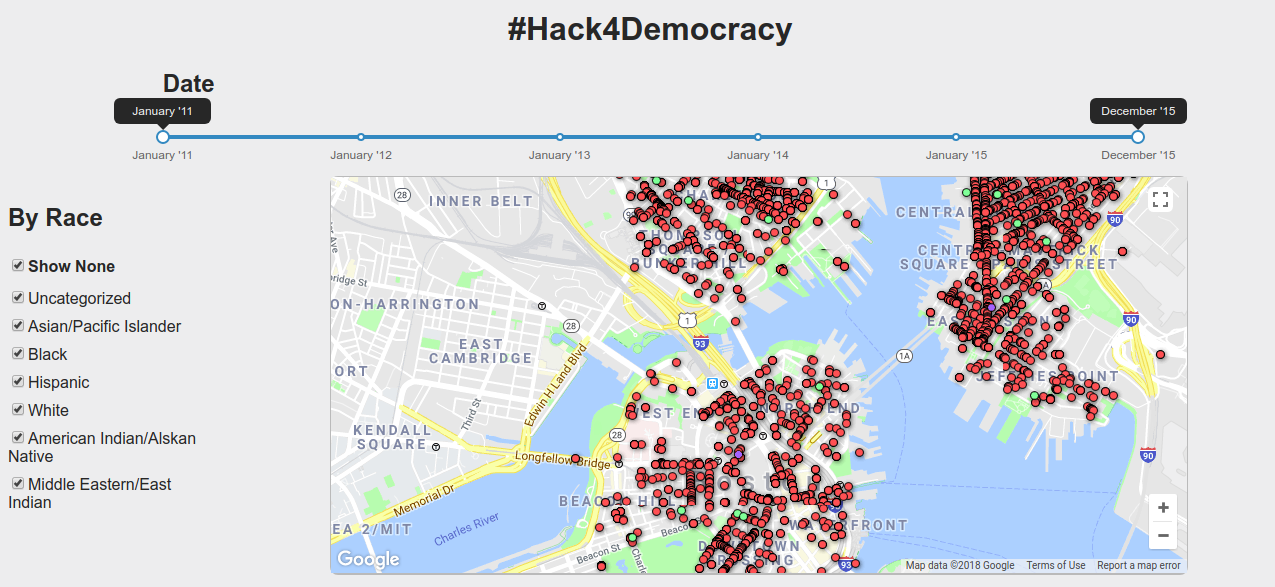
Screenshot of Project
Inspiration
On the opening night of the Hackathon, the ACLU presented with data they wanted to look at more but was not usable to them in the current form. When looking at the Boston Police Dataset we saw that there were location data attached to each stop, which the representative from the ACLU said would be something they would be interested more in.
What it does
Takes a cleaned version of the dataset, hosted in Fusion tables and maps it on an interactive Google Map with relevant information about stops on the balloons. There is also the ability to filter by races and data of stop.
How I built it
We first cleaned the data in Python using Pandas . The map is served using a Flask backend to a React fronted where the Google Maps API is called and the information is displayed. Each query to the data is set up as a separate set of props in React.
Challenges I ran into
At the very end we were crunched for time to connected the Flask backend to the React frontend.
Accomplishments that I'm proud of
This was the first time I had used the Maps API as well as Fusion tables and felt like I learned a lot about both in a short period of time.
What's next for Boston Police Stop and Frisk Data Visualization
Dataset has been depreciated and the Maps API we used as well.
Built With
- fusiontables
- javascript
- python
- react

Log in or sign up for Devpost to join the conversation.