-
-

-

-

-

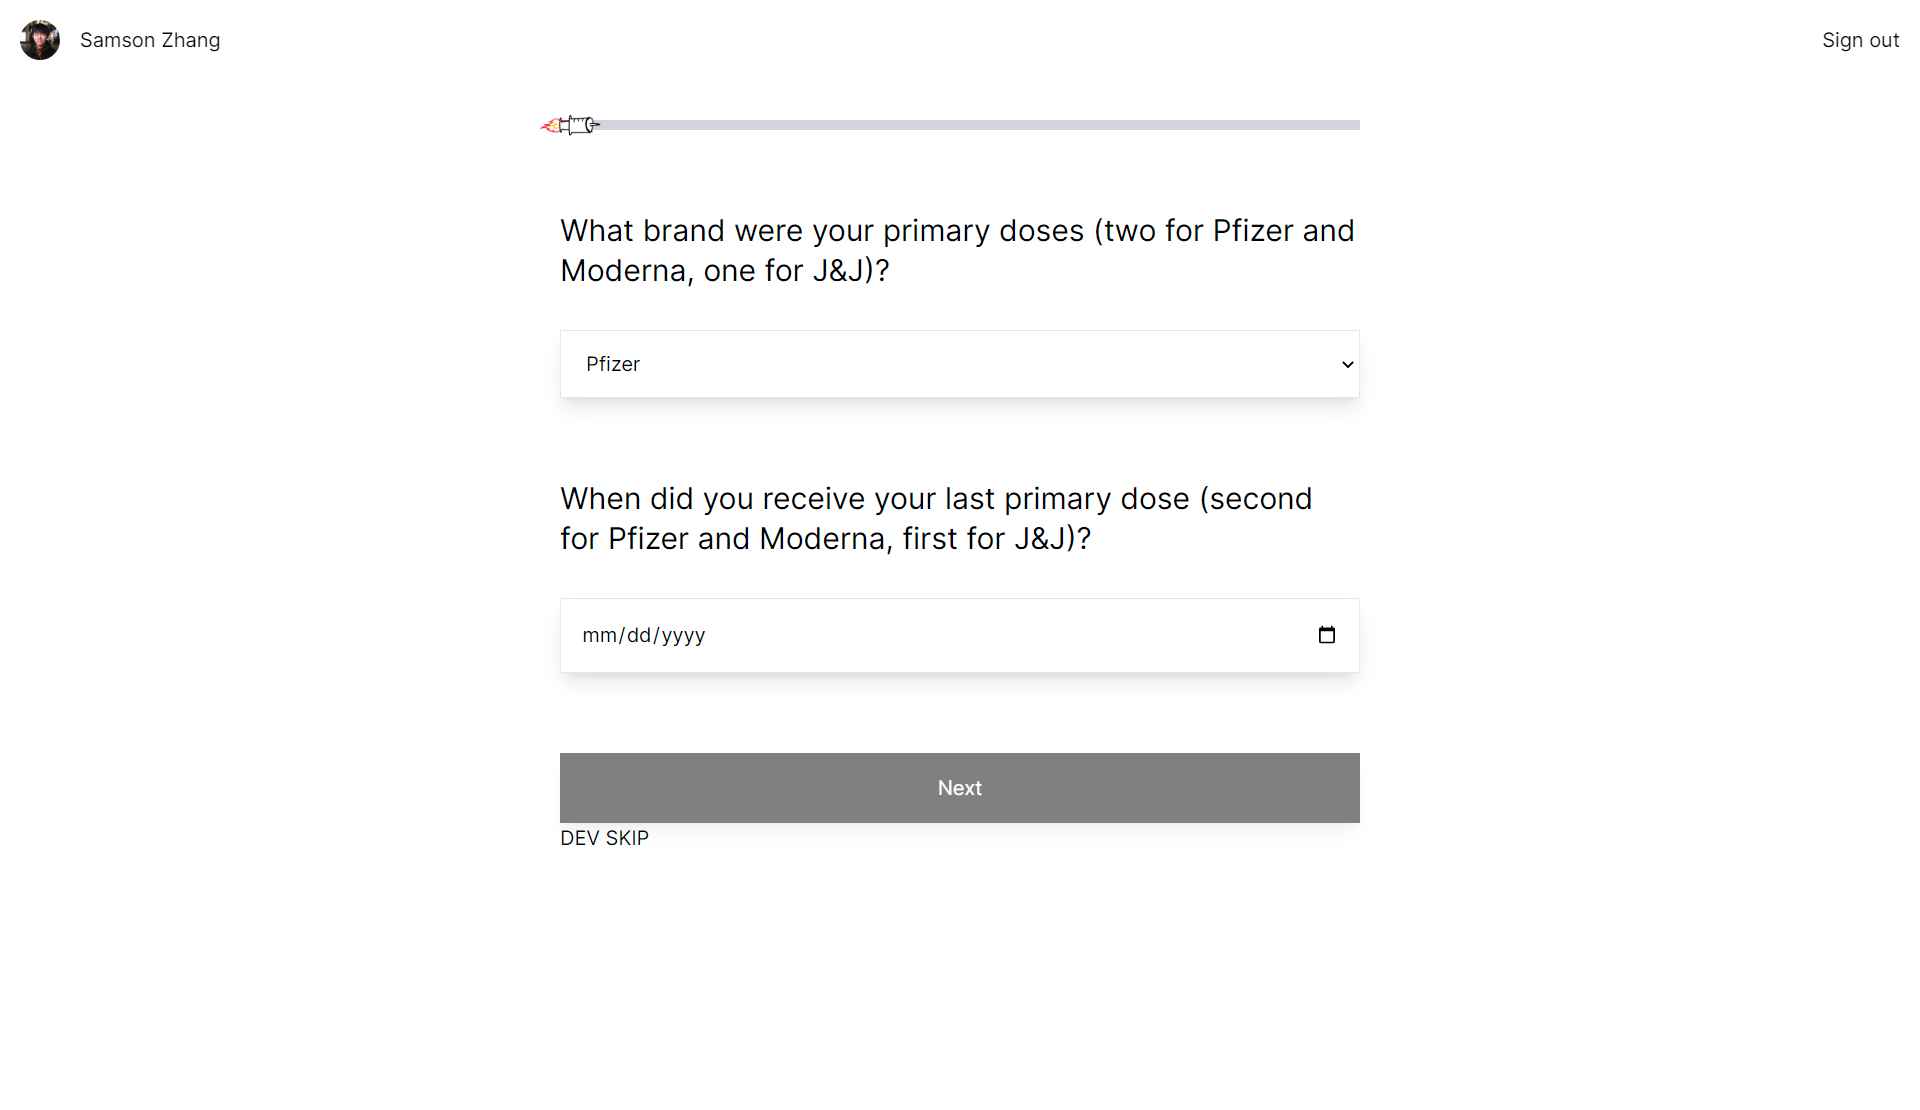
Log vaccine information
-

Vaccine Effectiveness Estimate
-

Interactive, personalized dashboard


Visit the live website at boostontime.vercel.app!
Inspiration
Do you ever wonder when to get your next COVD booster? Vaccine data is important to understand - but it's technical and inaccessible. Our project aims to distill vaccine effectiveness studies into a personalized, data-driven, and user-friendly dashboard to help keep track of one's vaccination status. We hope that our tool enables users to make more informed decisions about their COVID vaccinations, while advocating for up-to-date immunization.
What it does
Our web-app allows users to log their COVID vaccination history and estimates their current vaccine effectiveness against infections, severe symptoms, and death. We use data from 3 studies to build a predictive model and give confidence estimates for our predictions.
How we built it
Research: We filtered through VIEW-hub's dataset of 414 peer-reviewed Vaccine Effectiveness Studies to model the duration of protection of different vaccines and boosters. We then created clean datasets with time intervals to draw more precise estimations of vaccine effectiveness over time. We modelled the time-series data in R to identify trends in vaccine effectiveness over time and compare different regression algorithms.
App: We built a webapp using React and Express, driven by a MongoDB Atlas database backend. Using the database we were able to set up flexible user accounts using Google Cloud login, and allow users to store their personal vaccination history through an onboarding process, then feed this data into our model to calculate rates of protection against infection, severe illness, and death. Calculations from our model were displayed through a timeline visualization created from scratch using d3.js. Finally, the frontend and backend of the site were deployed on Vercel.
Challenges we ran into
Analyzing and evaluating complex, healthcare research papers was a daunting task but one that we found rewarding. We spent hours sifting through vaccine efficacy studies, learning about COVID variants and the different types of vaccines. Cleaning the massive dataset of 414+ studies was challenging and required continuous collaboration and critical thought.
Accomplishments that we're proud of
We are proud to have built an well-researched, interactive, and personal COVID immunization dashboard that promotes vaccination and public health. We are proud to have built a tool that is immediately usable and useful to thousands if not millions of people!
What we learned
We learnt so much about the pandemic and its trends over the last 3 years. We were distressed to learn about long COVID and how it affects tens of thousands of people around the world. We hope our product helps promote more informed COVID decisions.
What's next for Boost On Time
Analyze COVID spreading risk, immunity after infection, and more ways of making COVID data accessible.


Log in or sign up for Devpost to join the conversation.