-
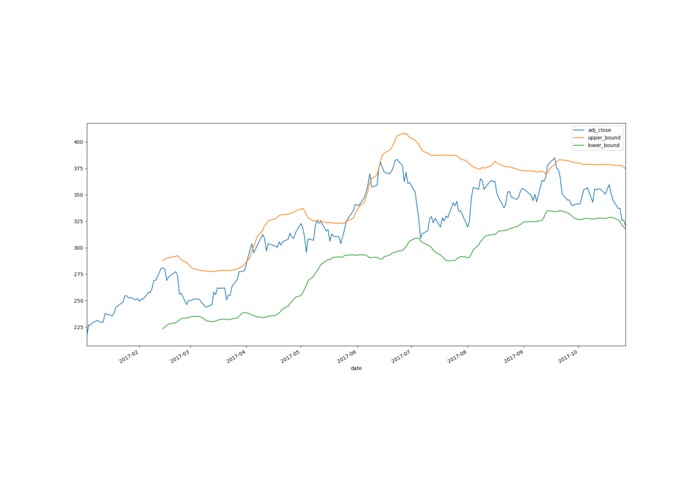
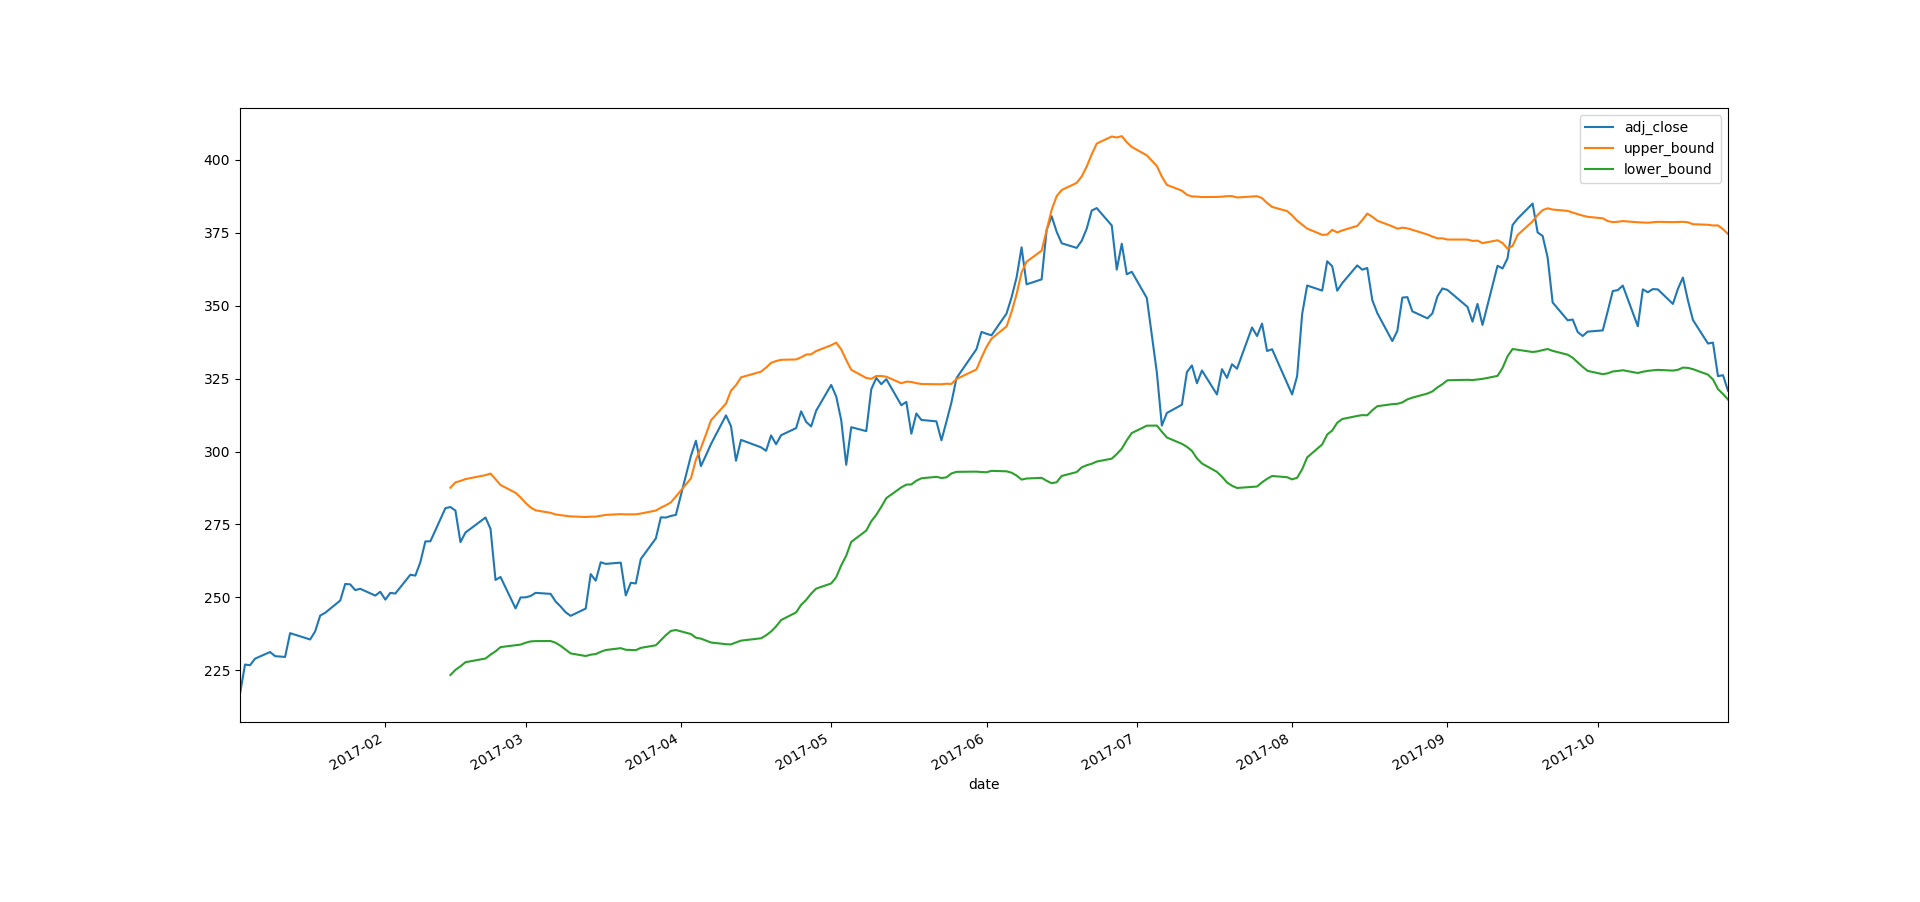
Sample plot showing the Bollinger bands around the closing price for TSLA
Bollinger
I designed this to assist me with quantitative methods for investing and trading. My vision is for this to be a fully fledged site where I can pull up deeper trends in securities data for any given public company and leverage machine learning and other statistical models to predict future risks and returns, and return that data in an easy to understand manner using interactive plotting libraries like Plotly. This weekend, I worked on the initial trend statistic of Bollinger bands.
This is a project created by Abhishek Routray for HackTX 2017. The script allows you to enter a stock by specifying its ticker, then it pulls historical adjusted closing price data through the Quandl API. It then creates Bollinger bands - a measure of volatility in a stock based on creating an upper bound and lower bound around the moving average of the stock. I improved on this by using an Exponentially Weighted Moving Average which gives more bias to recent dates, which allows us to account for the current economic feelings more accurately, rather than a Simple Moving Average which gives every date an equal weighting.
To use the script, create a Bollinger object by specifying the ticker and an optional start date (by default it uses the past 60 days) in the format 'YYYY-MM-DD'. You can then see whether the stock is stable or trading unusually highly or lowly by calling the .is_stable() method. You can get a plot of the Bollinger bands against the closing price as well by calling the .visualize() method.
For example: tesla = Bollinger('TSLA', '2017-01-01') tesla.is_stable() tesla.is_stable('2017-09-18') # Date of their most recent high tesla.visualize()

Log in or sign up for Devpost to join the conversation.