-
-
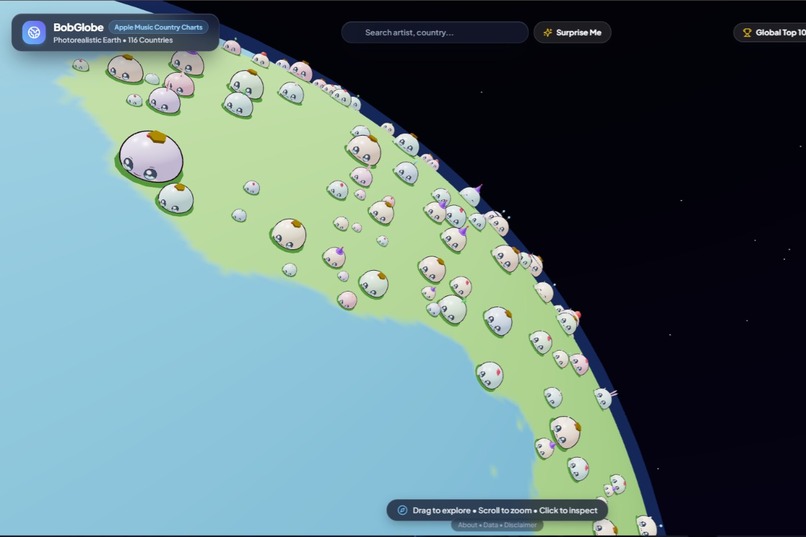
A look at the project Blobs representing artist across the world
-
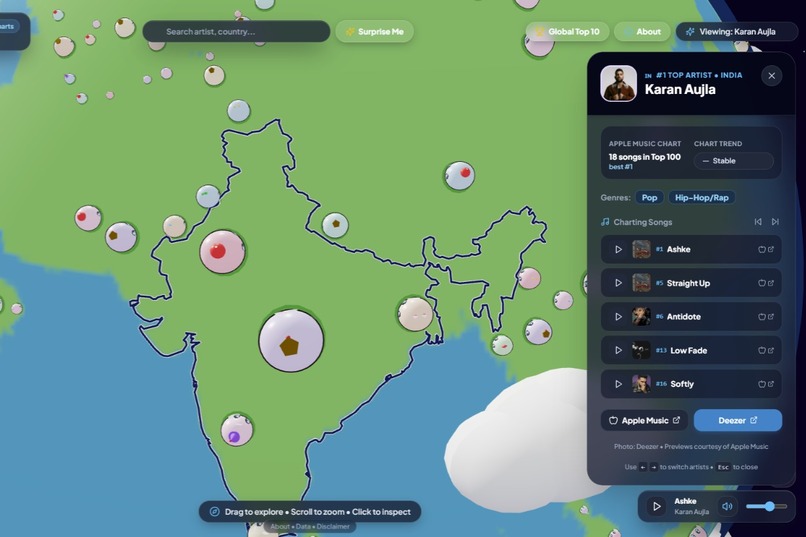
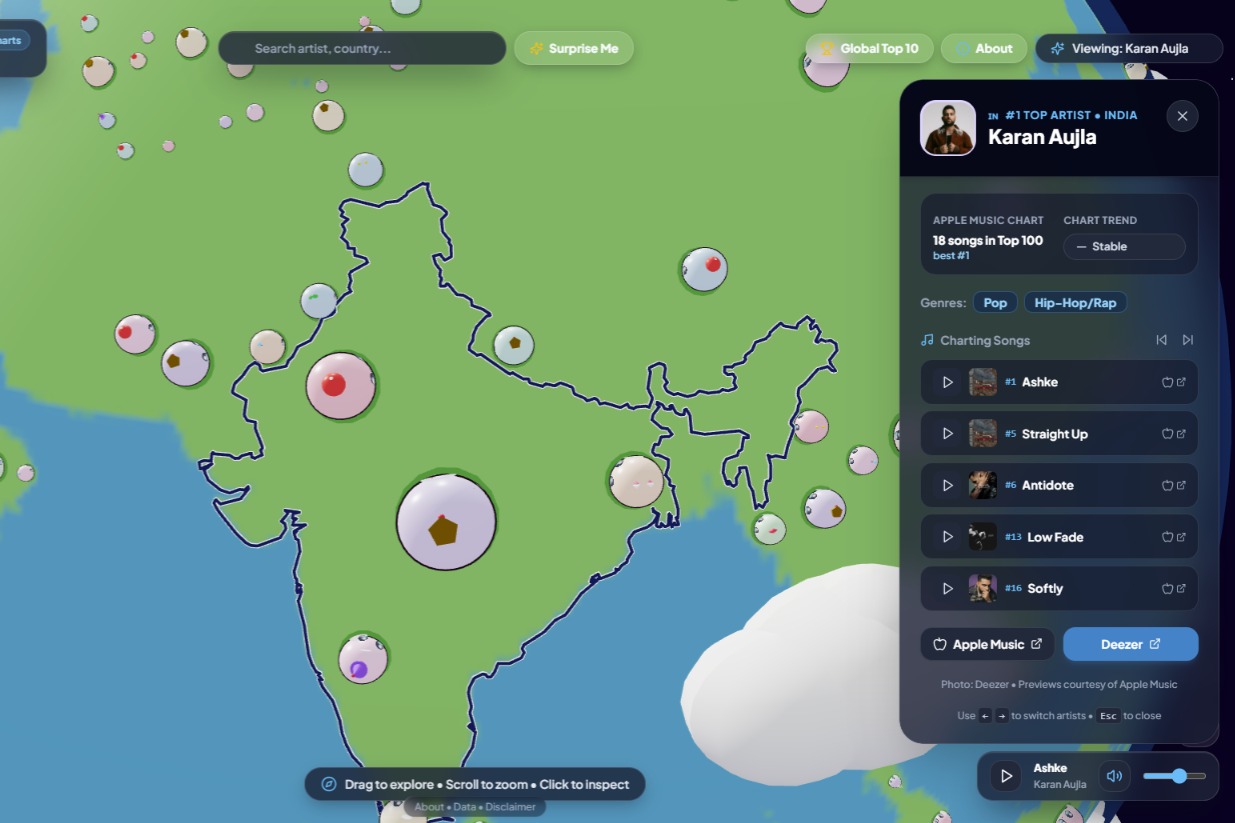
Showing the most played artist as Blob in India
Inspiration
Music charts are usually boring lists. We wanted to turn them into a place you can explore. What if you could spin a planet and see who the world is listening to, with every country's top artist as a tiny living creature on its surface? We wanted it soft, cozy, and a little silly: a kawaii mochi world instead of a spreadsheet.
What it does
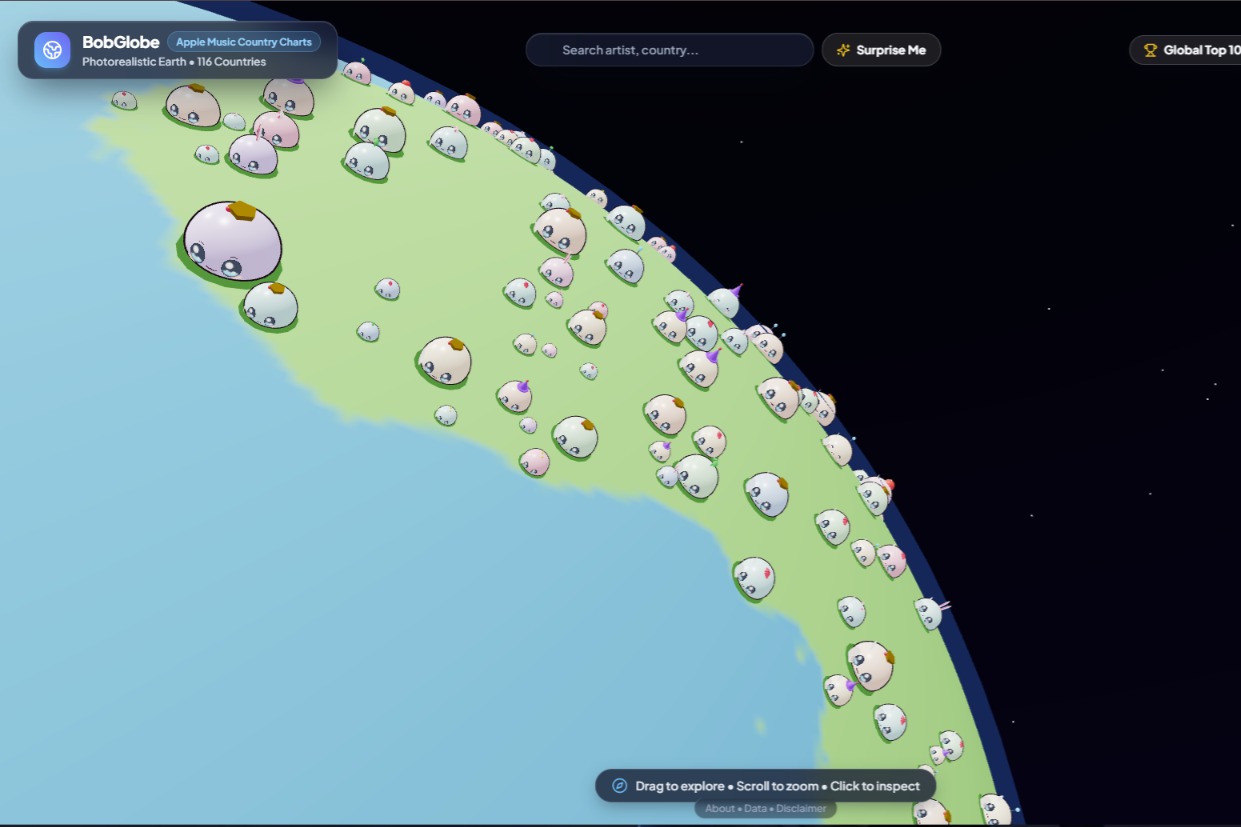
BobGlobe is an explorable 3D Earth where adorable mochi blobs represent the most-listened artists in each country.
- Each blob wears one of 8 personality accessories, and each country's #1 artist gets a golden crown.
- Blobs breathe with jelly squash-and-stretch, blink at random, and bounce when poked.
- Tap a blob to hear a 30-second preview and open the artist on Apple Music.
- Blob size reflects how dominant the artist is, both locally and globally.
- Data refreshes every night from real charts across 136 countries.
How we built it
3D world: a smooth 256×256 sphere with a procedural pastel biome palette, a soft turquoise shoreline, and gentle mountain relief from low-strength normal maps and vertex displacement. A Fresnel atmosphere glow, a drifting cloud layer that fades out as you zoom in, and a gradient space dome with 1,400 twinkling stars complete the look.
Blobs: unlit MeshBasicMaterial faces keep the big glossy anime eyes (dual sparkle highlights, iris glow, blush) bright from any angle, with distance-based LOD that enlarges faces up to 1.4× from orbit.
Data pipeline:
- Apple Music's public RSS feeds provide the Top 100 most-played songs per country.
- iTunes Search/Lookup resolves artist IDs, album art, and 30-second previews.
- The Deezer API supplies high-resolution artist photos.
- A GitHub Actions workflow refreshes everything nightly at 03:00 UTC, with snapshot diffing and 30-day history retention.
Scoring and sizing: each artist's score rewards high chart positions, with a small bonus for #1:
$$ \text{score} = \sum_i (101 - \text{rank}_i)\cdot \begin{cases} 1.10 & \text{if } \text{rank}_i = 1 \ 1.0 & \text{otherwise} \end{cases} $$
Blob size balances local dominance against global market volume:
$$ r = \frac{\text{chartScore}}{\text{countryTopScore}}, \qquad w = \left(\frac{\text{countryTopScore}}{\text{globalMaxTopScore}}\right)^{0.4}, \qquad t = r \times (0.5 + 0.5\,w) $$
Challenges we ran into
- No black night side. A realistic shadow made half the planet unreadable, so we used strong hemisphere fill and a blue-gray shade floor (
#223247). - Clouds hiding the fun. They looked great from orbit but covered the blobs up close, so they now fade out on zoom-in.
- Keeping the planet soft, not lumpy. We tuned normal strength down to $0.35$ and displacement to $0.038$ to avoid harsh bumps.
- Fair blob sizing. Raw scores made some countries tiny and others giant, which led to the local-versus-global weighting.
- Explicit content. Explicit songs never autoplay. If there's no clean preview, BobGlobe stays silent and links to Apple Music.
- Messy real-world data. Merging three APIs across 136 countries required verification scripts and a test suite.
Accomplishments that we're proud of
- A globe that feels genuinely soft, cozy, and premium instead of a typical data-viz dashboard.
- Mochi characters with real personality: blinking, breathing, bouncing, accessories, and crowns.
- A fully automated nightly pipeline covering 136 countries with data verification and history snapshots.
- Responsible handling of explicit content, so the experience stays friendly for everyone.
- A scoring system that keeps both small and large music markets visible.
What we learned
- Small visual choices (a soft shade floor, unlit faces, fading clouds) matter more for "cute and premium" than raw detail.
- A scoring formula is really a design decision about fairness.
- Automating data refresh and verification early saved us from breaking the globe at the last minute.
- 3D performance on the web is all about tradeoffs, from sphere segments to LOD.
What's next for BobGlobe
More accessories and blob personalities, per-genre views, a time slider powered by the 30-day history, and shareable links to your favorite country.
Built With
- apple-music
- deezer
- itunes
- javascript
- typescript

Log in or sign up for Devpost to join the conversation.