Inspiration
Dial-a-Storm was inspired by the May 2024 Gannon superstorm, which produced spectacular auroras visible as far south as Ontario. Seeing the northern lights so far from their usual locations made us curious about what was happening between the Sun and Earth.
We started asking questions. What happens to Earth's magnetic field when solar wind becomes stronger? What if the magnetic field changes direction? Could we use historical data to predict how severe a geomagnetic storm might become?
We wanted to build something that would let people explore these questions themselves. Instead of simply displaying space-weather data through graphs, we decided to create an interactive 3D simulator where users could change solar wind conditions and watch how Earth responds.
That idea became Dial-a-Storm.
What it does
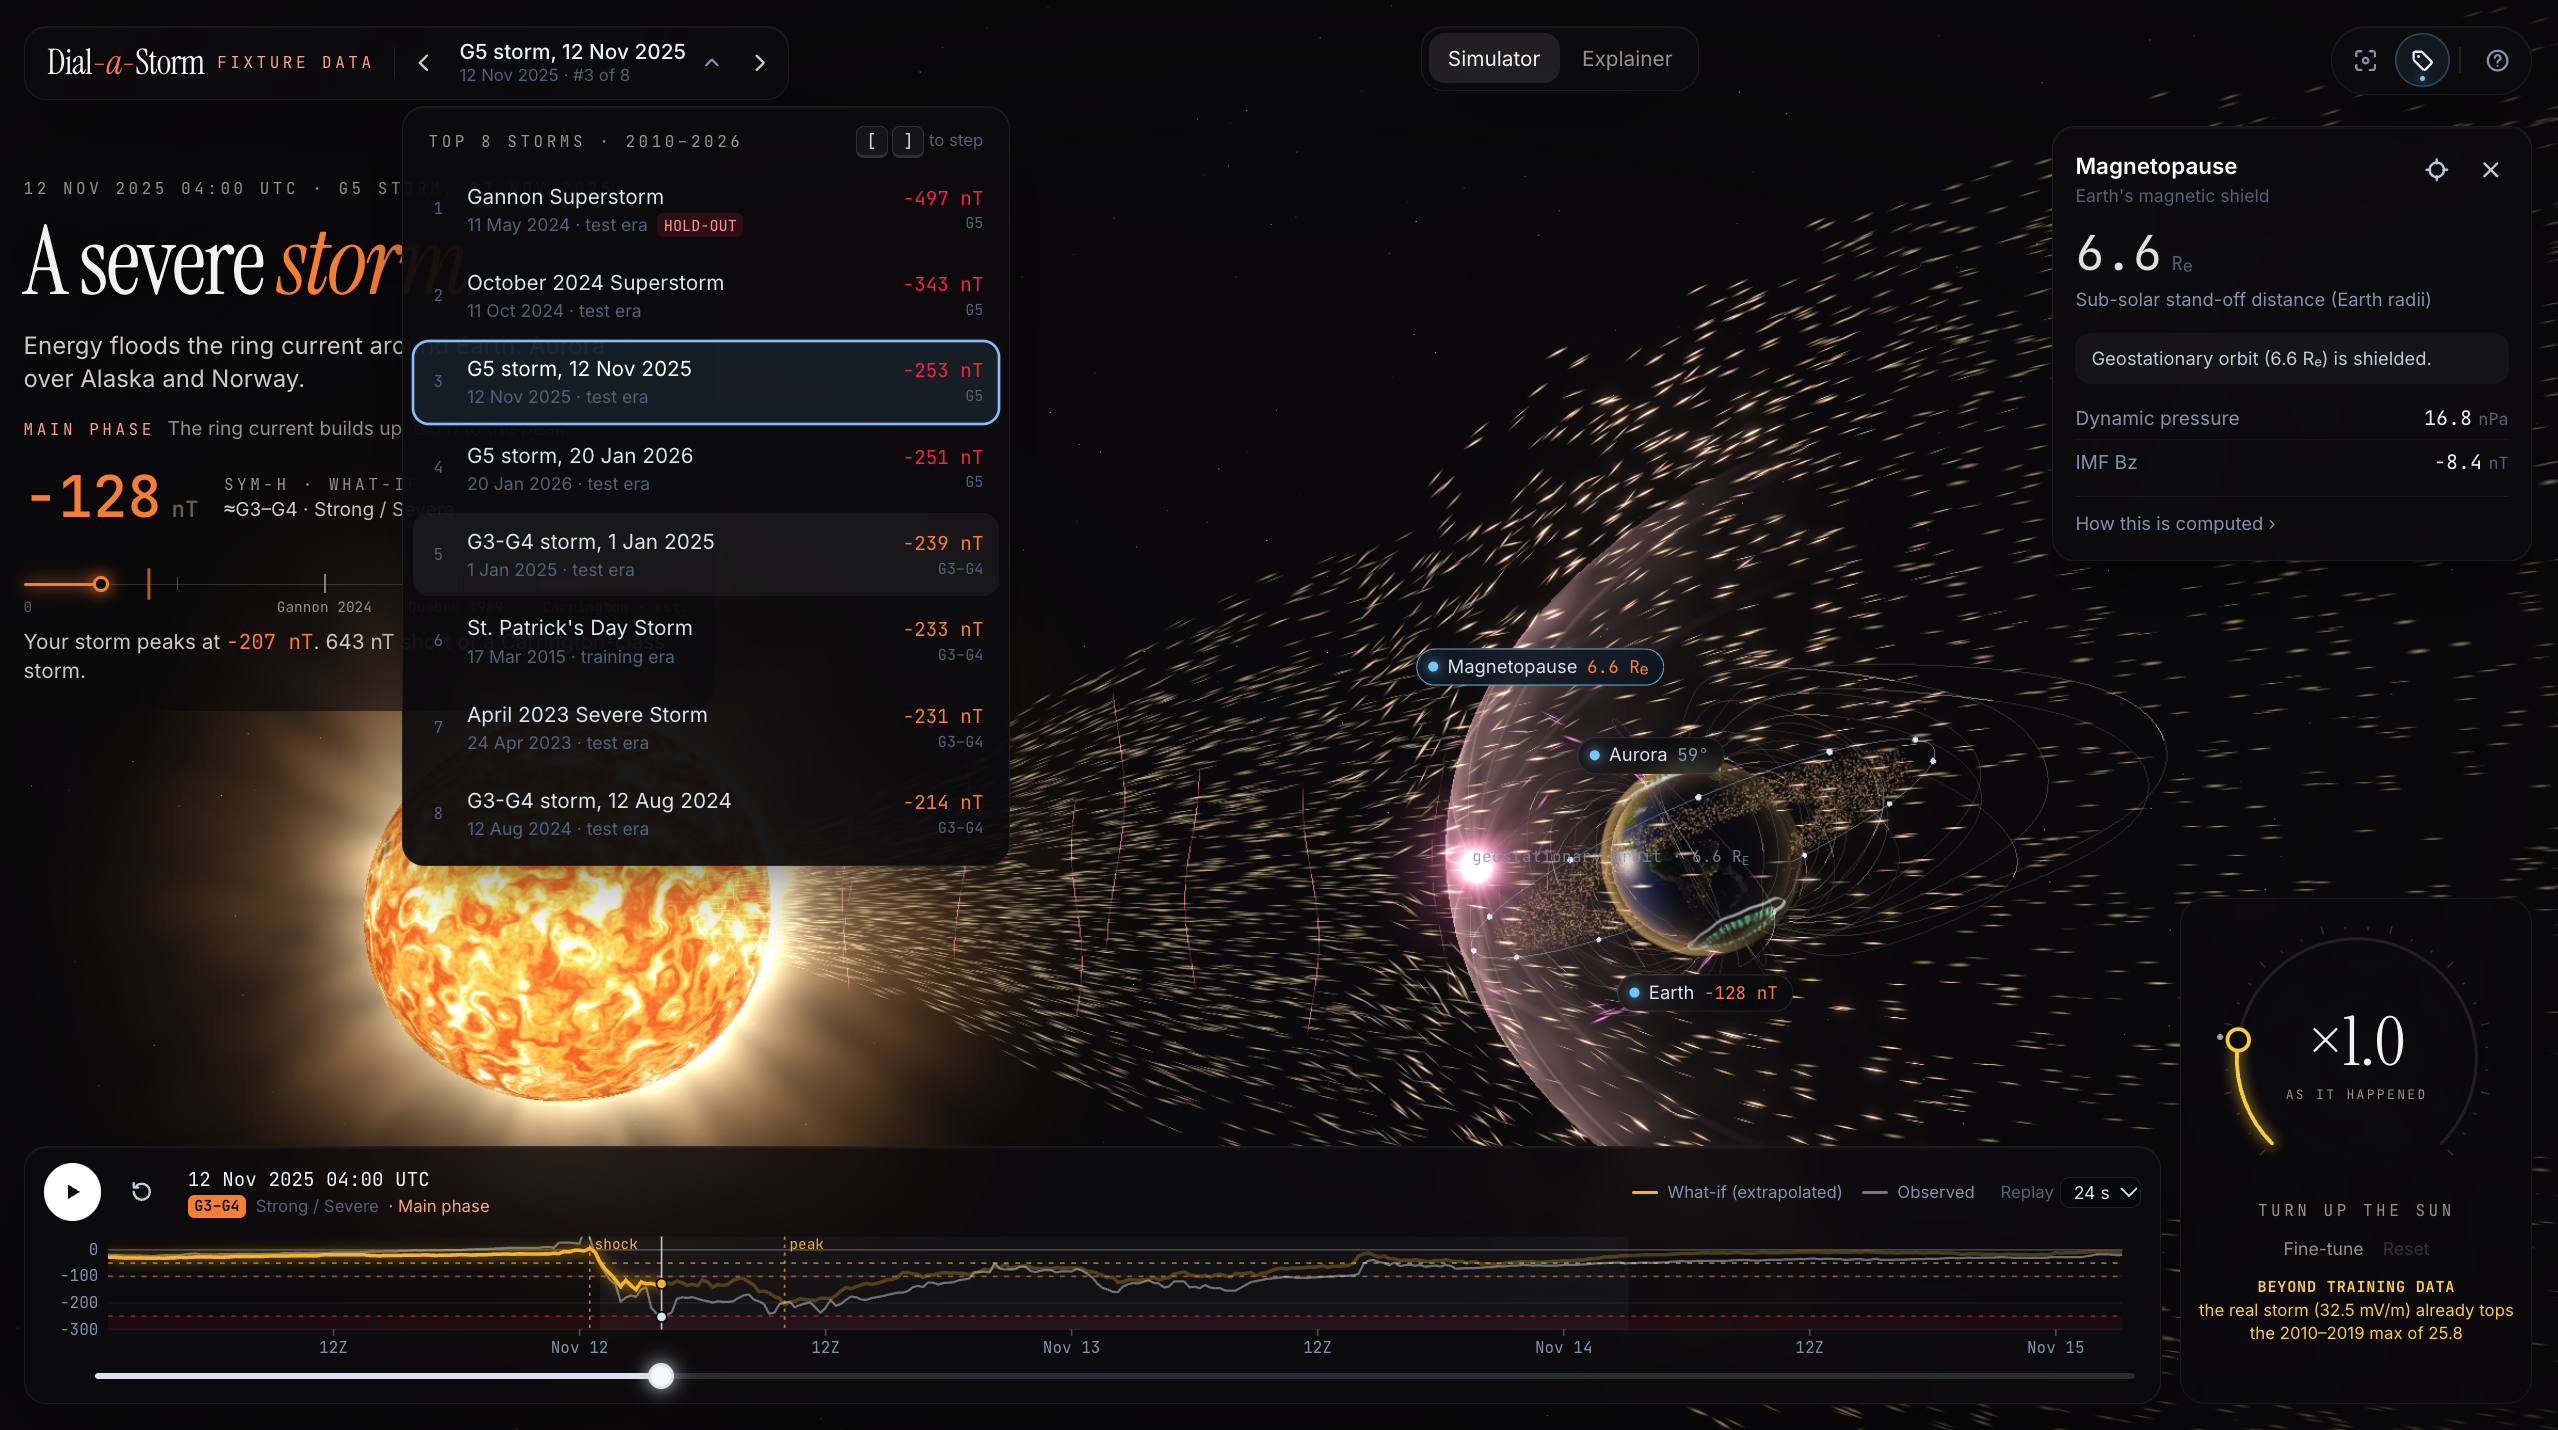
Dial-a-Storm is an interactive 3D space-weather simulator powered by real NASA data and machine learning.
It allows users to explore how solar activity affects Earth's magnetic field and how different solar wind conditions can influence the intensity of geomagnetic storms.
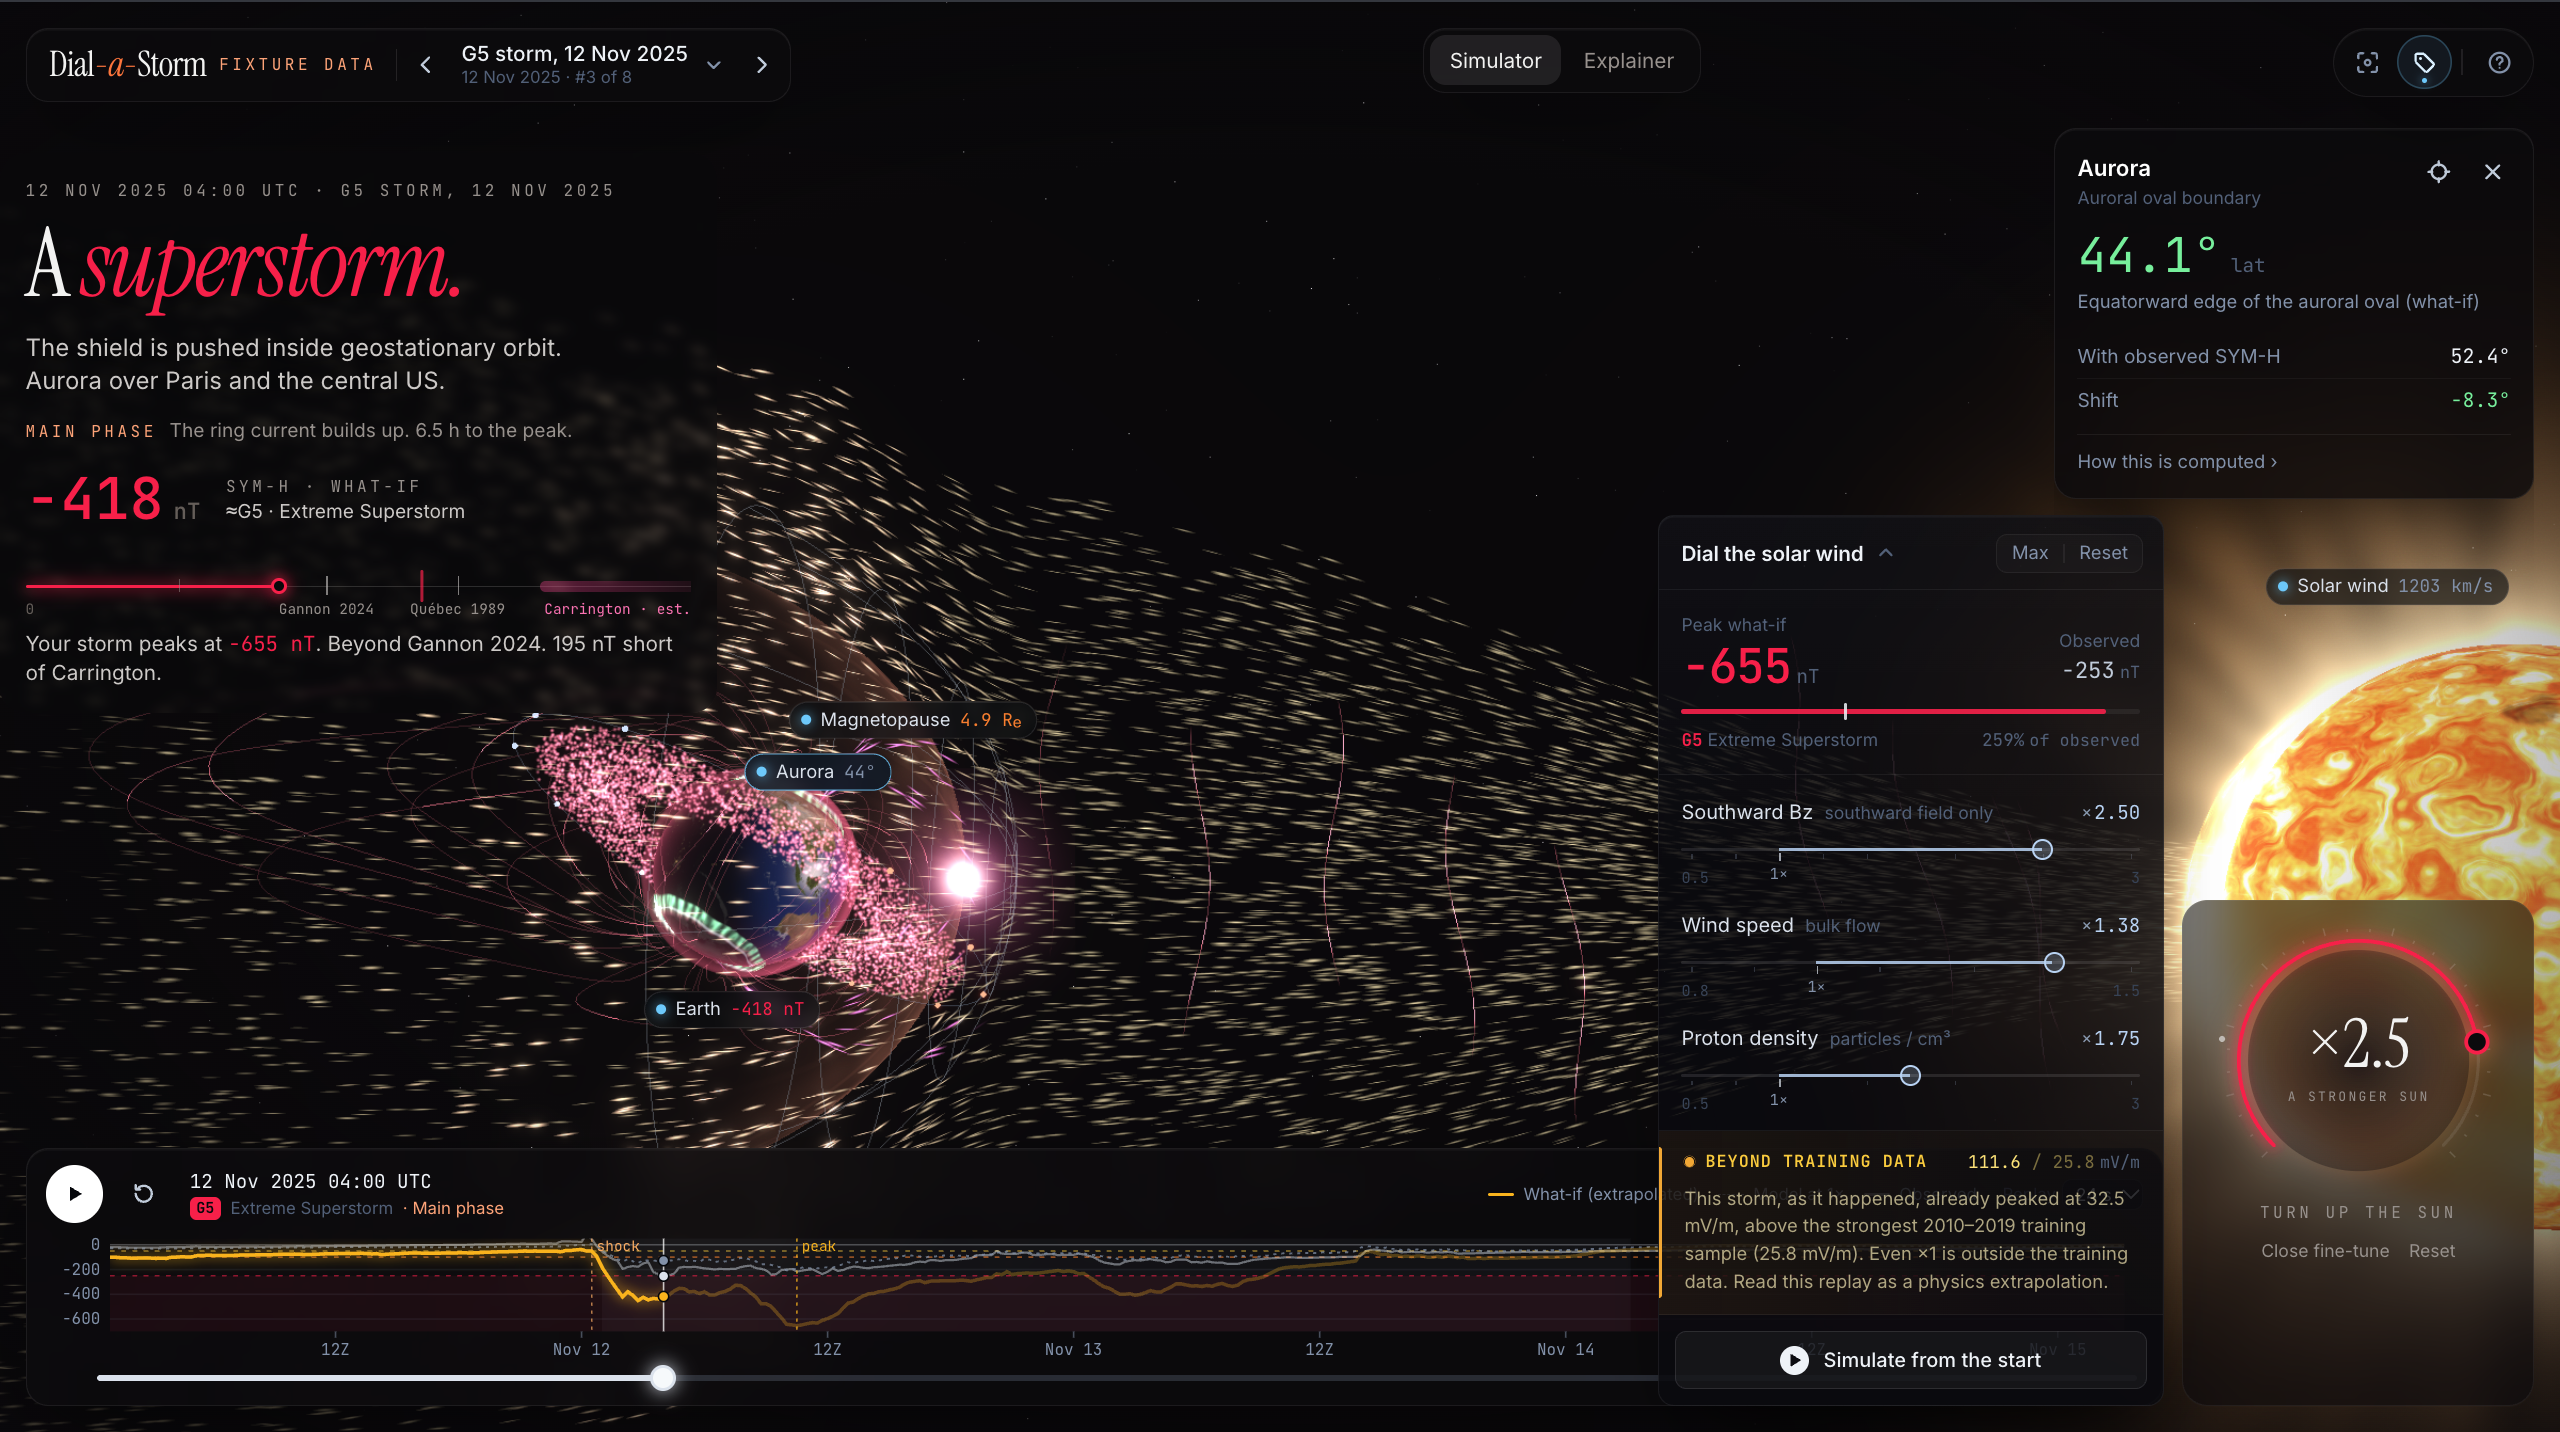
Users can adjust three main parameters:
- Solar Wind Speed: Experiment with faster or slower solar wind approaching Earth.
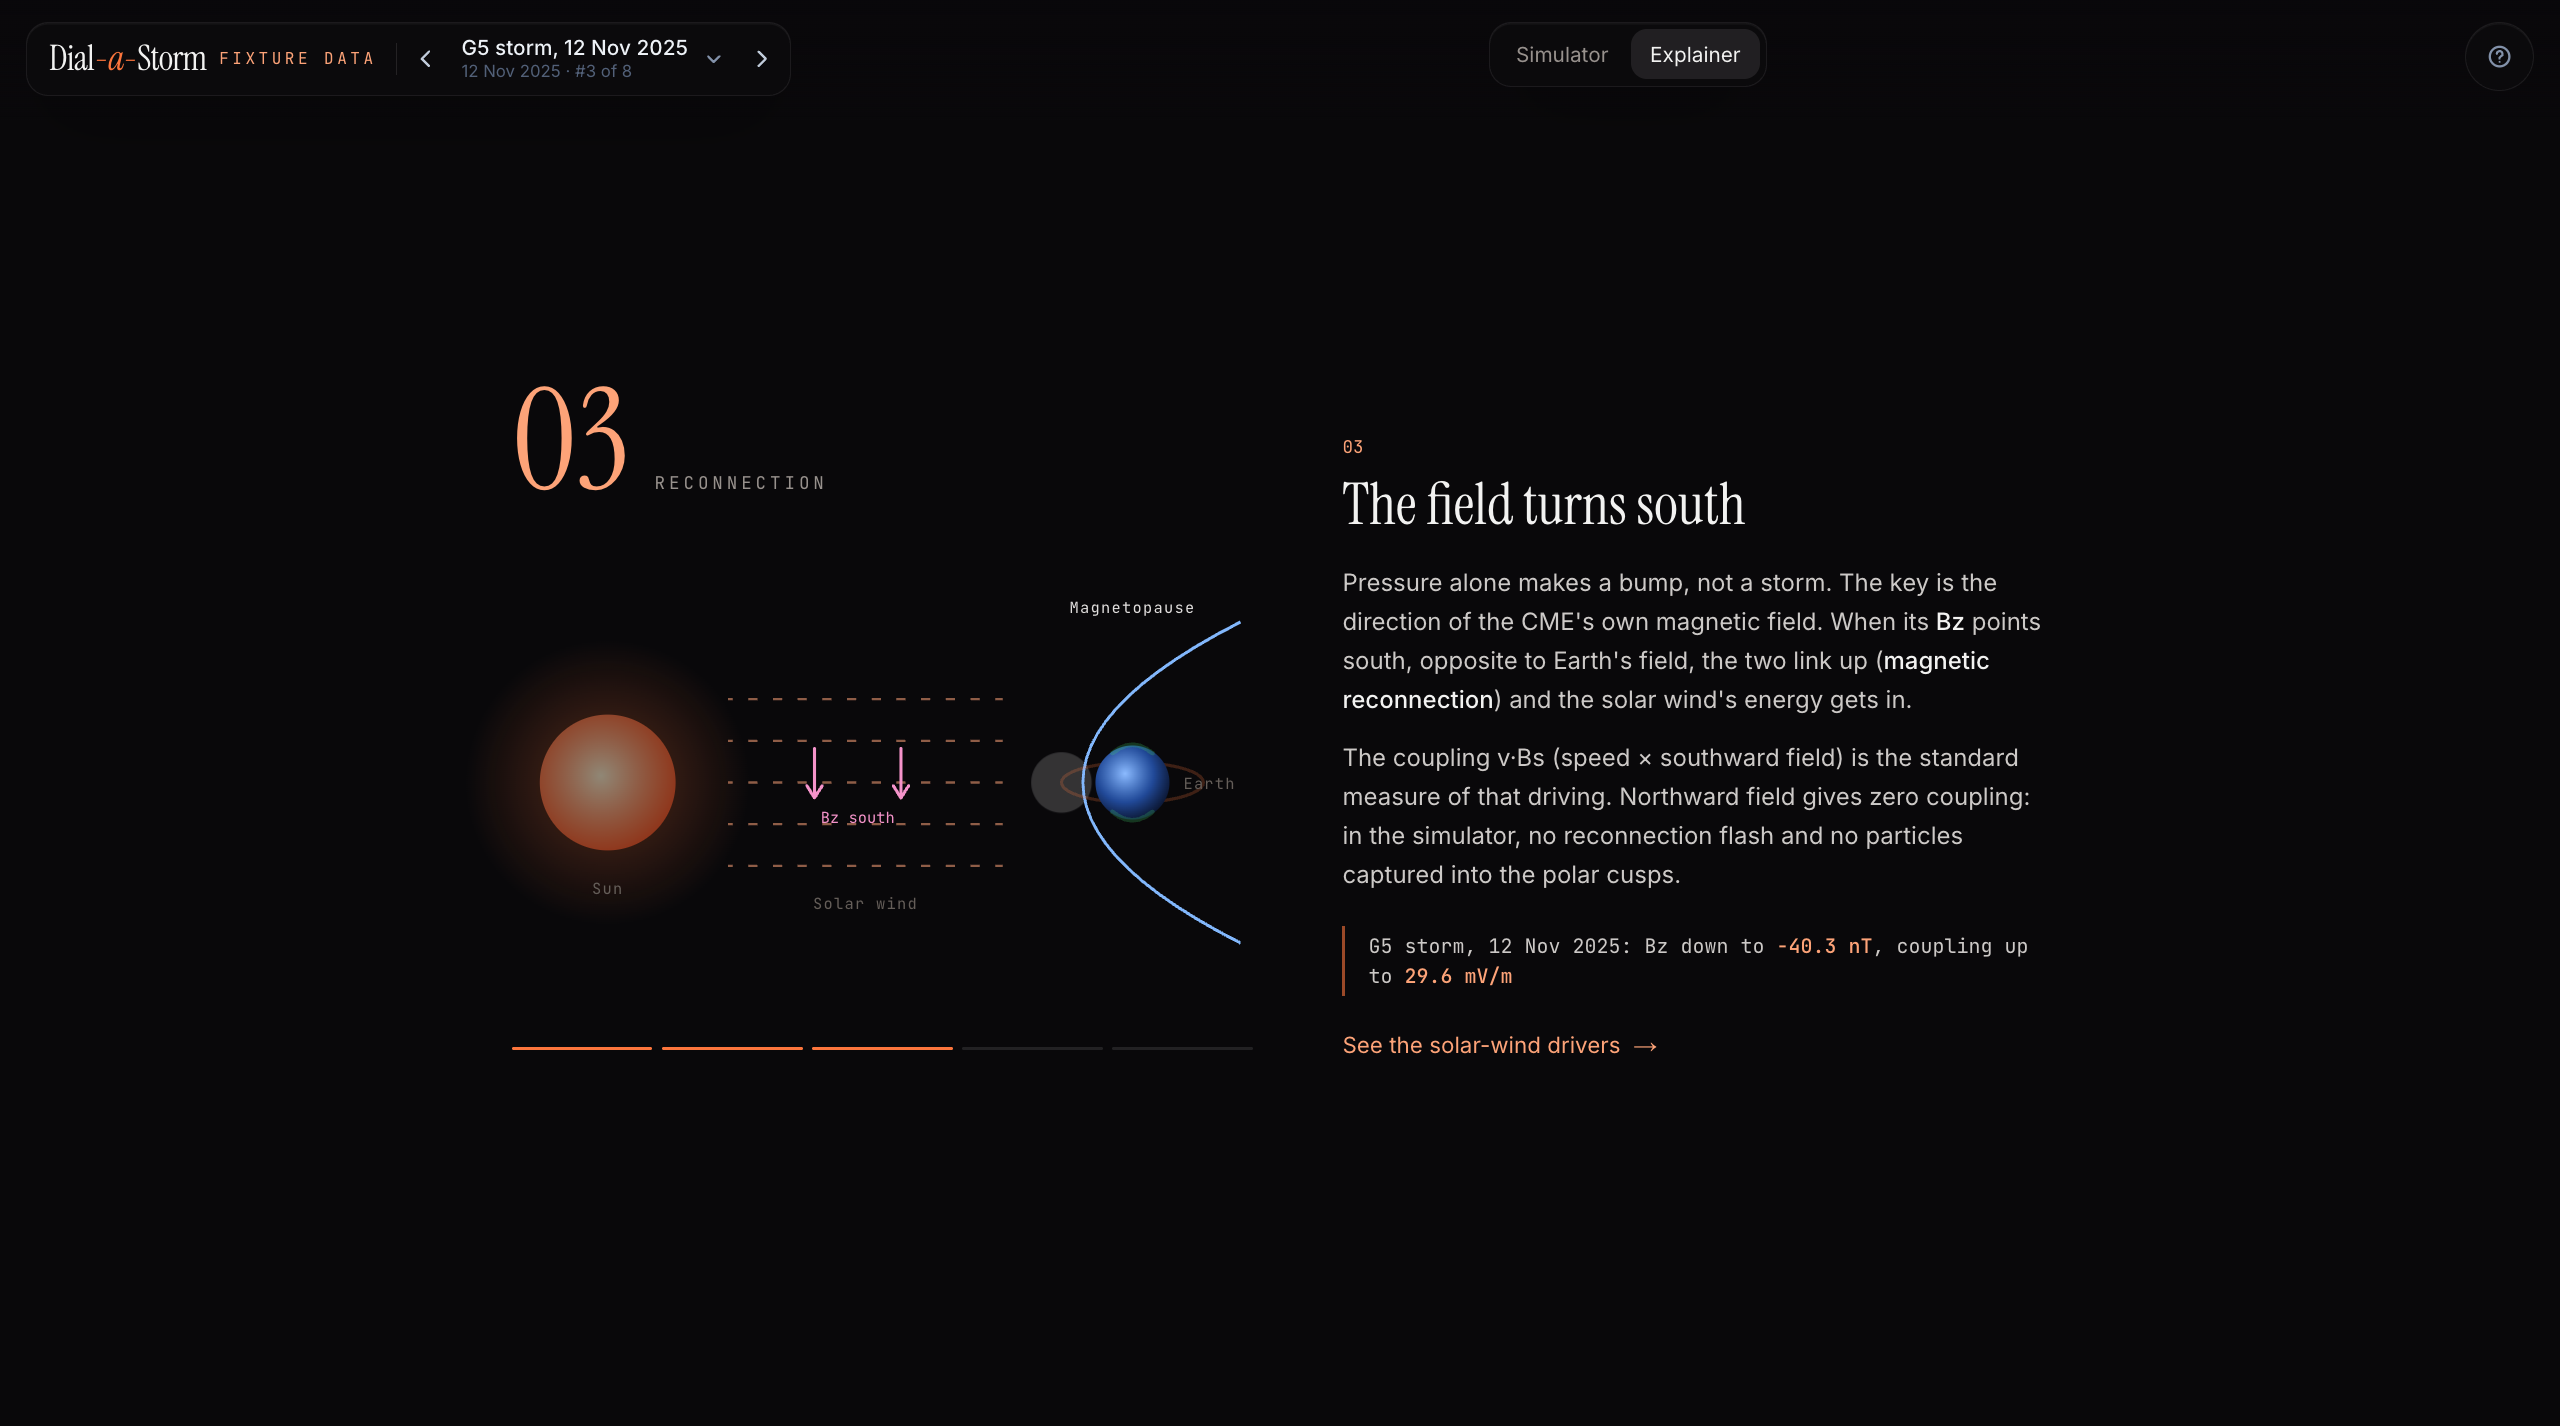
- Magnetic Field (Bz): Change the direction and strength of the interplanetary magnetic field.
- Particle Density: Explore how changes in solar wind density affect storm conditions.
As users adjust these parameters, the simulator updates its predictions and 3D visualization to show how the storm could develop.
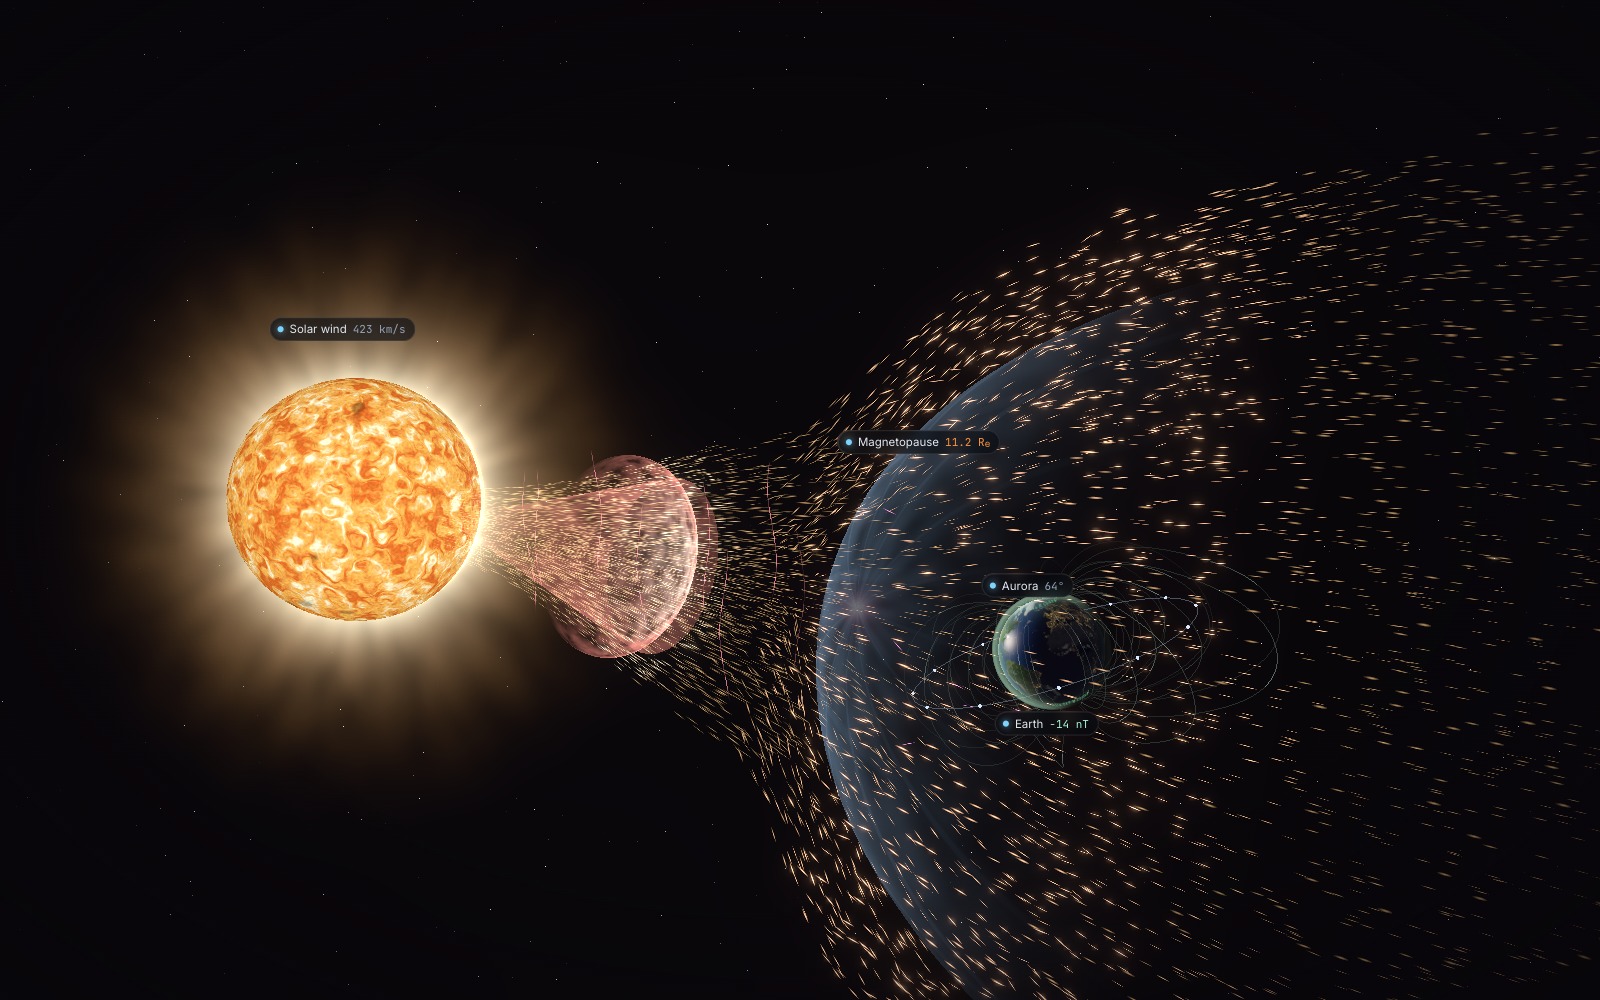
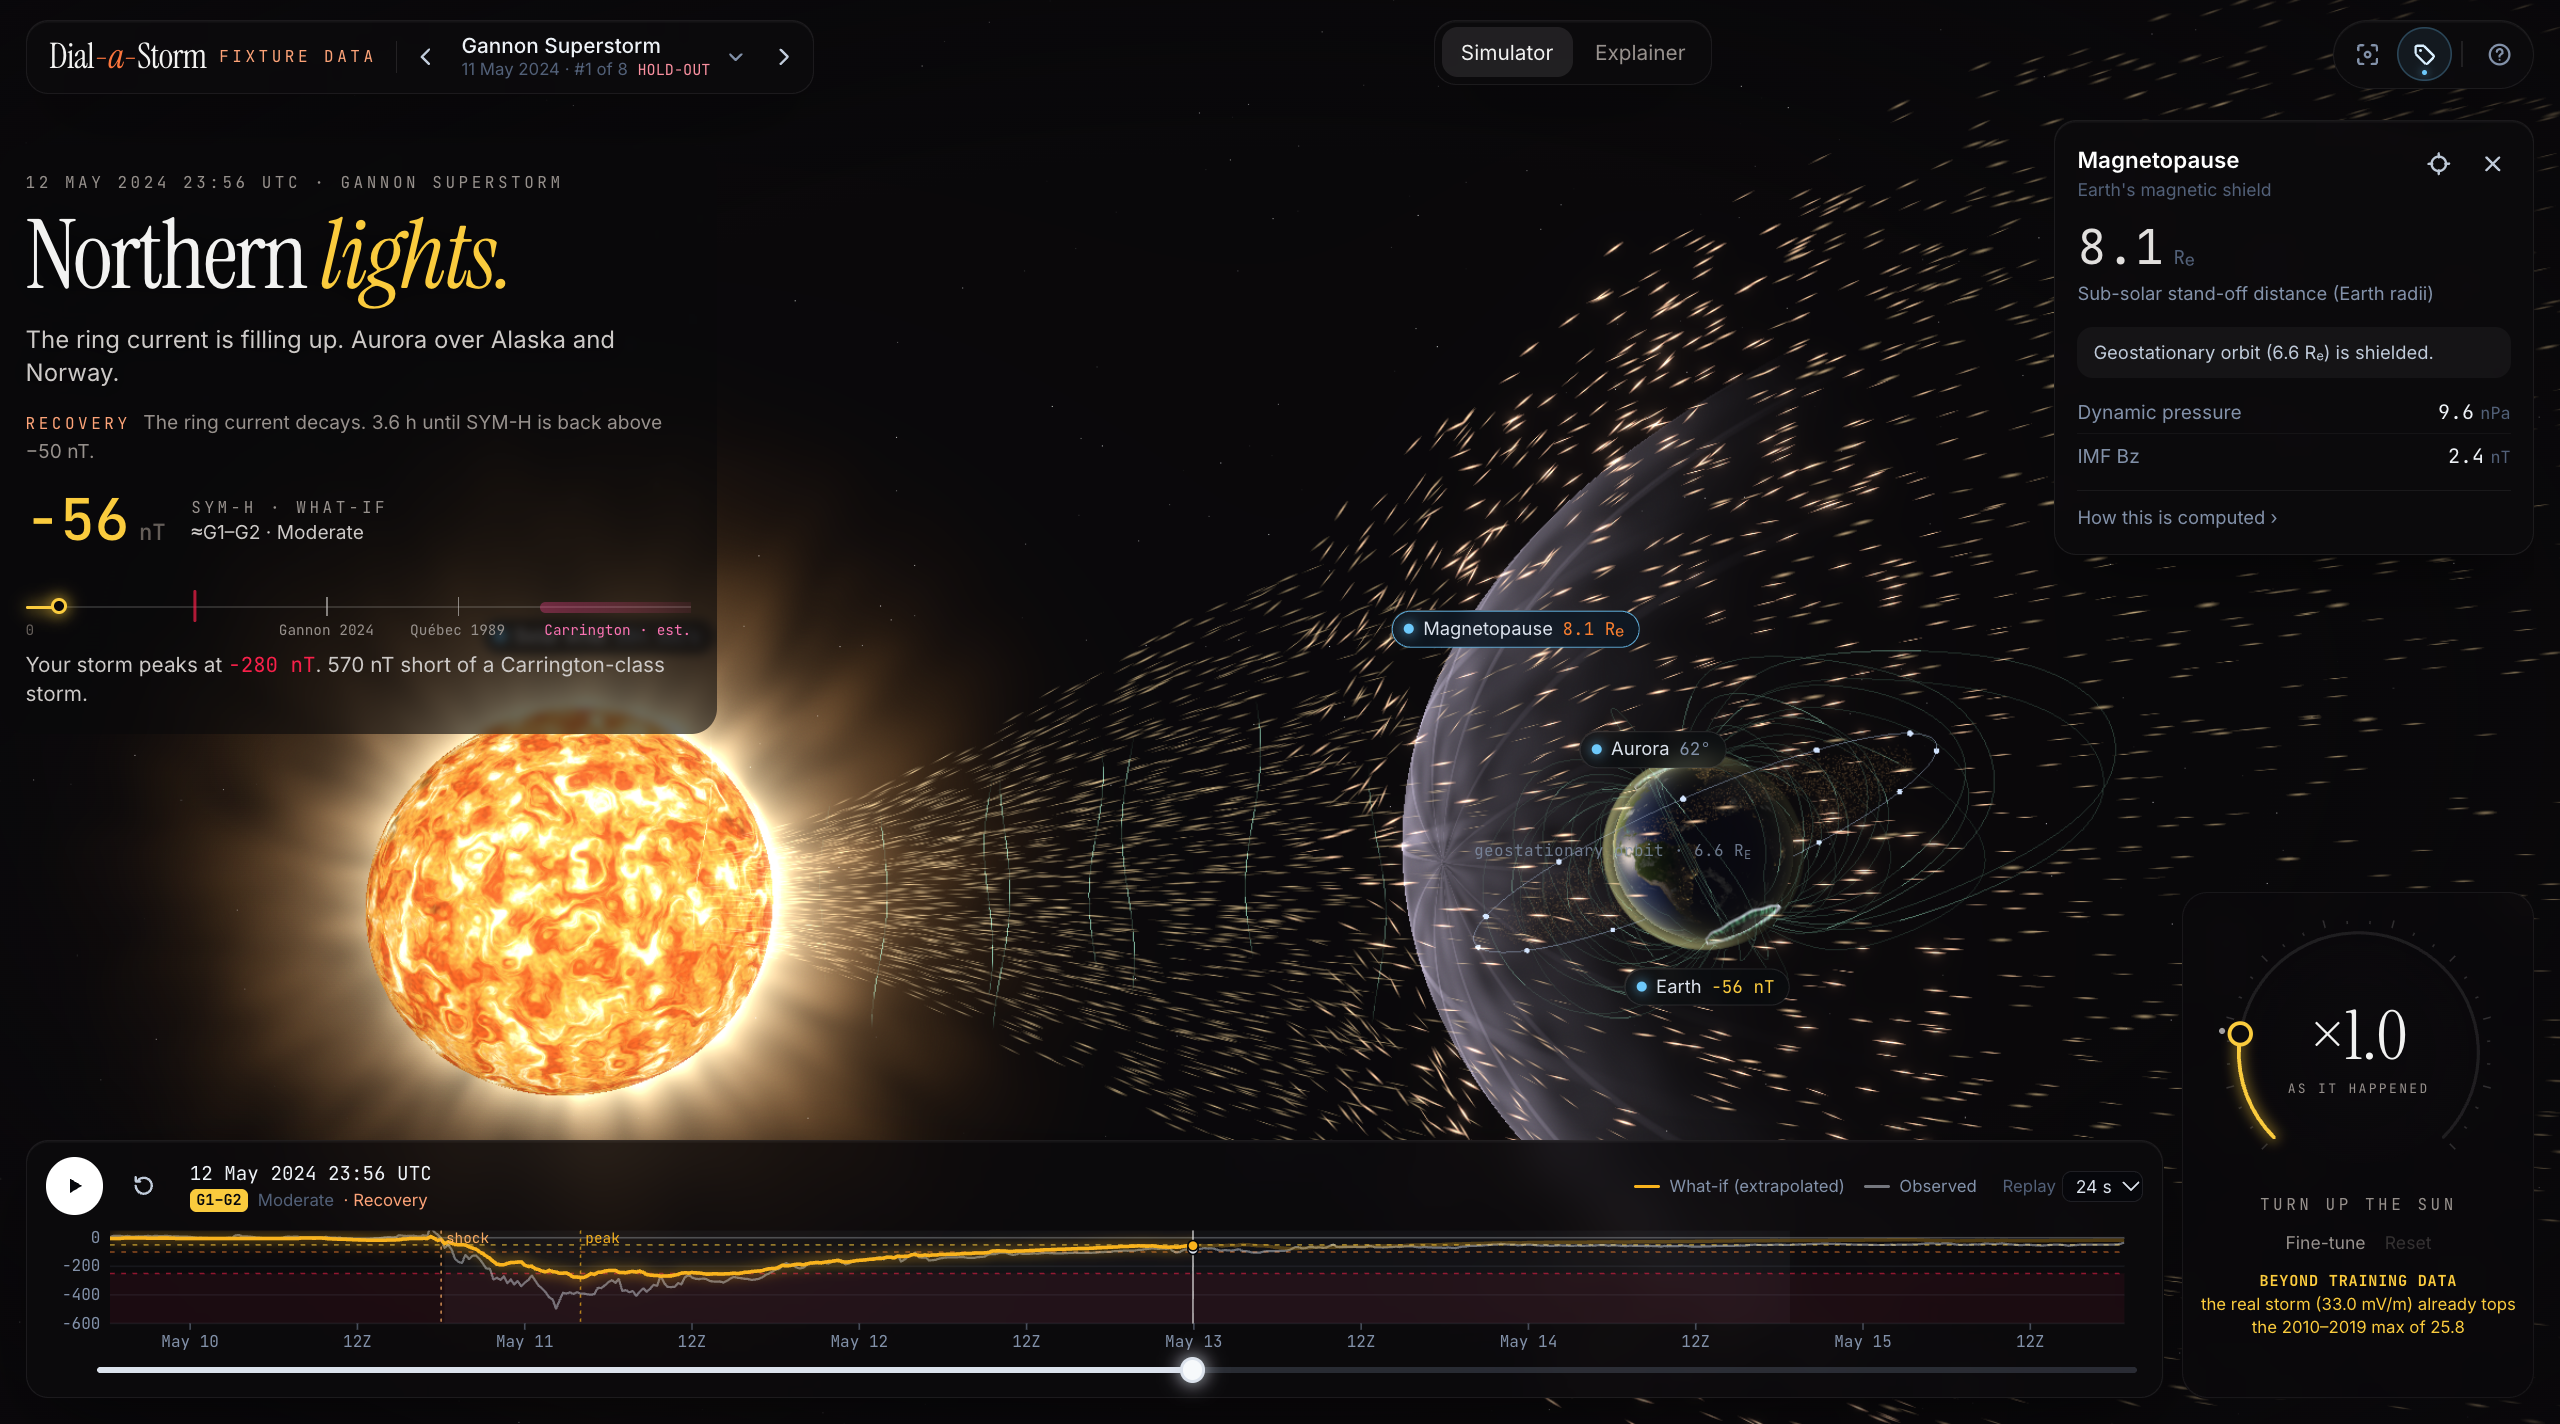
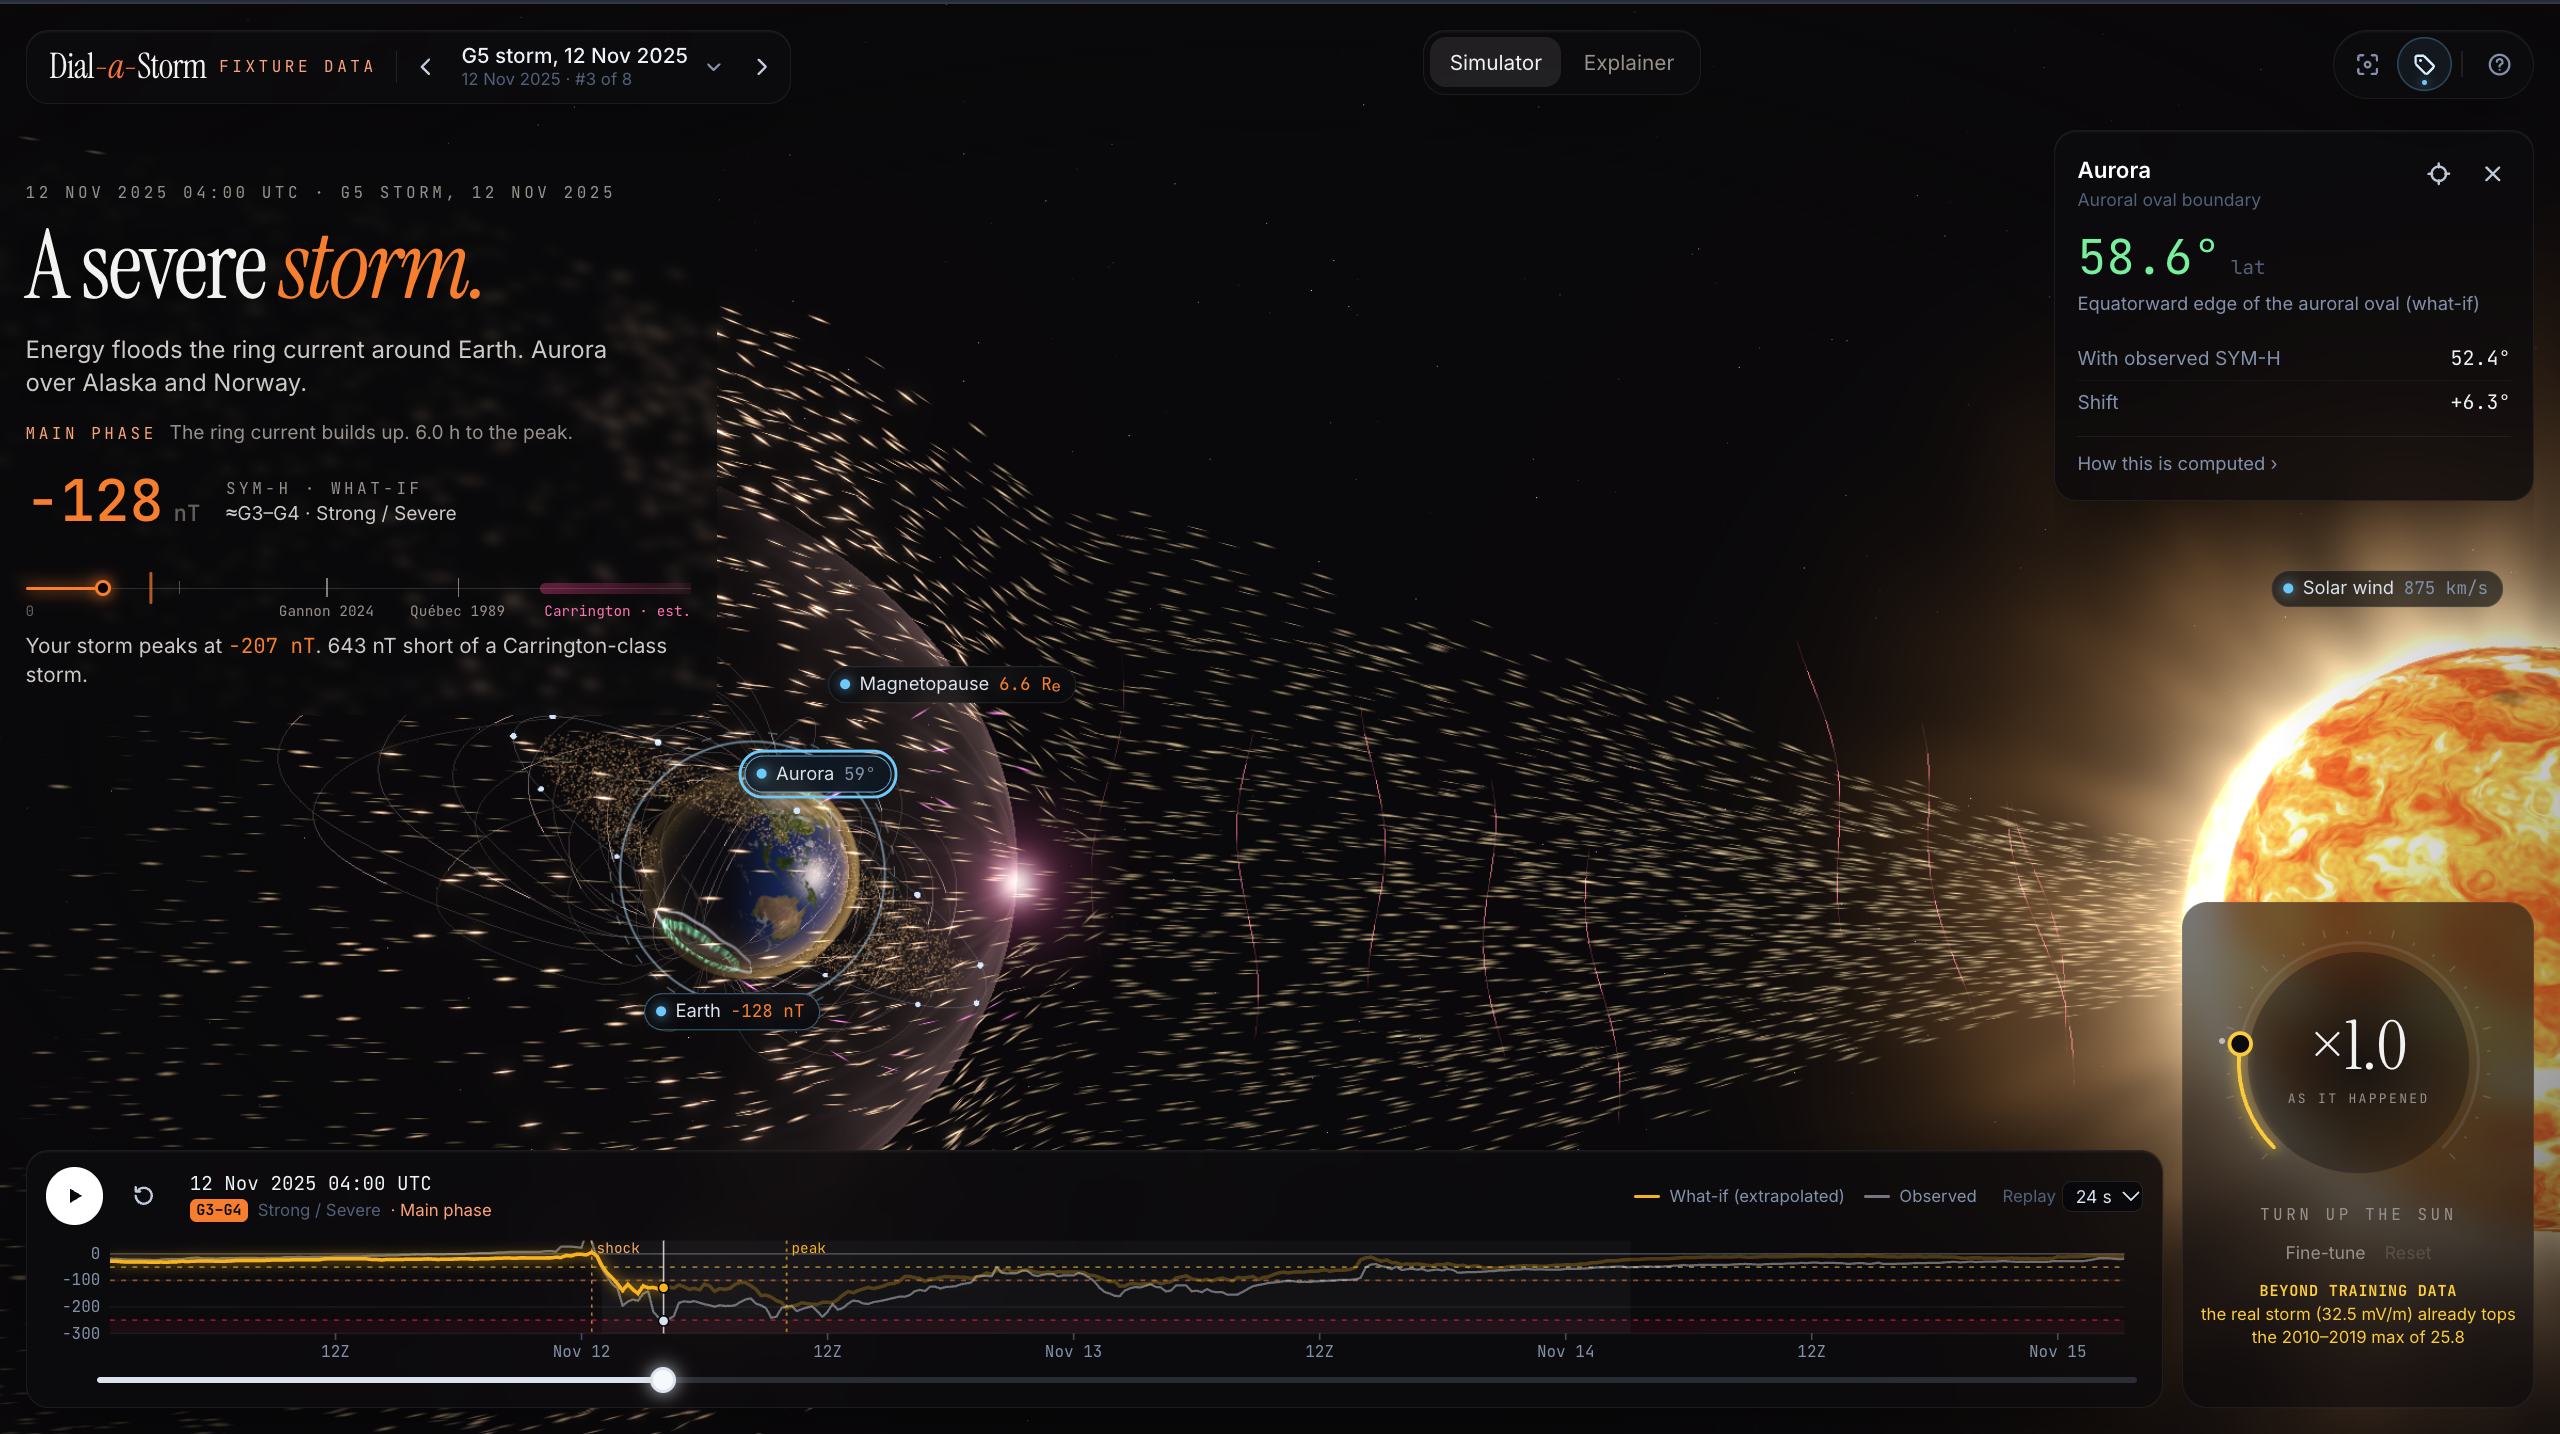
The experience includes an interactive representation of the Sun, solar wind, Earth's magnetosphere, and auroras, allowing users to see how these systems interact.
Behind the scenes, our machine-learning model predicts the SYM-H geomagnetic index, which helps measure the intensity of geomagnetic disturbances. Users can explore historical storms, experiment with alternative conditions, and compare simulated outcomes.
Dial-a-Storm also explains how severe geomagnetic storms can affect technology we depend on, including satellites, GPS navigation, radio communications, and power grids.
Our goal is to make space weather something people can actually explore, even without a background in physics or astronomy.
How we built it
We built Dial-a-Storm using Python, NASA's OMNI dataset, Ridge Regression, XGBoost, Next.js, and WebGL.
Data Collection and Processing
We used NASA's OMNI dataset, containing over 1.7 million observations of solar wind and geomagnetic conditions recorded at five-minute intervals between 2010 and October 2026.
We developed a Python pipeline to clean and process the data, create features from historical measurements, and prepare the dataset for machine-learning training.
Because geomagnetic storms develop over time, we included historical solar wind conditions and time-dependent features to help our model understand how earlier measurements influence later geomagnetic activity.
Machine-Learning Model
Our prediction system uses a hybrid Ridge Regression and XGBoost model.
Ridge Regression provides the main prediction, while XGBoost learns corrections to improve its accuracy. We chose this approach after finding that tree-based models alone struggled to make reliable predictions for extreme storms outside the conditions they had encountered during training.
We evaluated the model using unseen data from 2023–2026, achieving:
- R² Score: 0.79
- RMSE: 11.5 nT
These results gave us a useful starting point for predicting geomagnetic storm behaviour while still recognizing the uncertainty involved in extreme events.
What-If Simulation Engine
To keep the application responsive, we precomputed 288 what-if scenarios for each of eight major historical geomagnetic storms, giving us 2,304 scenario configurations.
Each scenario represents a different combination of solar wind conditions.
When users adjust the simulation controls, our application dynamically blends the precomputed predictions to estimate how the storm might behave under the selected conditions.
This allows users to experiment without waiting for a machine-learning model to run every time they move a slider.
Interactive 3D Visualization
We built the web application using Next.js, with WebGL powering the interactive 3D environment.
The visualization brings together the Sun, solar wind, Earth, its magnetic field, and auroral activity.
We connected the prediction system to the visual experience so changes in the simulation parameters affect both the estimated geomagnetic response and the 3D scene.
We also made sure users could distinguish between actual historical measurements and simulated outcomes.
Challenges we ran into
Preventing Data Leakage
One of our biggest challenges was making sure our machine-learning model was predicting future geomagnetic conditions without accidentally using information that would not have been available at prediction time.
Because our dataset contains time-series measurements, even a small mistake in feature engineering or data splitting could produce misleadingly good results.
We had to carefully handle historical features and chronological train-test splits to make our evaluation more realistic.
Predicting Extreme Geomagnetic Storms
Another major challenge was handling unusually strong events, especially the May 2024 Gannon superstorm.
We discovered that tree-based models such as XGBoost struggled to extrapolate beyond the conditions represented in their training data.
To address this, we developed a hybrid approach that uses Ridge Regression as the backbone and XGBoost to predict residual corrections.
Although this improved our approach, predicting rare extreme events remains a limitation we want to work on.
Connecting Machine Learning with 3D Visualization
Building the prediction model was only part of the challenge. We also had to translate its output into an interactive visual experience.
Geomagnetic storms develop and recover over time, and we wanted the visualization to communicate these changes without becoming overwhelming or slowing down the application.
Precomputing simulation scenarios helped us keep the experience responsive while allowing users to experiment with different conditions.
Keeping the Science Honest
We also had to make an important distinction between real observations and hypothetical simulations.
Our model estimates how geomagnetic conditions might change, but it cannot perfectly predict every storm or directly calculate the exact damage to satellites and infrastructure.
We wanted Dial-a-Storm to be educational without giving users a false sense of scientific certainty.
Accomplishments that we're proud of
We're especially proud that we managed to turn a large scientific dataset into an application people can interact with and understand.
Some of our favourite accomplishments include:
- Processing over 1.7 million NASA observations and preparing them for machine-learning training.
- Achieving an R² score of 0.79 and an RMSE of 11.5 nT on unseen test data using our hybrid prediction model.
- Generating 2,304 what-if scenario configurations across eight major historical geomagnetic storms.
- Reconstructing the geomagnetic response of the May 2024 Gannon superstorm, the event that originally inspired our project.
- Building an interactive 3D environment that connects machine-learning predictions with visual changes in Earth's space-weather environment.
- Making complex space-weather data easier to explore through interactive controls and historical storm simulations.
What we're most proud of is the experience itself. Users don't have to understand machine-learning algorithms or read scientific datasets to start exploring.
They can change a few parameters, observe the results, and begin understanding why geomagnetic storms happen and how their intensity can change.
What we learned
This project taught us that working with real scientific data is very different from training a model on a simple, prepared dataset.
We learned how much attention time-series prediction requires, especially when preventing data leakage, engineering meaningful features, and evaluating performance on future observations.
We also learned that a good overall model score doesn't guarantee accurate predictions for rare extreme events. The May 2024 Gannon superstorm made this particularly clear.
Working with Ridge Regression and XGBoost helped us understand the strengths and weaknesses of different modelling approaches and why combining them can sometimes produce better results.
On the development side, we learned how to connect machine-learning outputs with a real-time 3D web application while keeping the interface responsive.
Perhaps our biggest lesson was that presenting data clearly matters as much as processing it. A prediction becomes much easier to understand when someone can interact with it and see what changes.
What's next for Dial-a-Storm
We have several ideas for taking Dial-a-Storm further.
Our first priority is improving how the model handles extreme geomagnetic storms, particularly events that fall outside the range of conditions seen during training.
We also want to integrate real-time space-weather measurements so users can explore current solar conditions alongside historical events.
Other improvements we're planning include:
- More Historical Storms: Expand our library so users can compare a wider range of geomagnetic events.
- Better Impact Modelling: Develop more detailed estimates of potential disruptions to satellites, GPS systems, communications, and power grids.
- Improved Scientific Accuracy: Make the 3D representation of Earth's magnetosphere and storm development more physically realistic.
- More Interactive Learning: Add explanations and guided experiments to help users understand why certain solar wind conditions produce stronger storms.
In the long term, we want Dial-a-Storm to become an accessible tool for students, educators, and anyone curious about space weather.
We started with one question after seeing the northern lights in Ontario: What would happen if the solar wind were different?
Dial-a-Storm is our attempt to let anyone explore that question for themselves.


