-
-
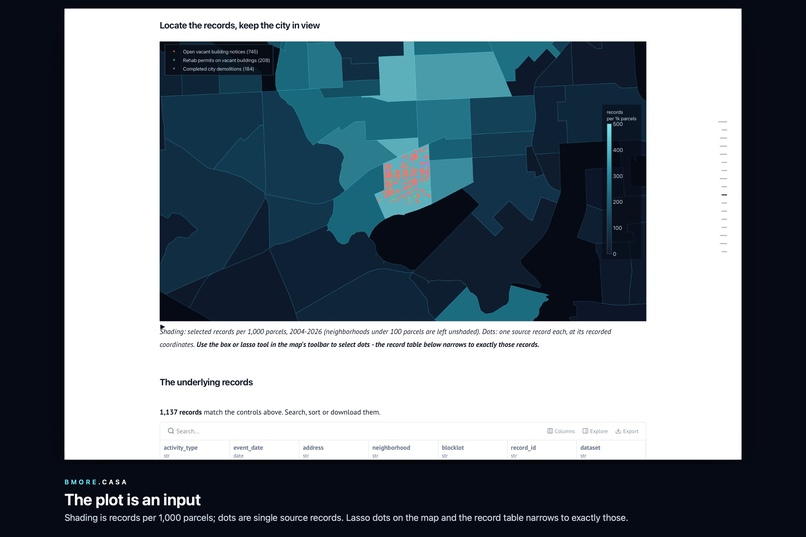
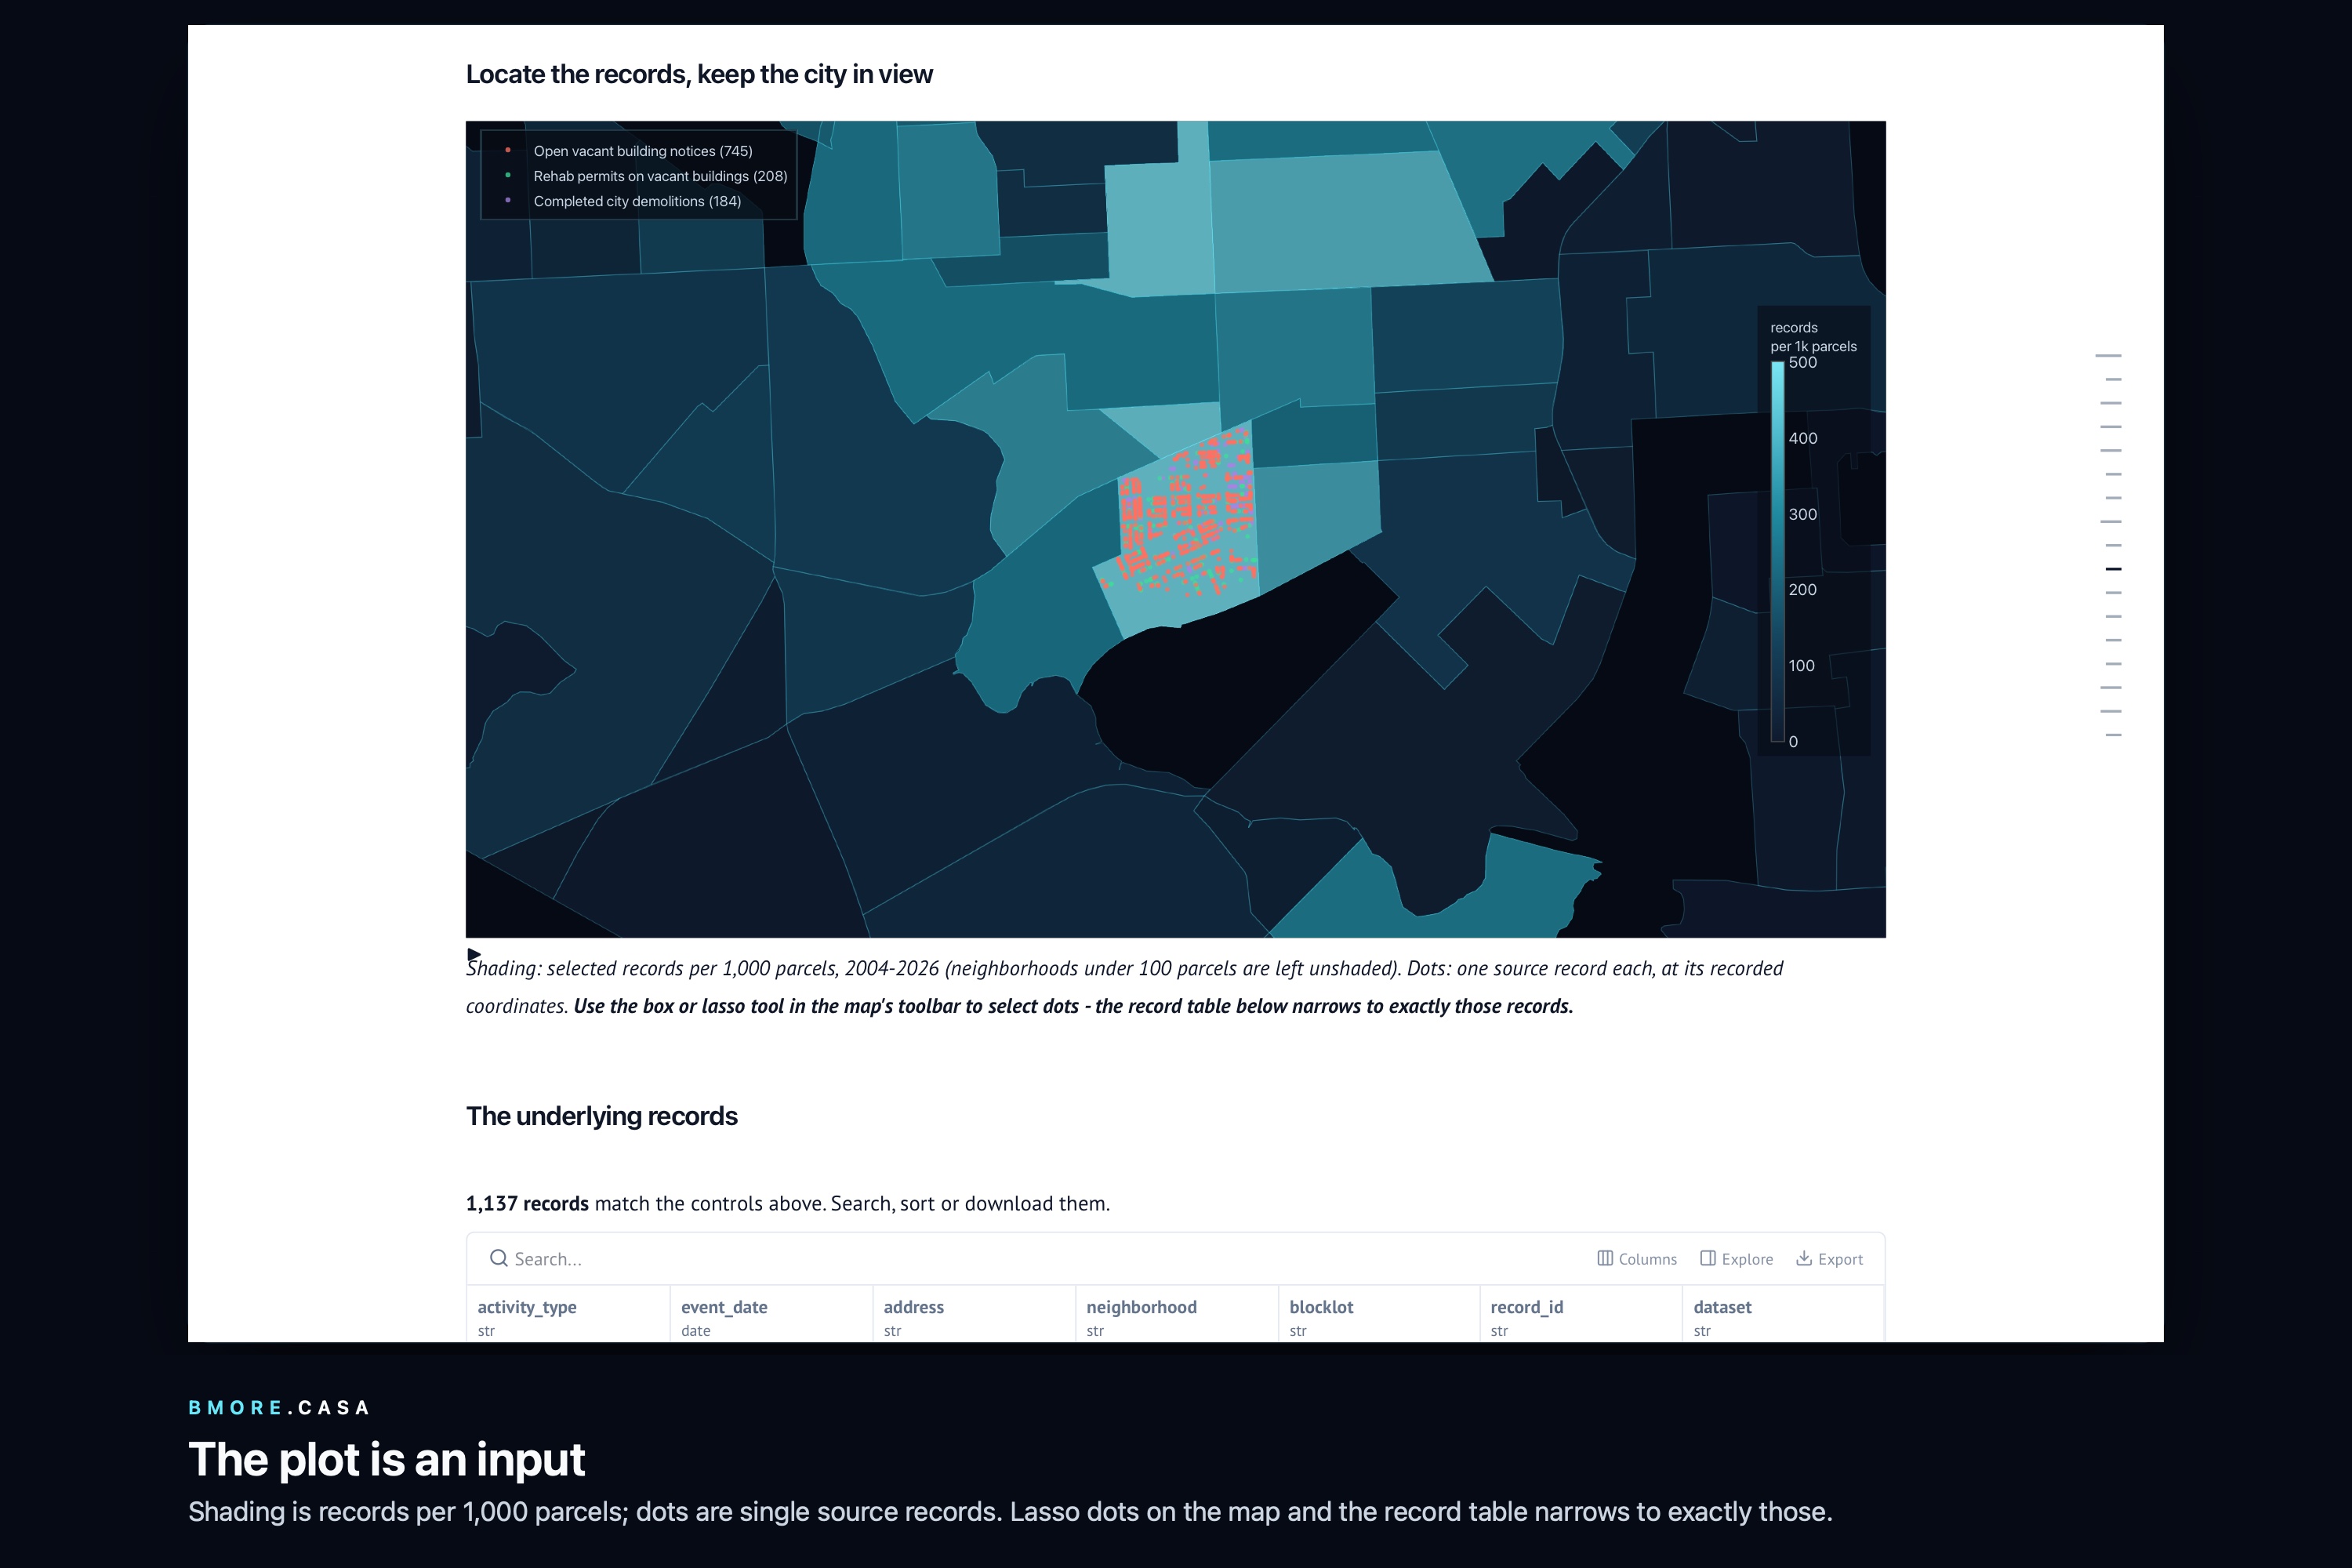
The lasso-able map following that selection
-
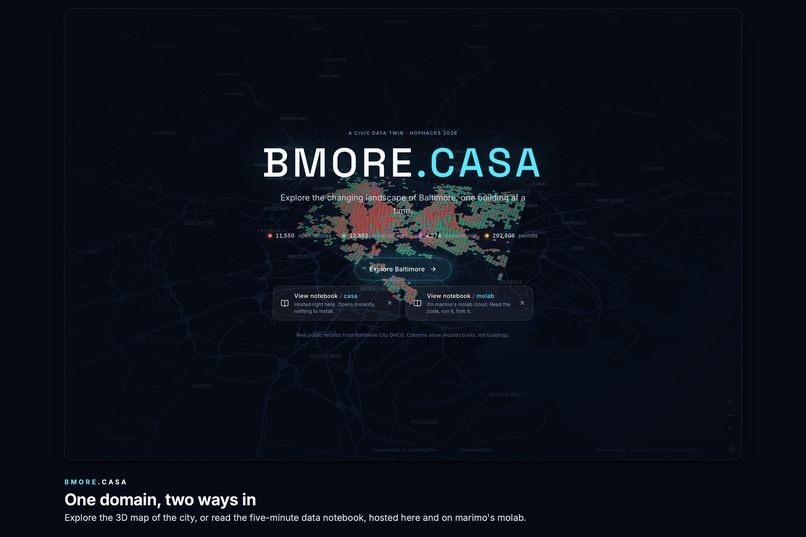
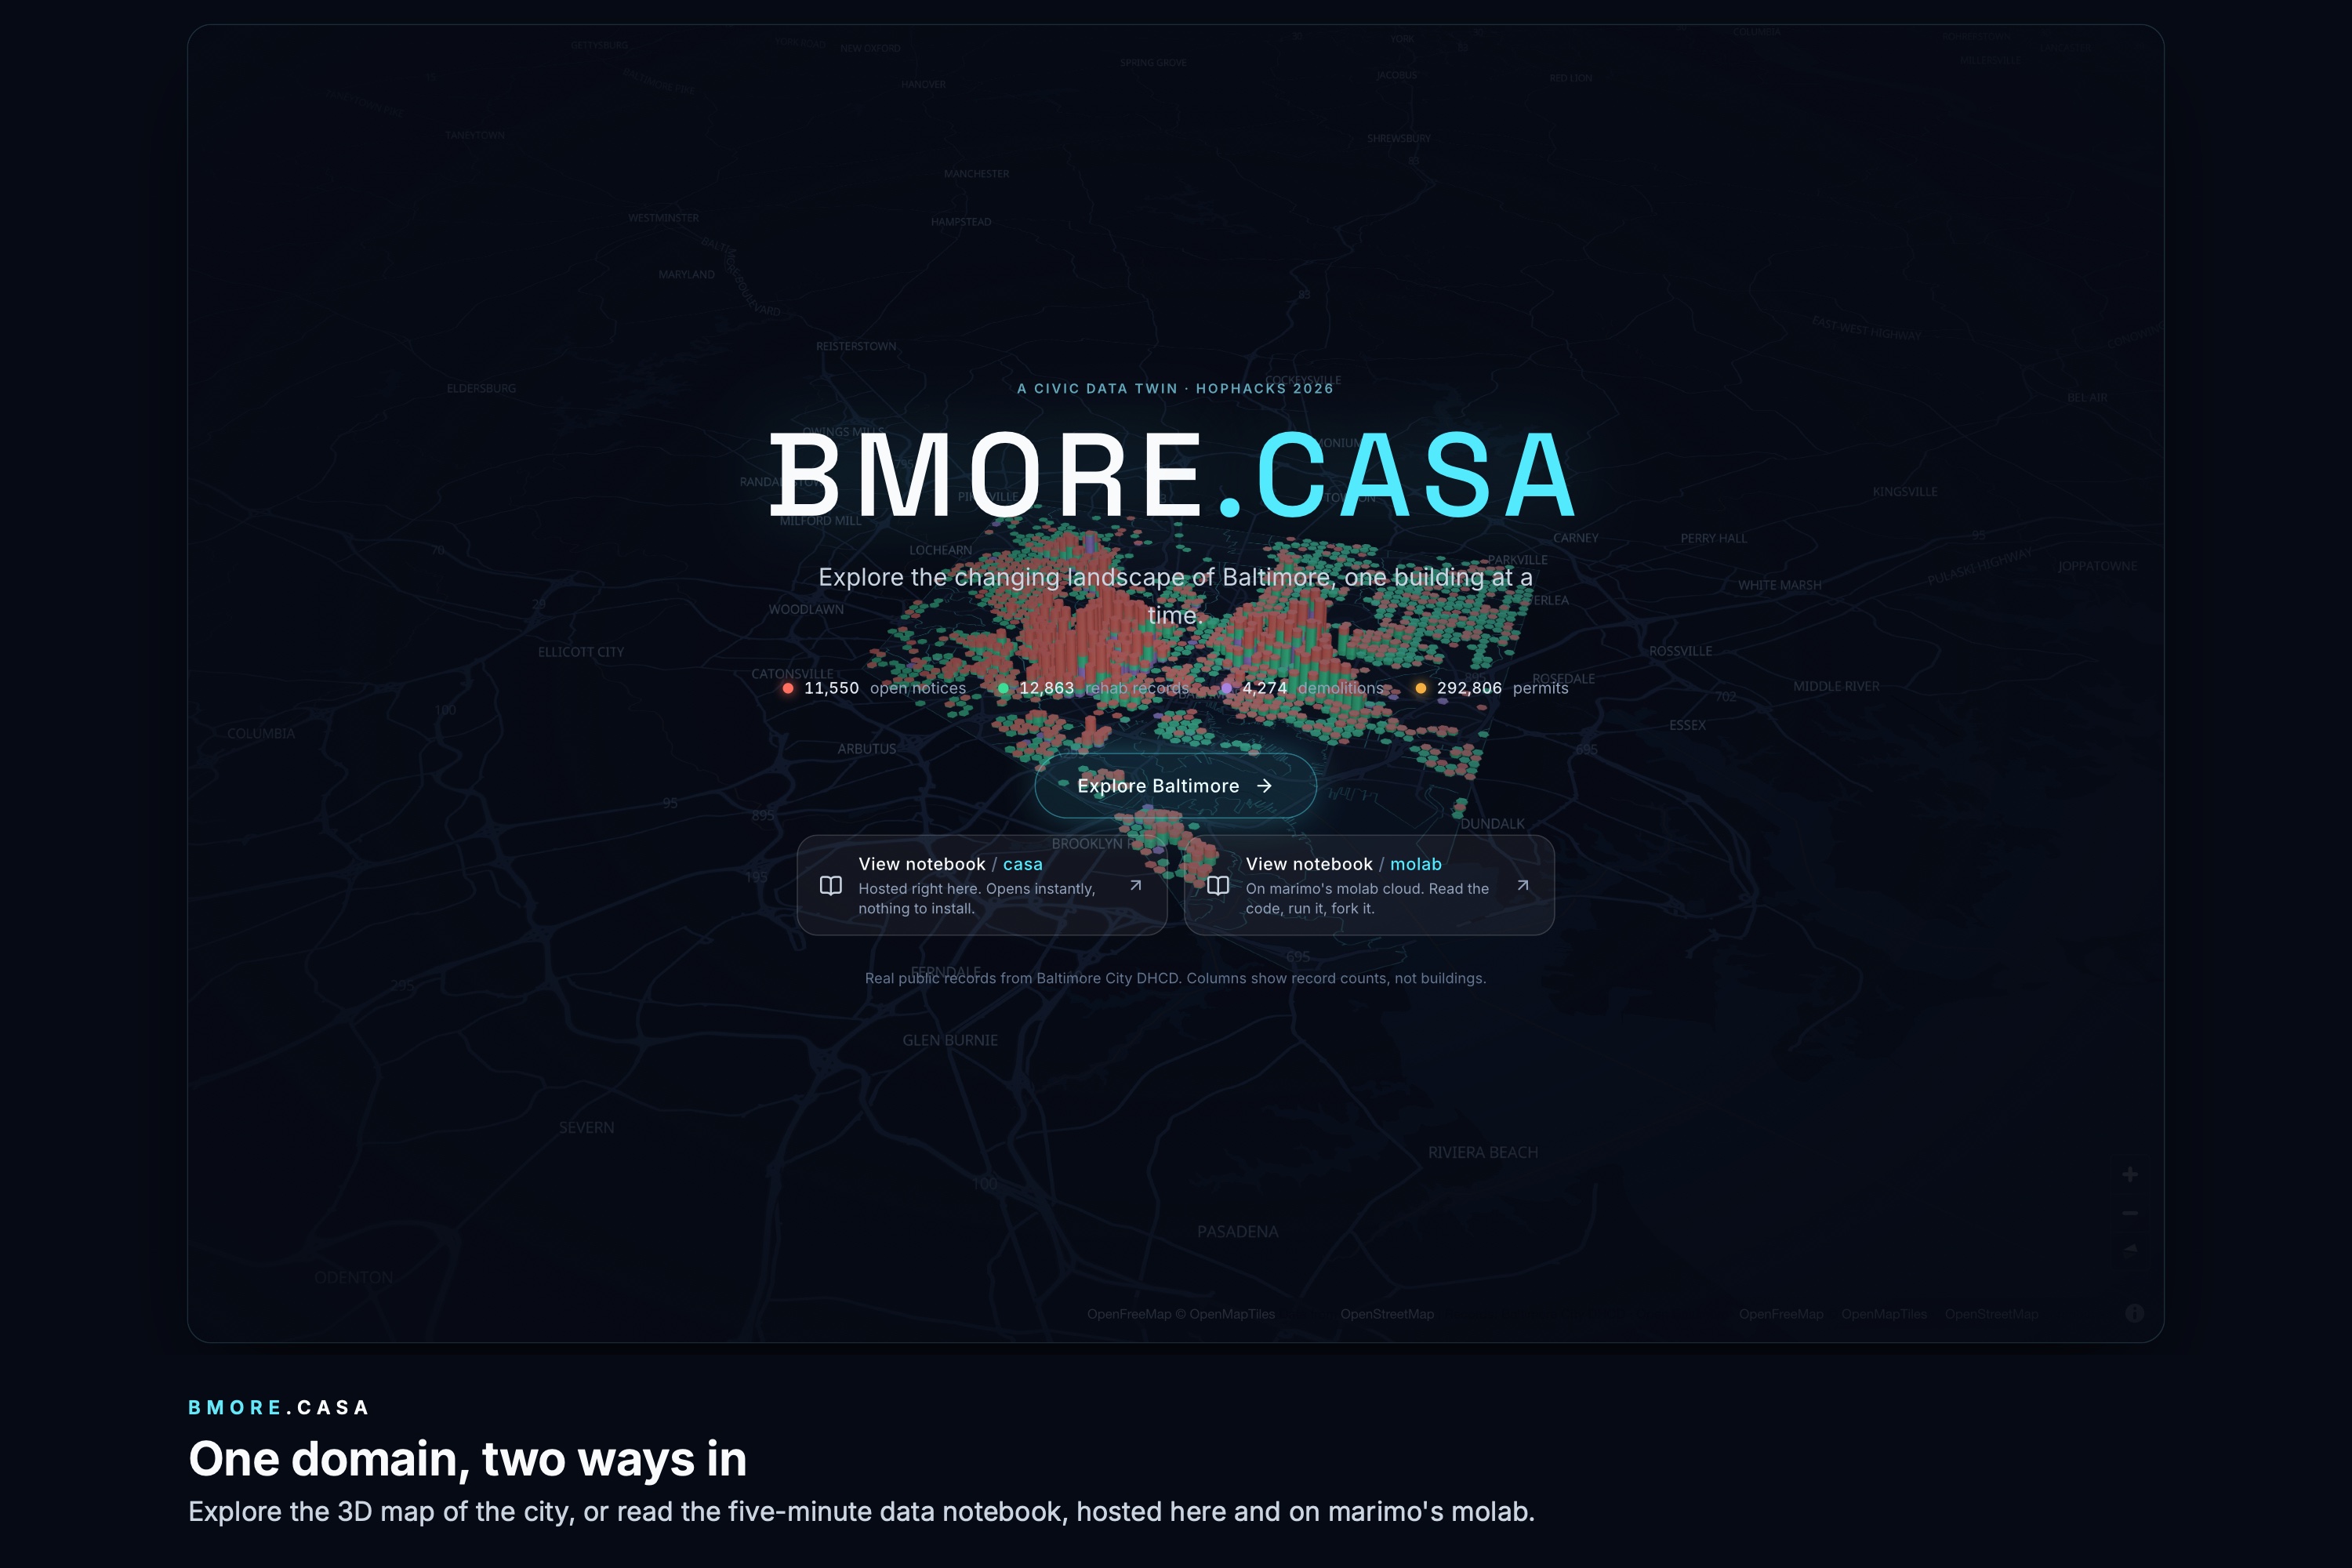
The three ways in: Explore Baltimore, notebook / casa, notebook / molab
-
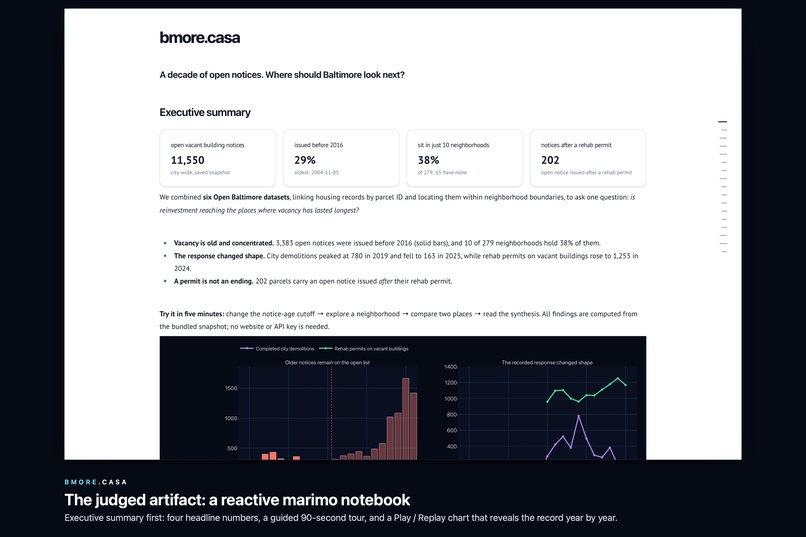
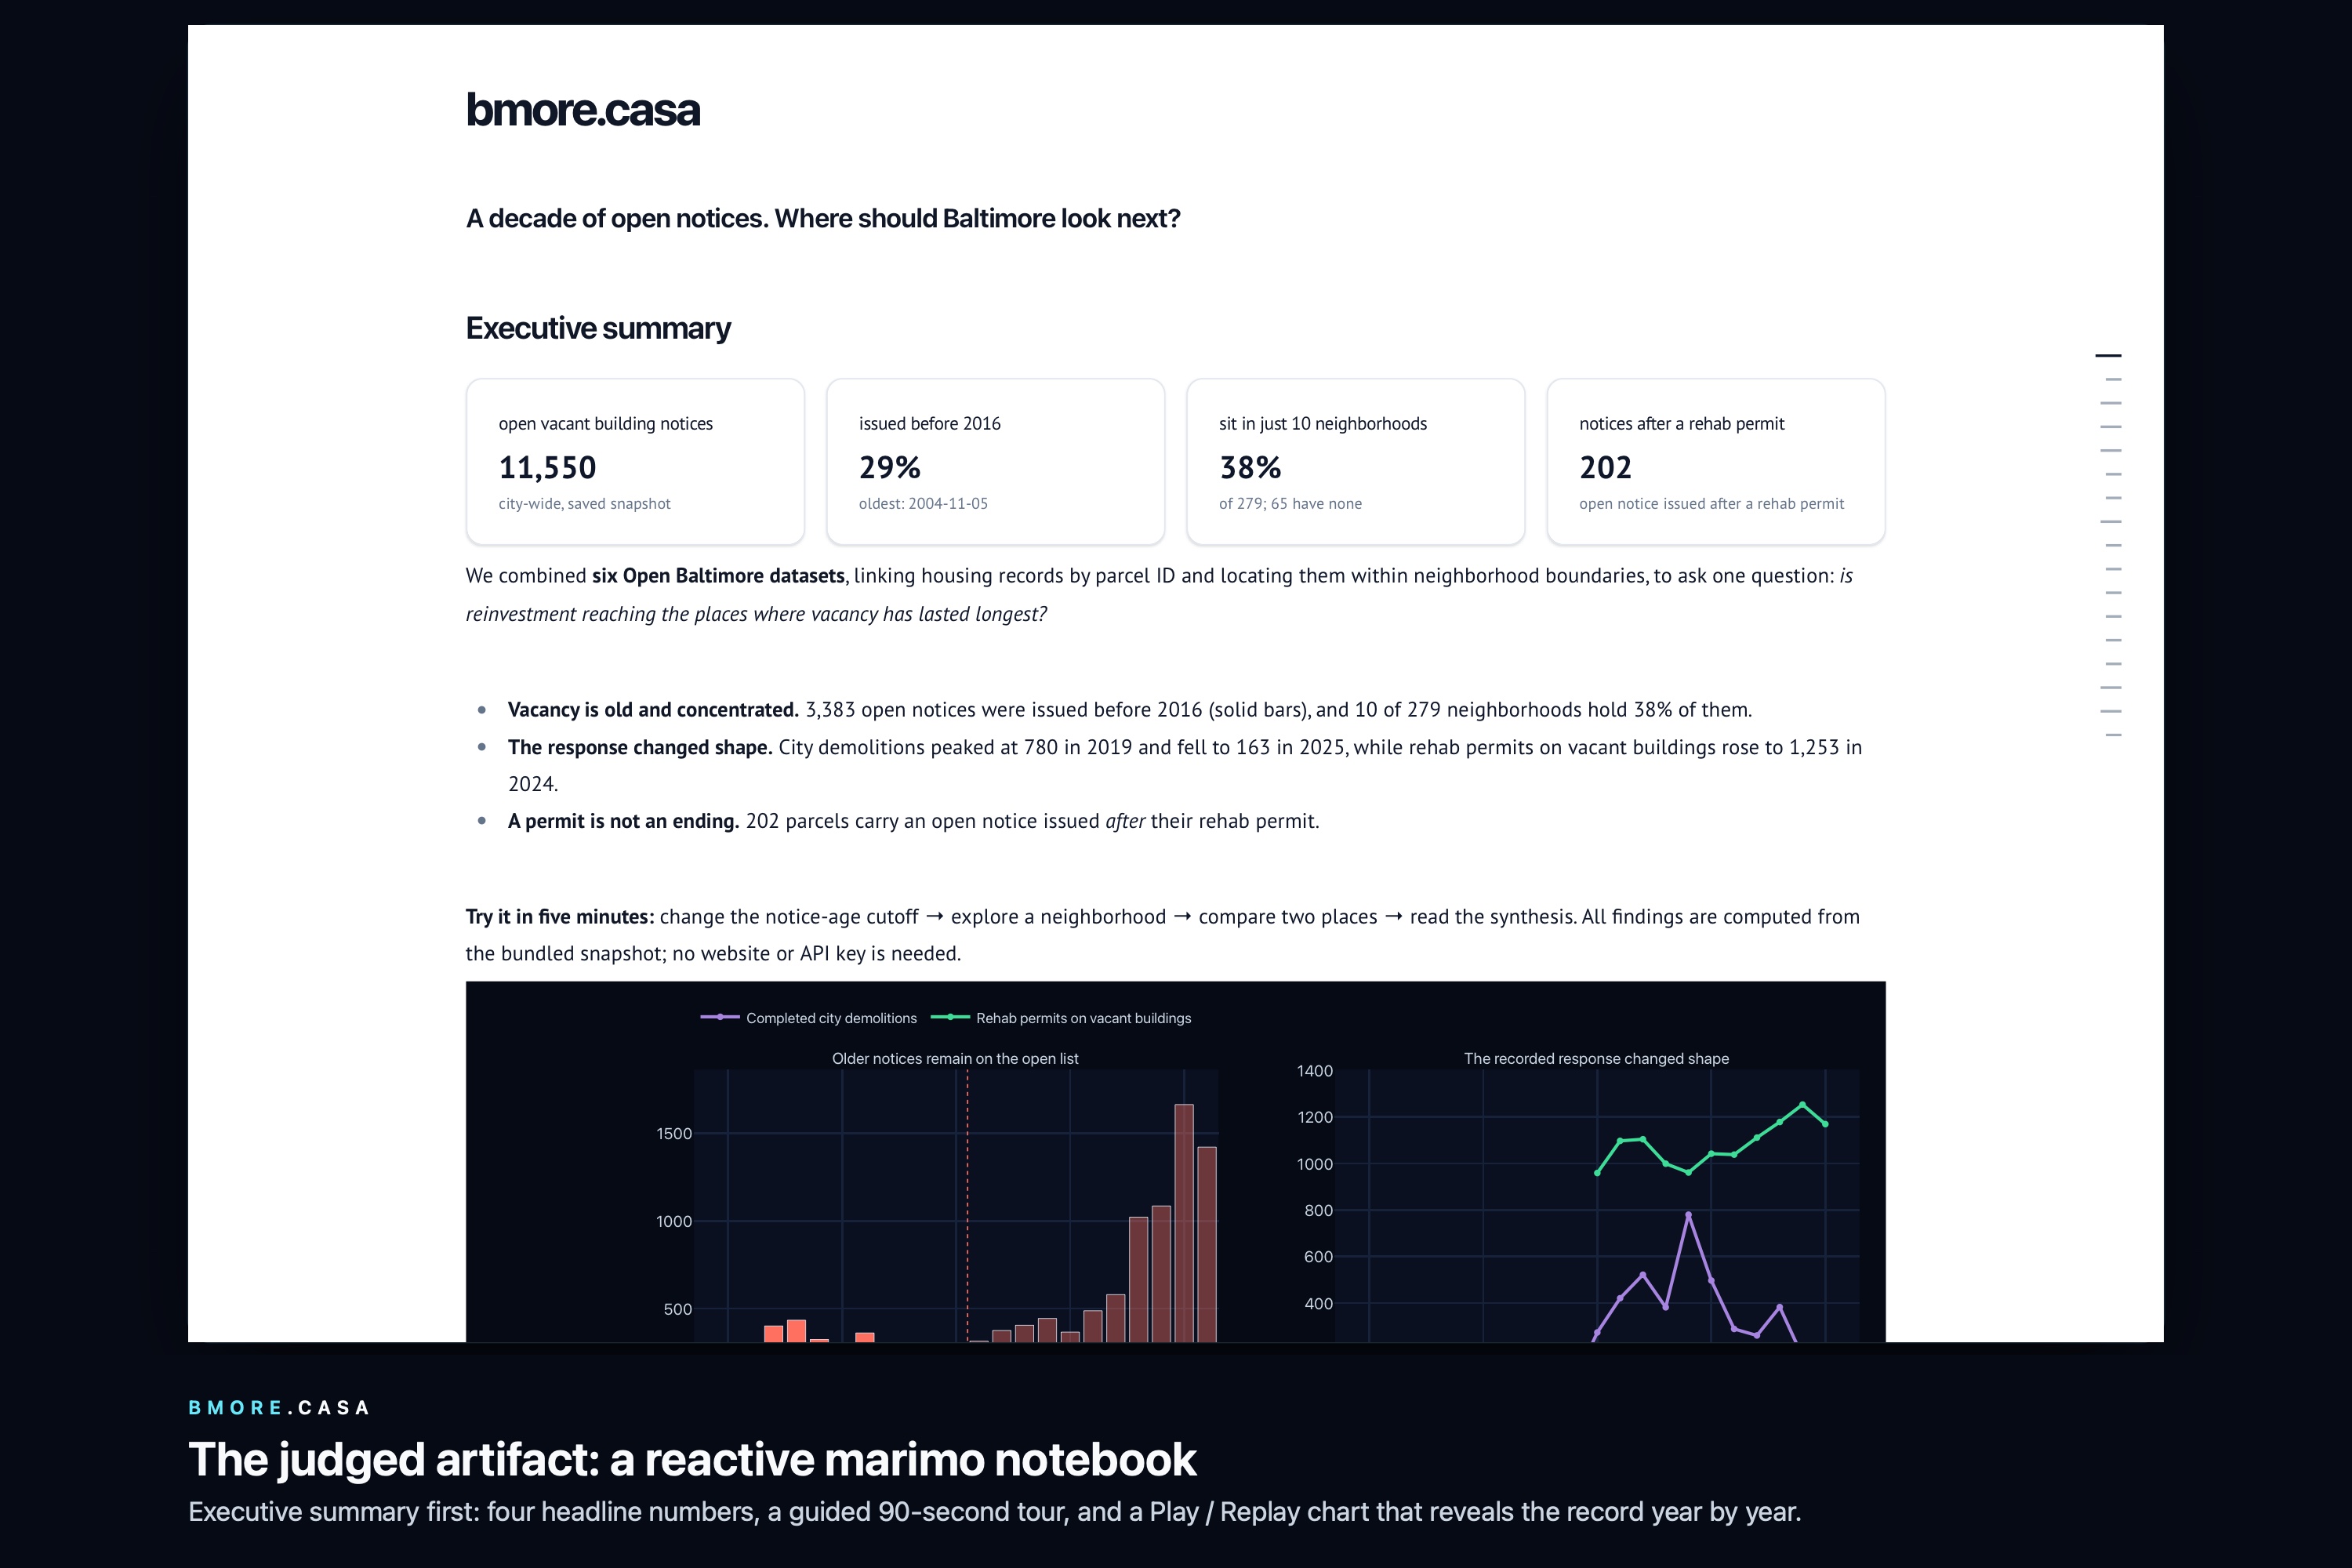
Executive summary, headline numbers and the Play/Replay chart
-
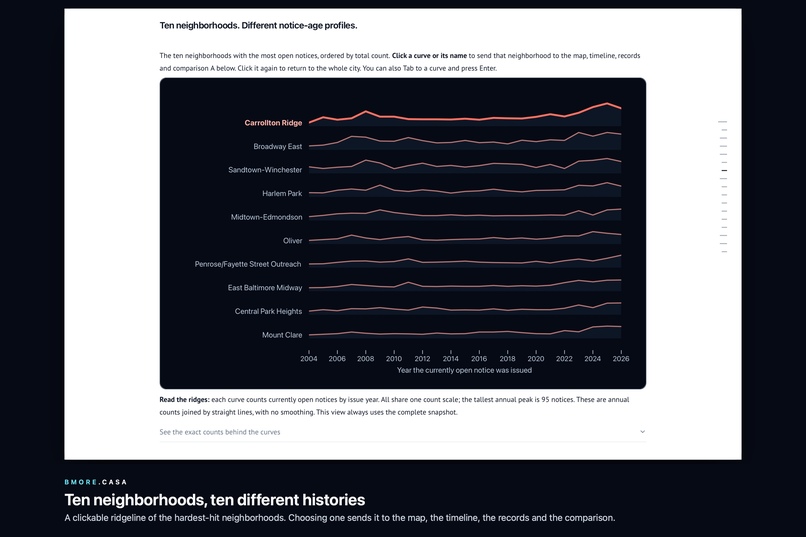
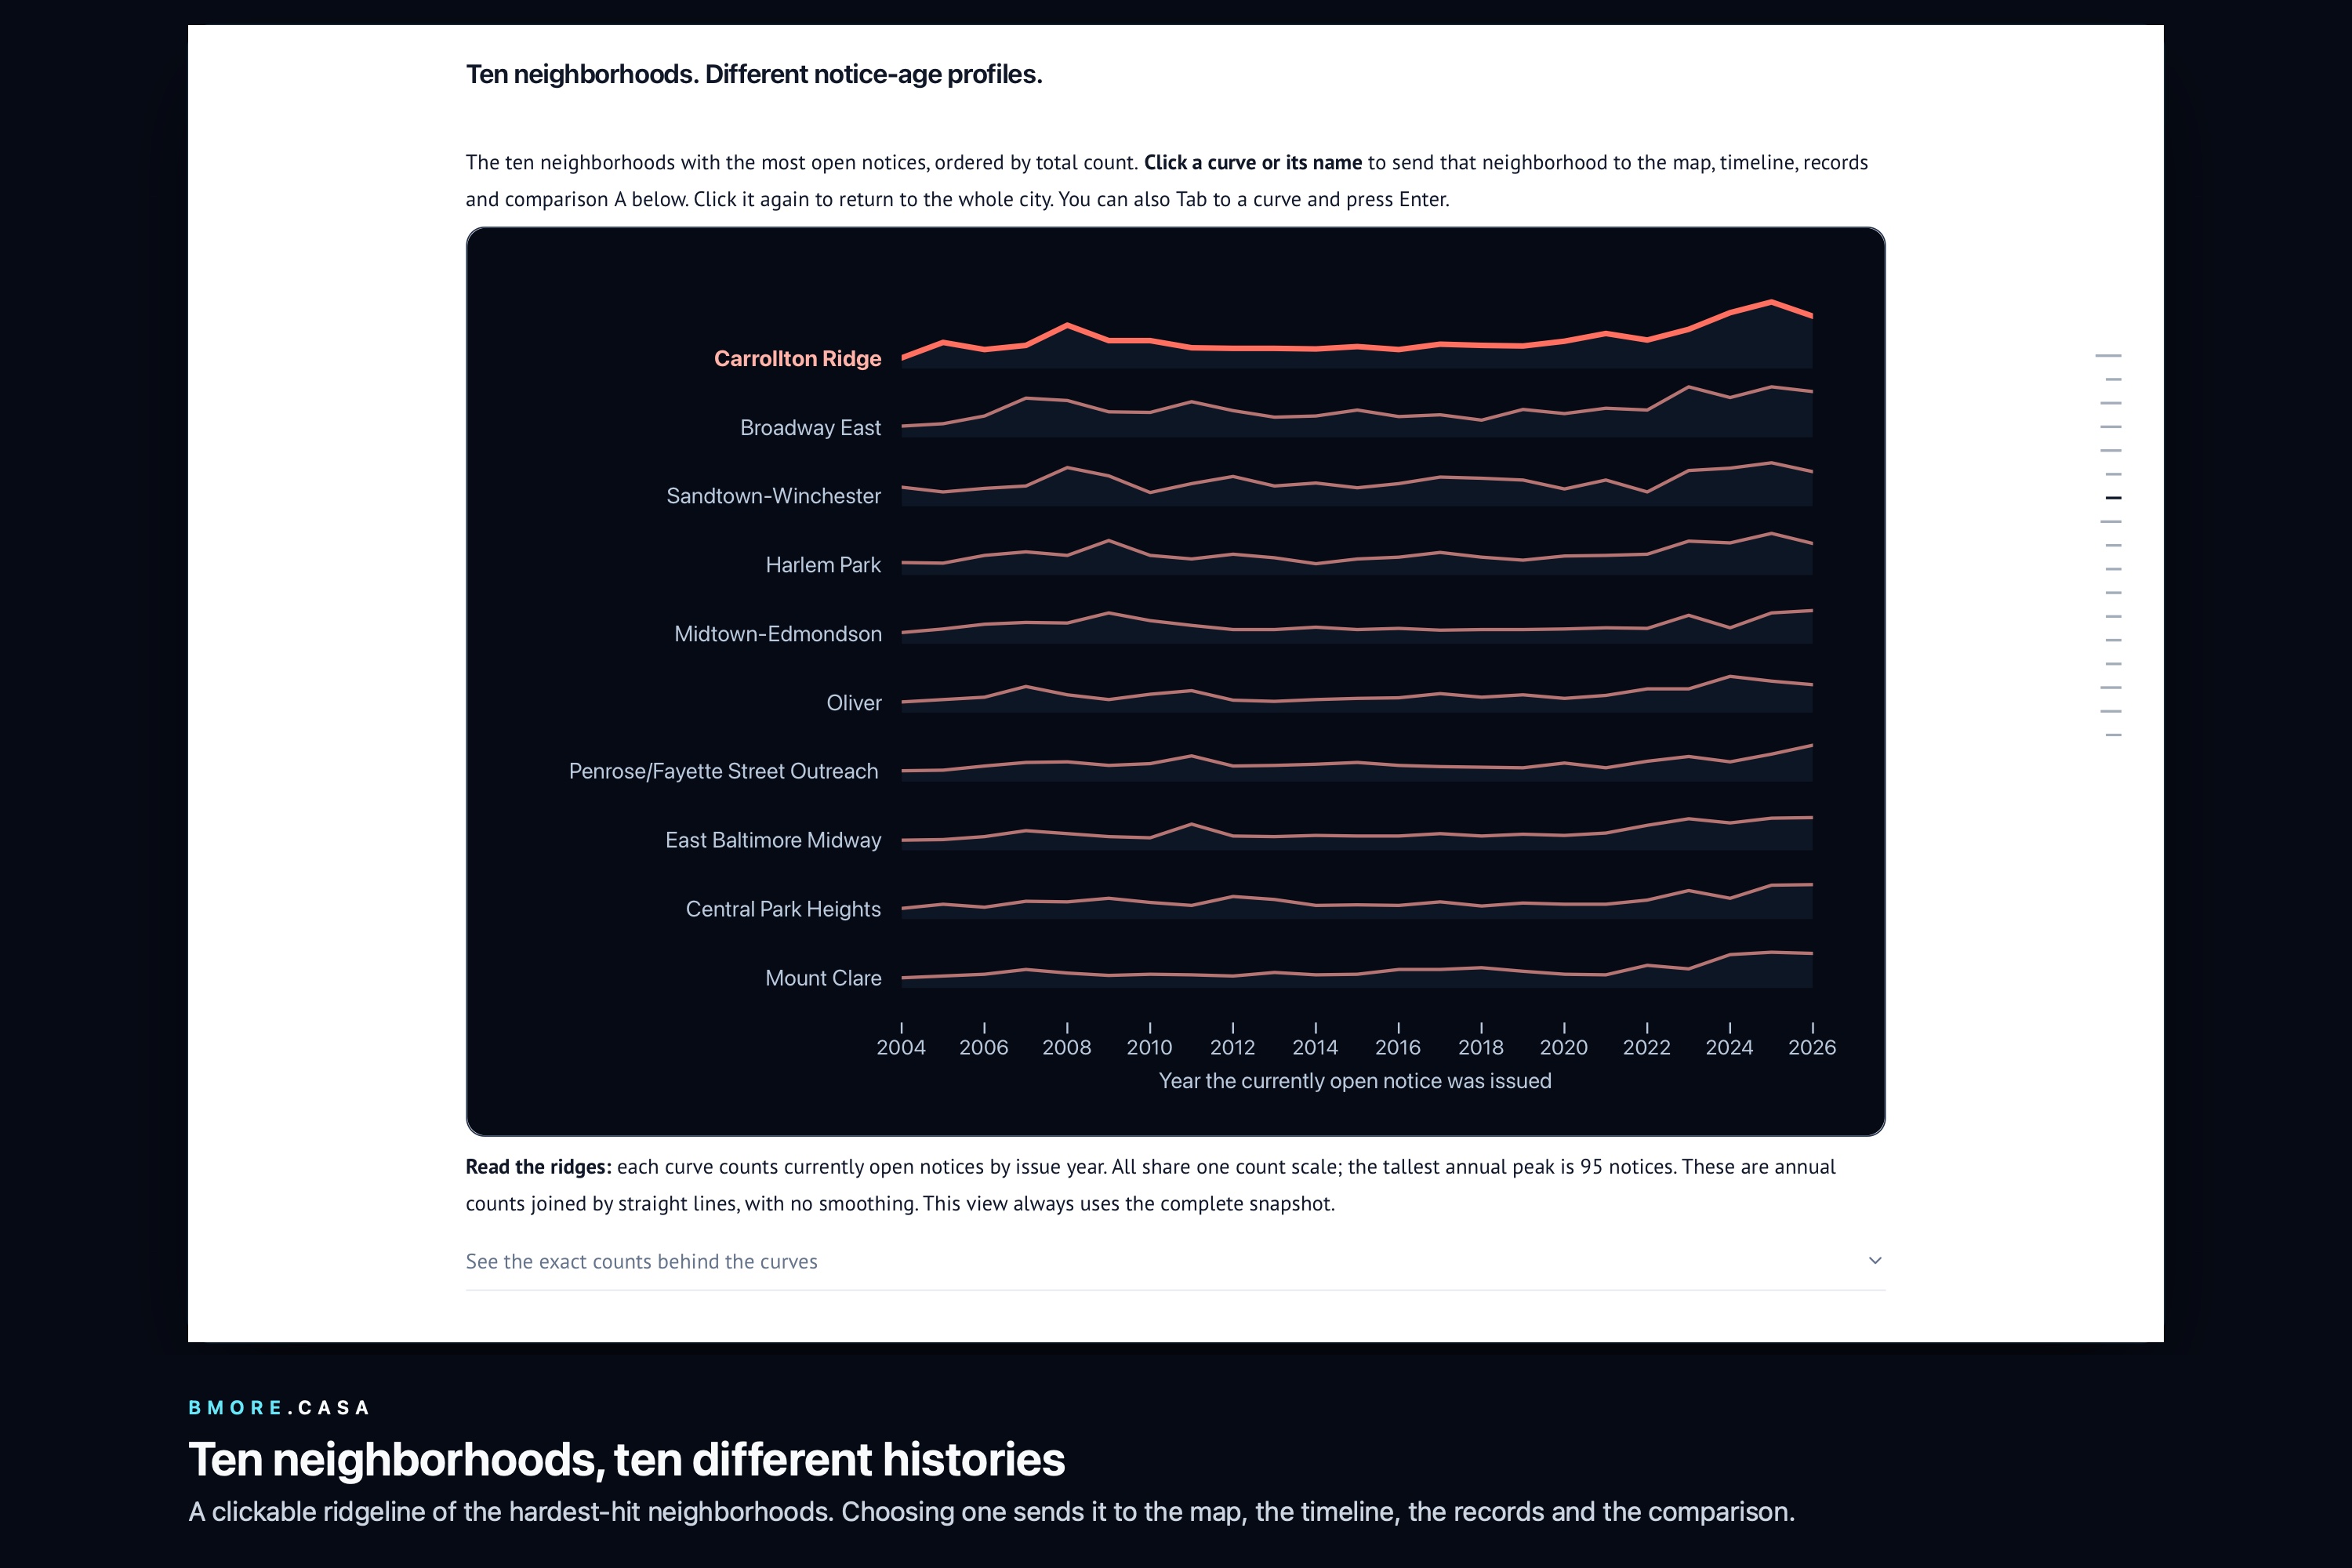
Ten-neighborhood ridgeline with Carrollton Ridge selected
-
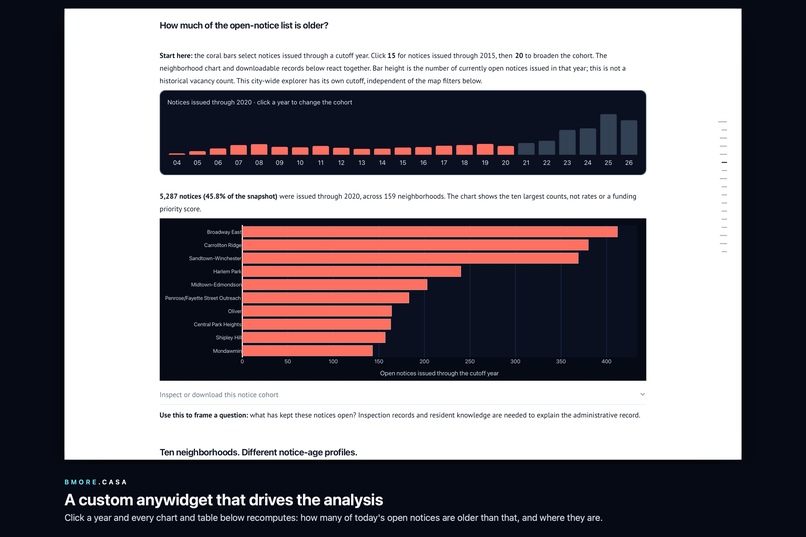
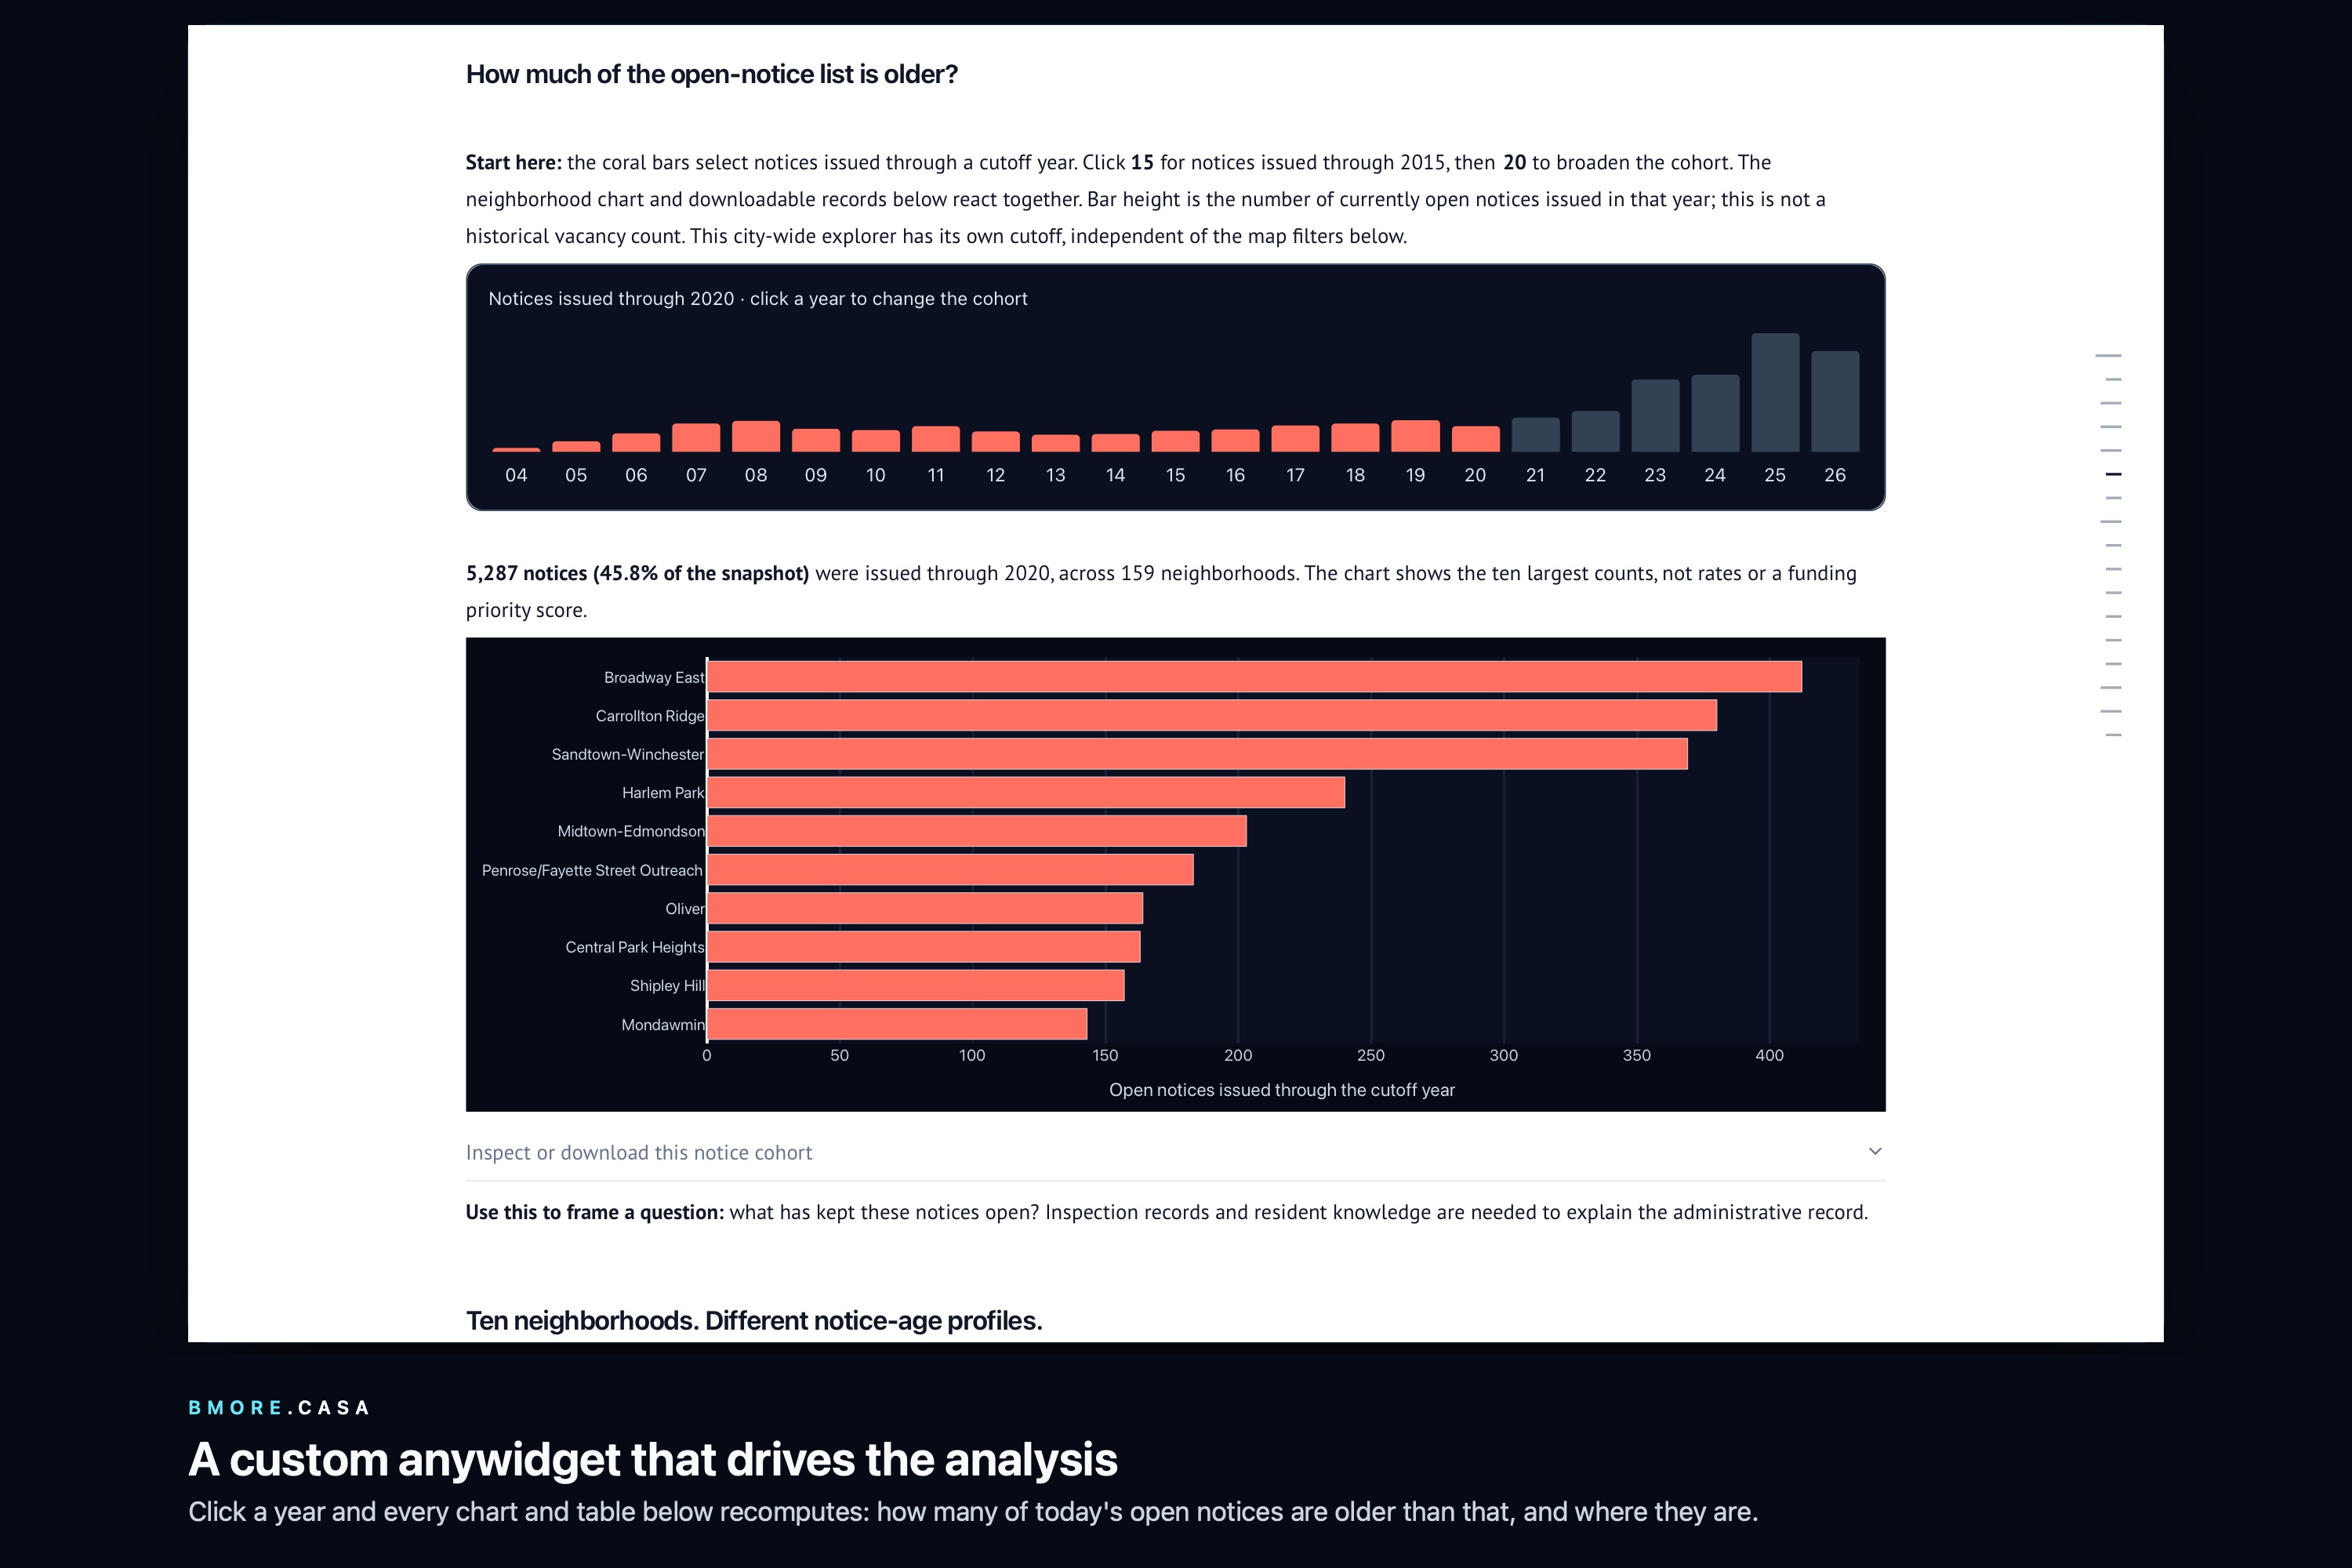
The cohort anywidget set to 2020, with the neighborhood bars reacting
-
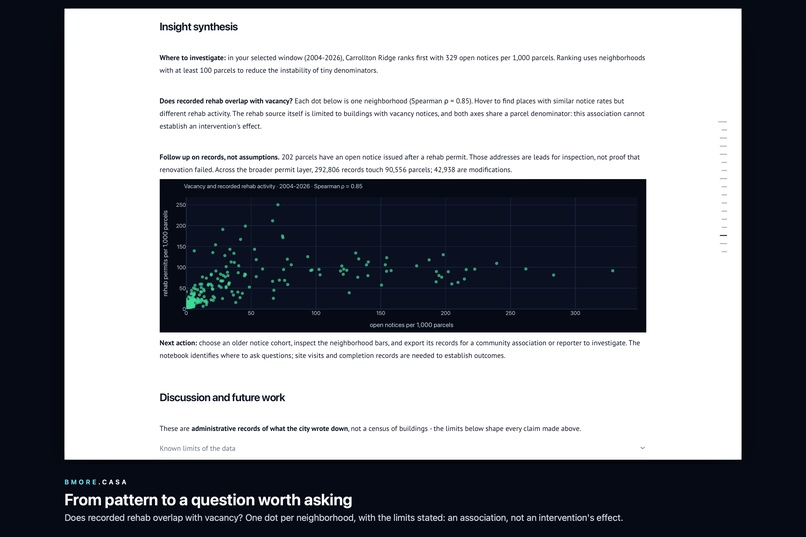
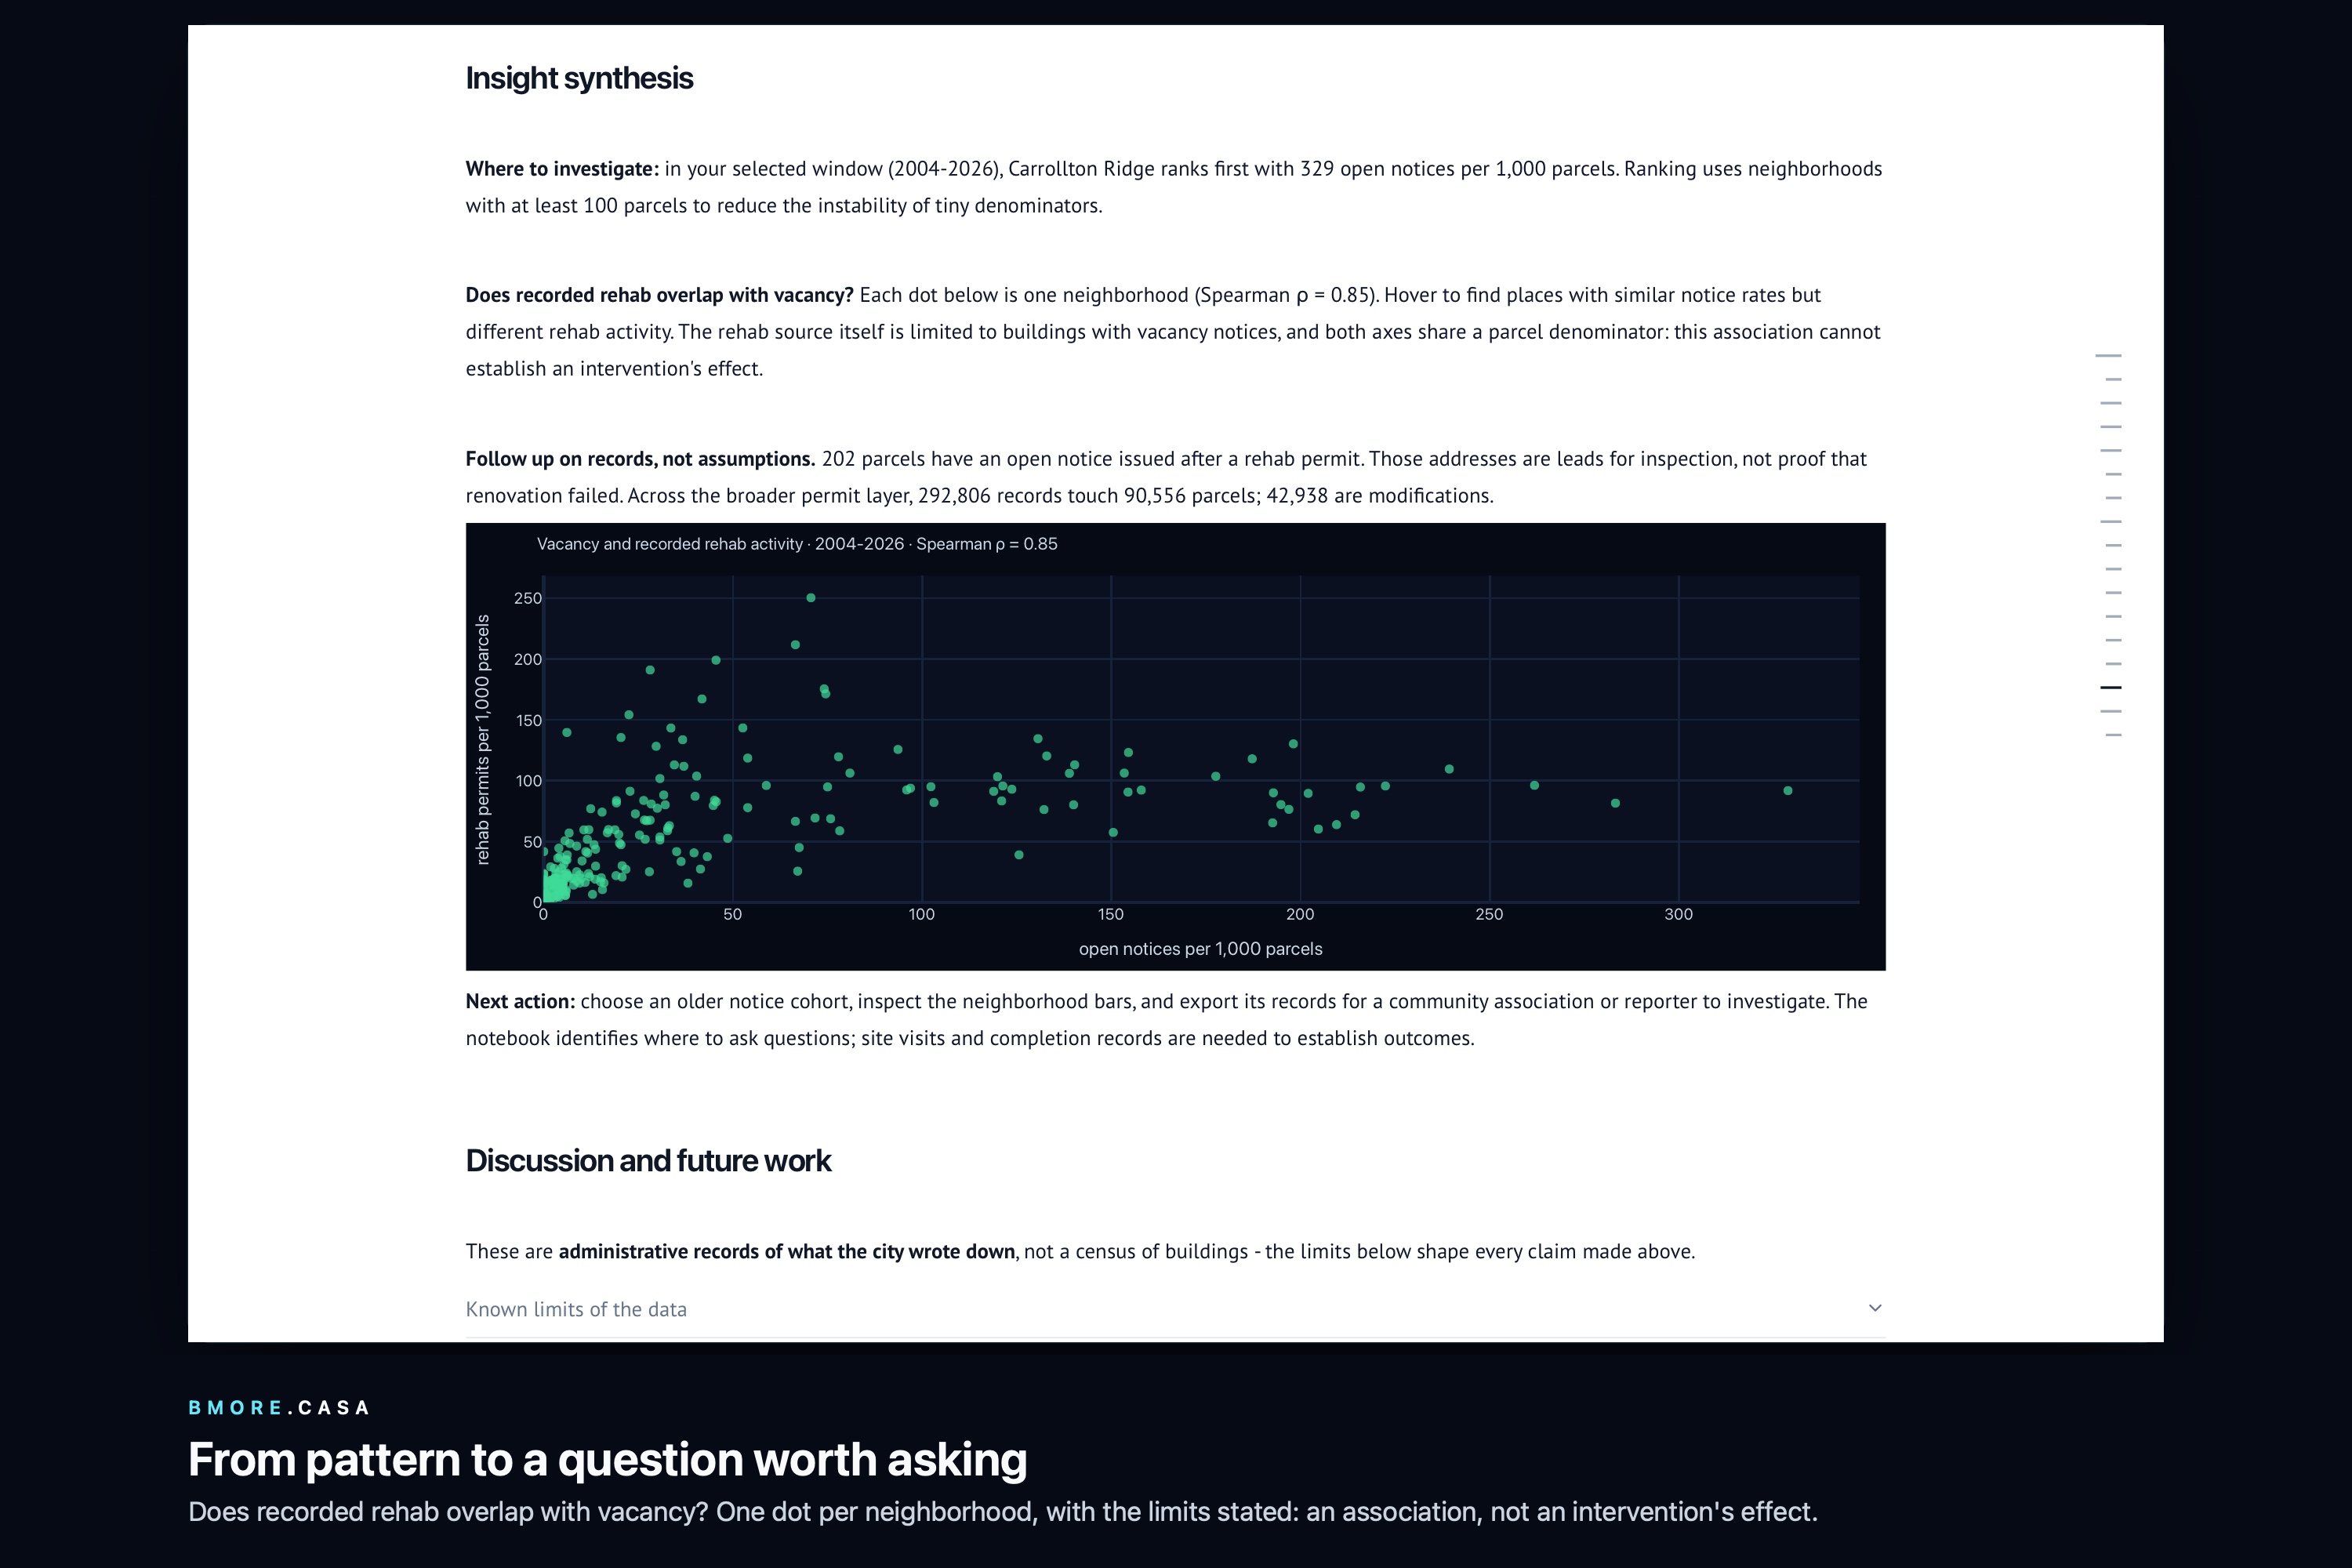
The vacancy vs rehab scatter with its limits stated
-
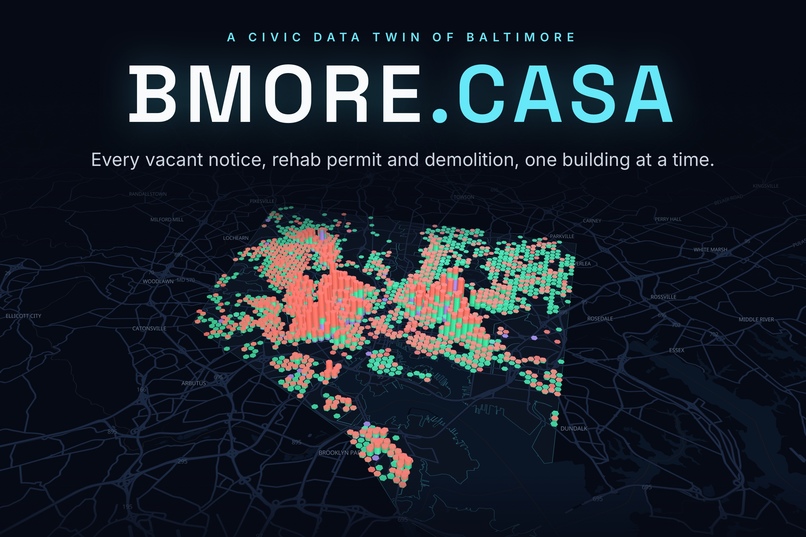
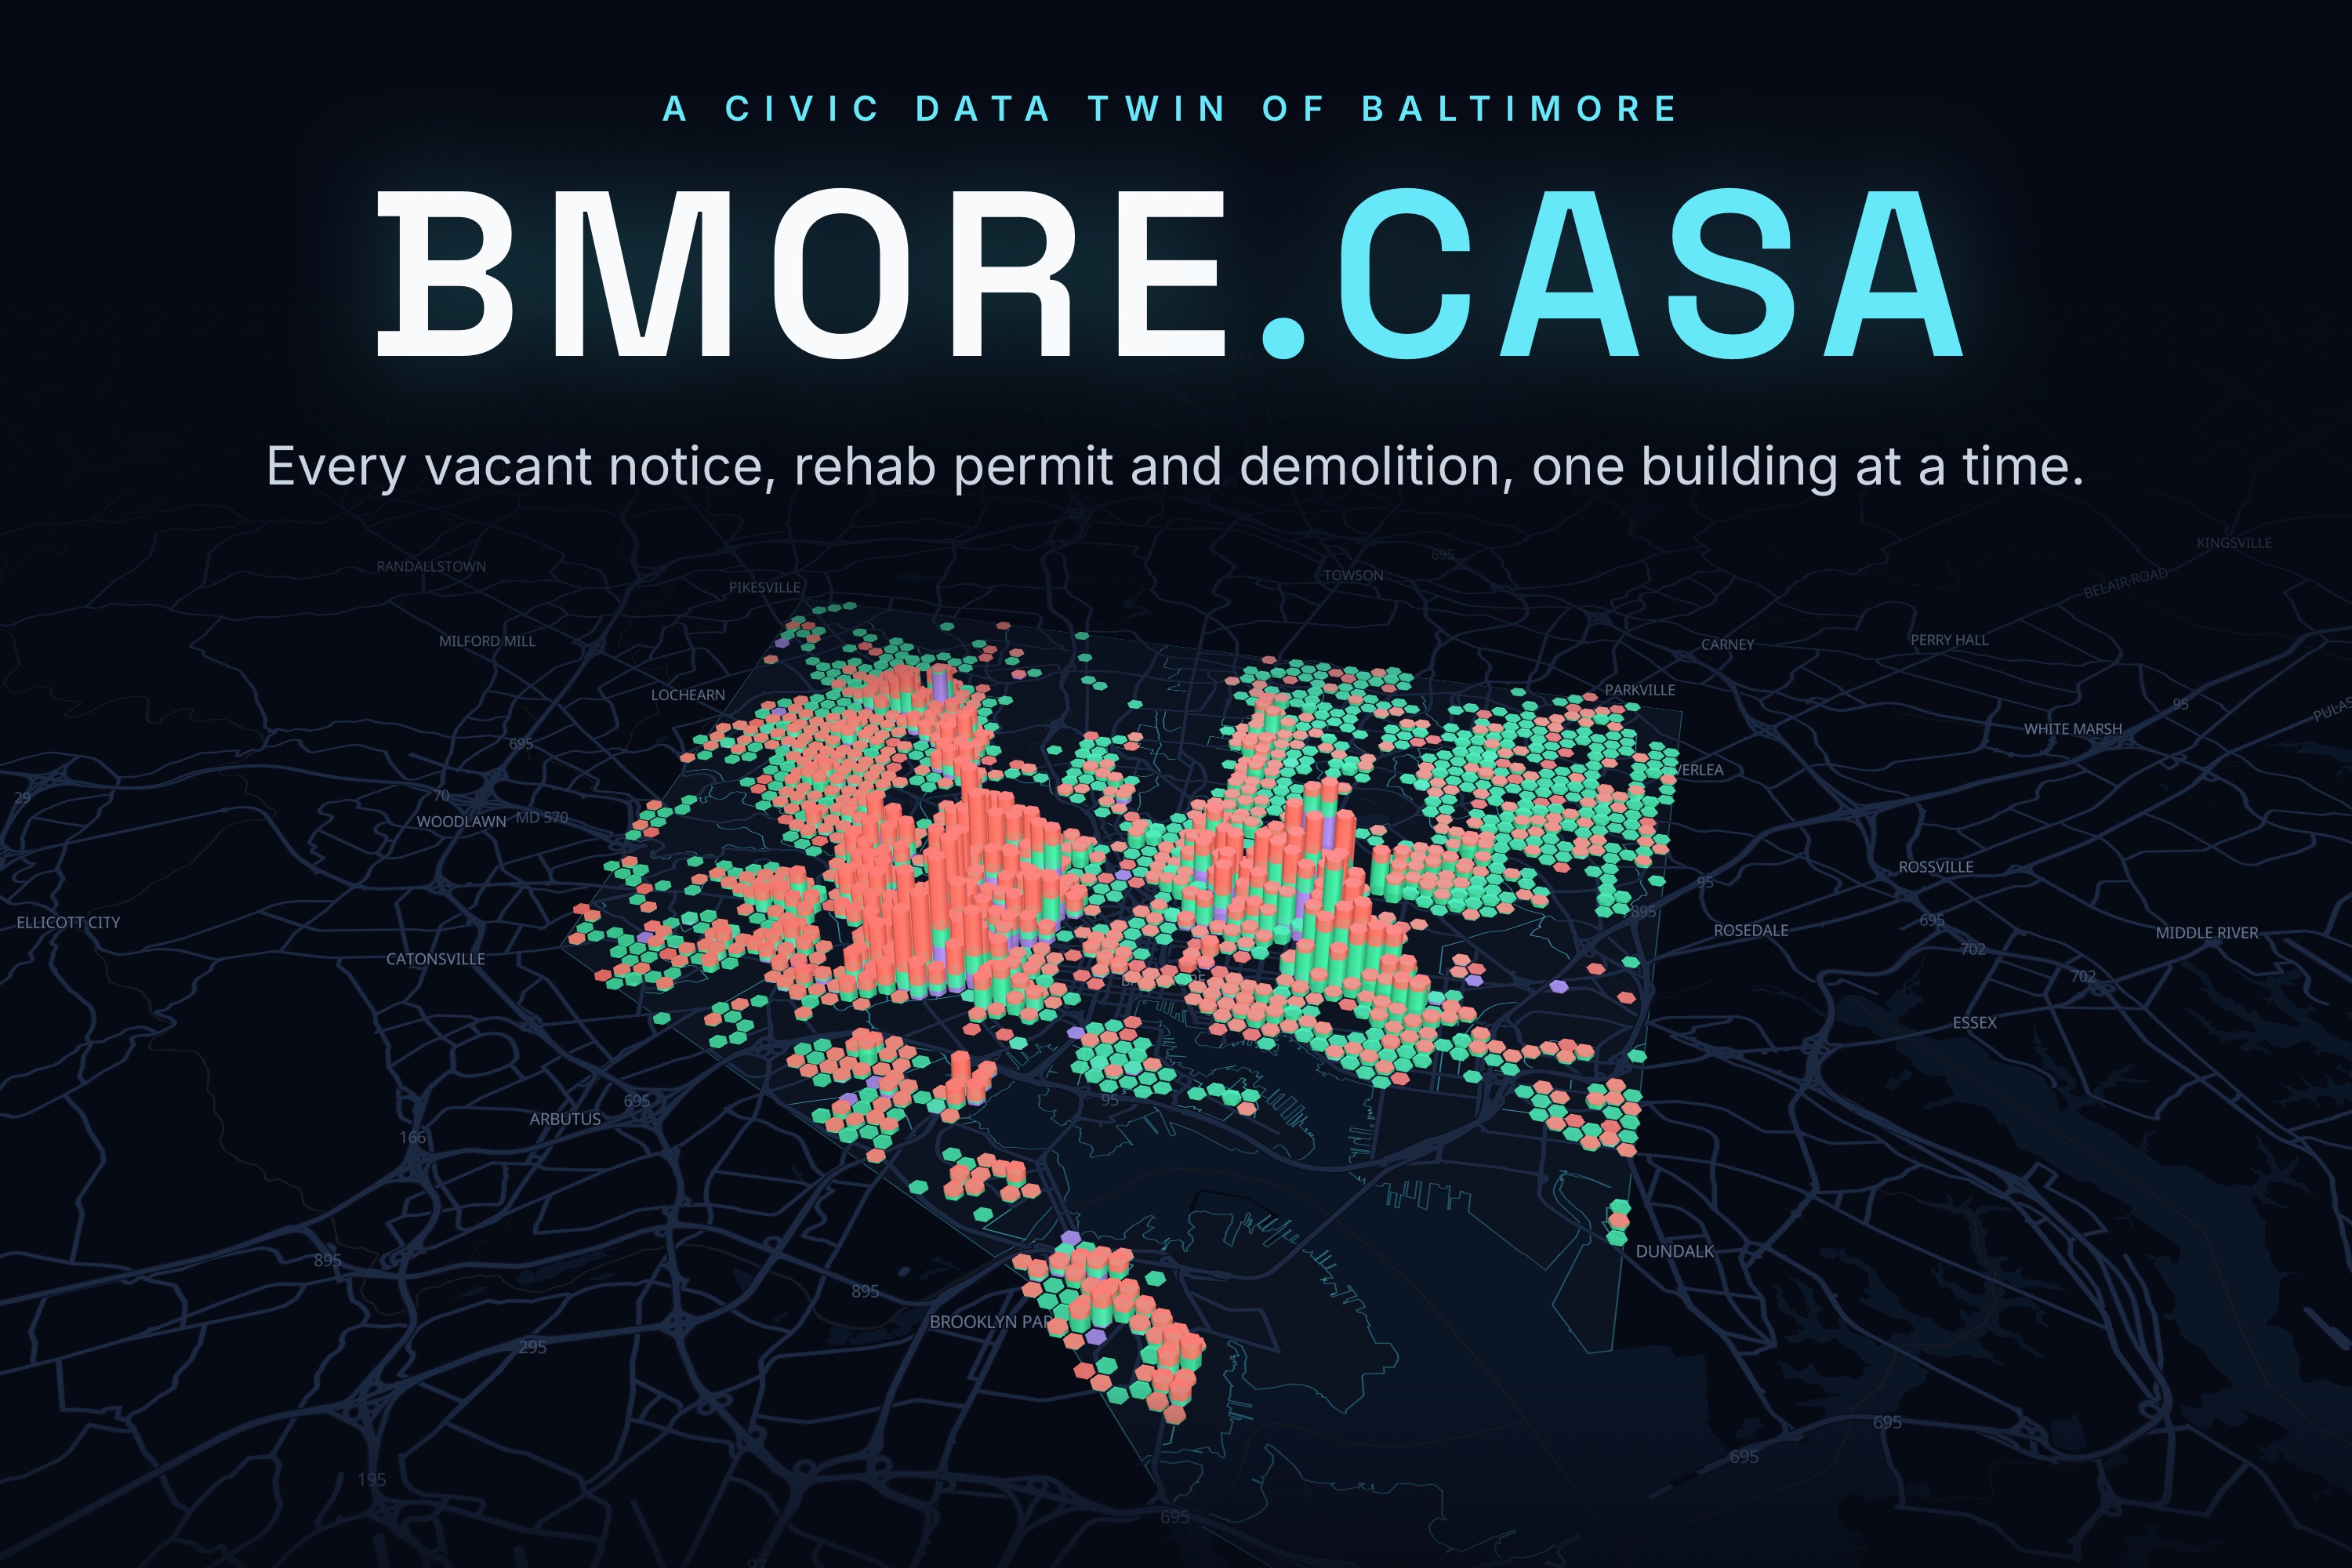
The 3D city with the BMORE.CASA
-
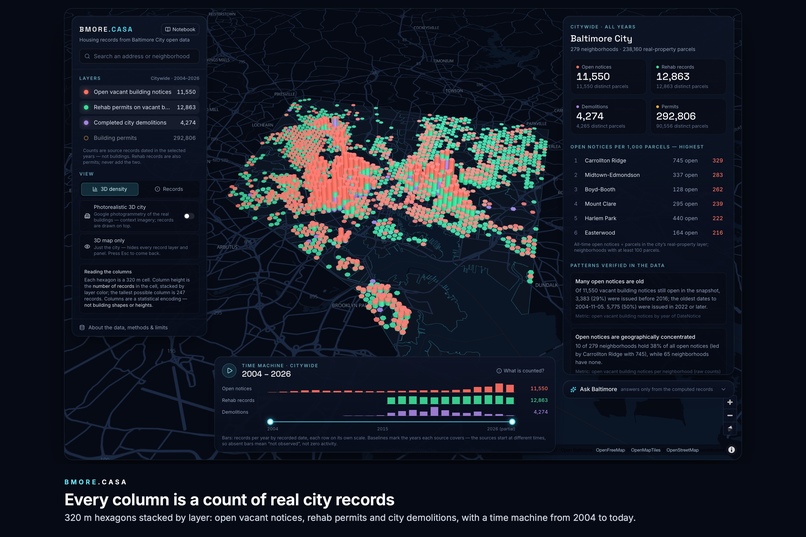
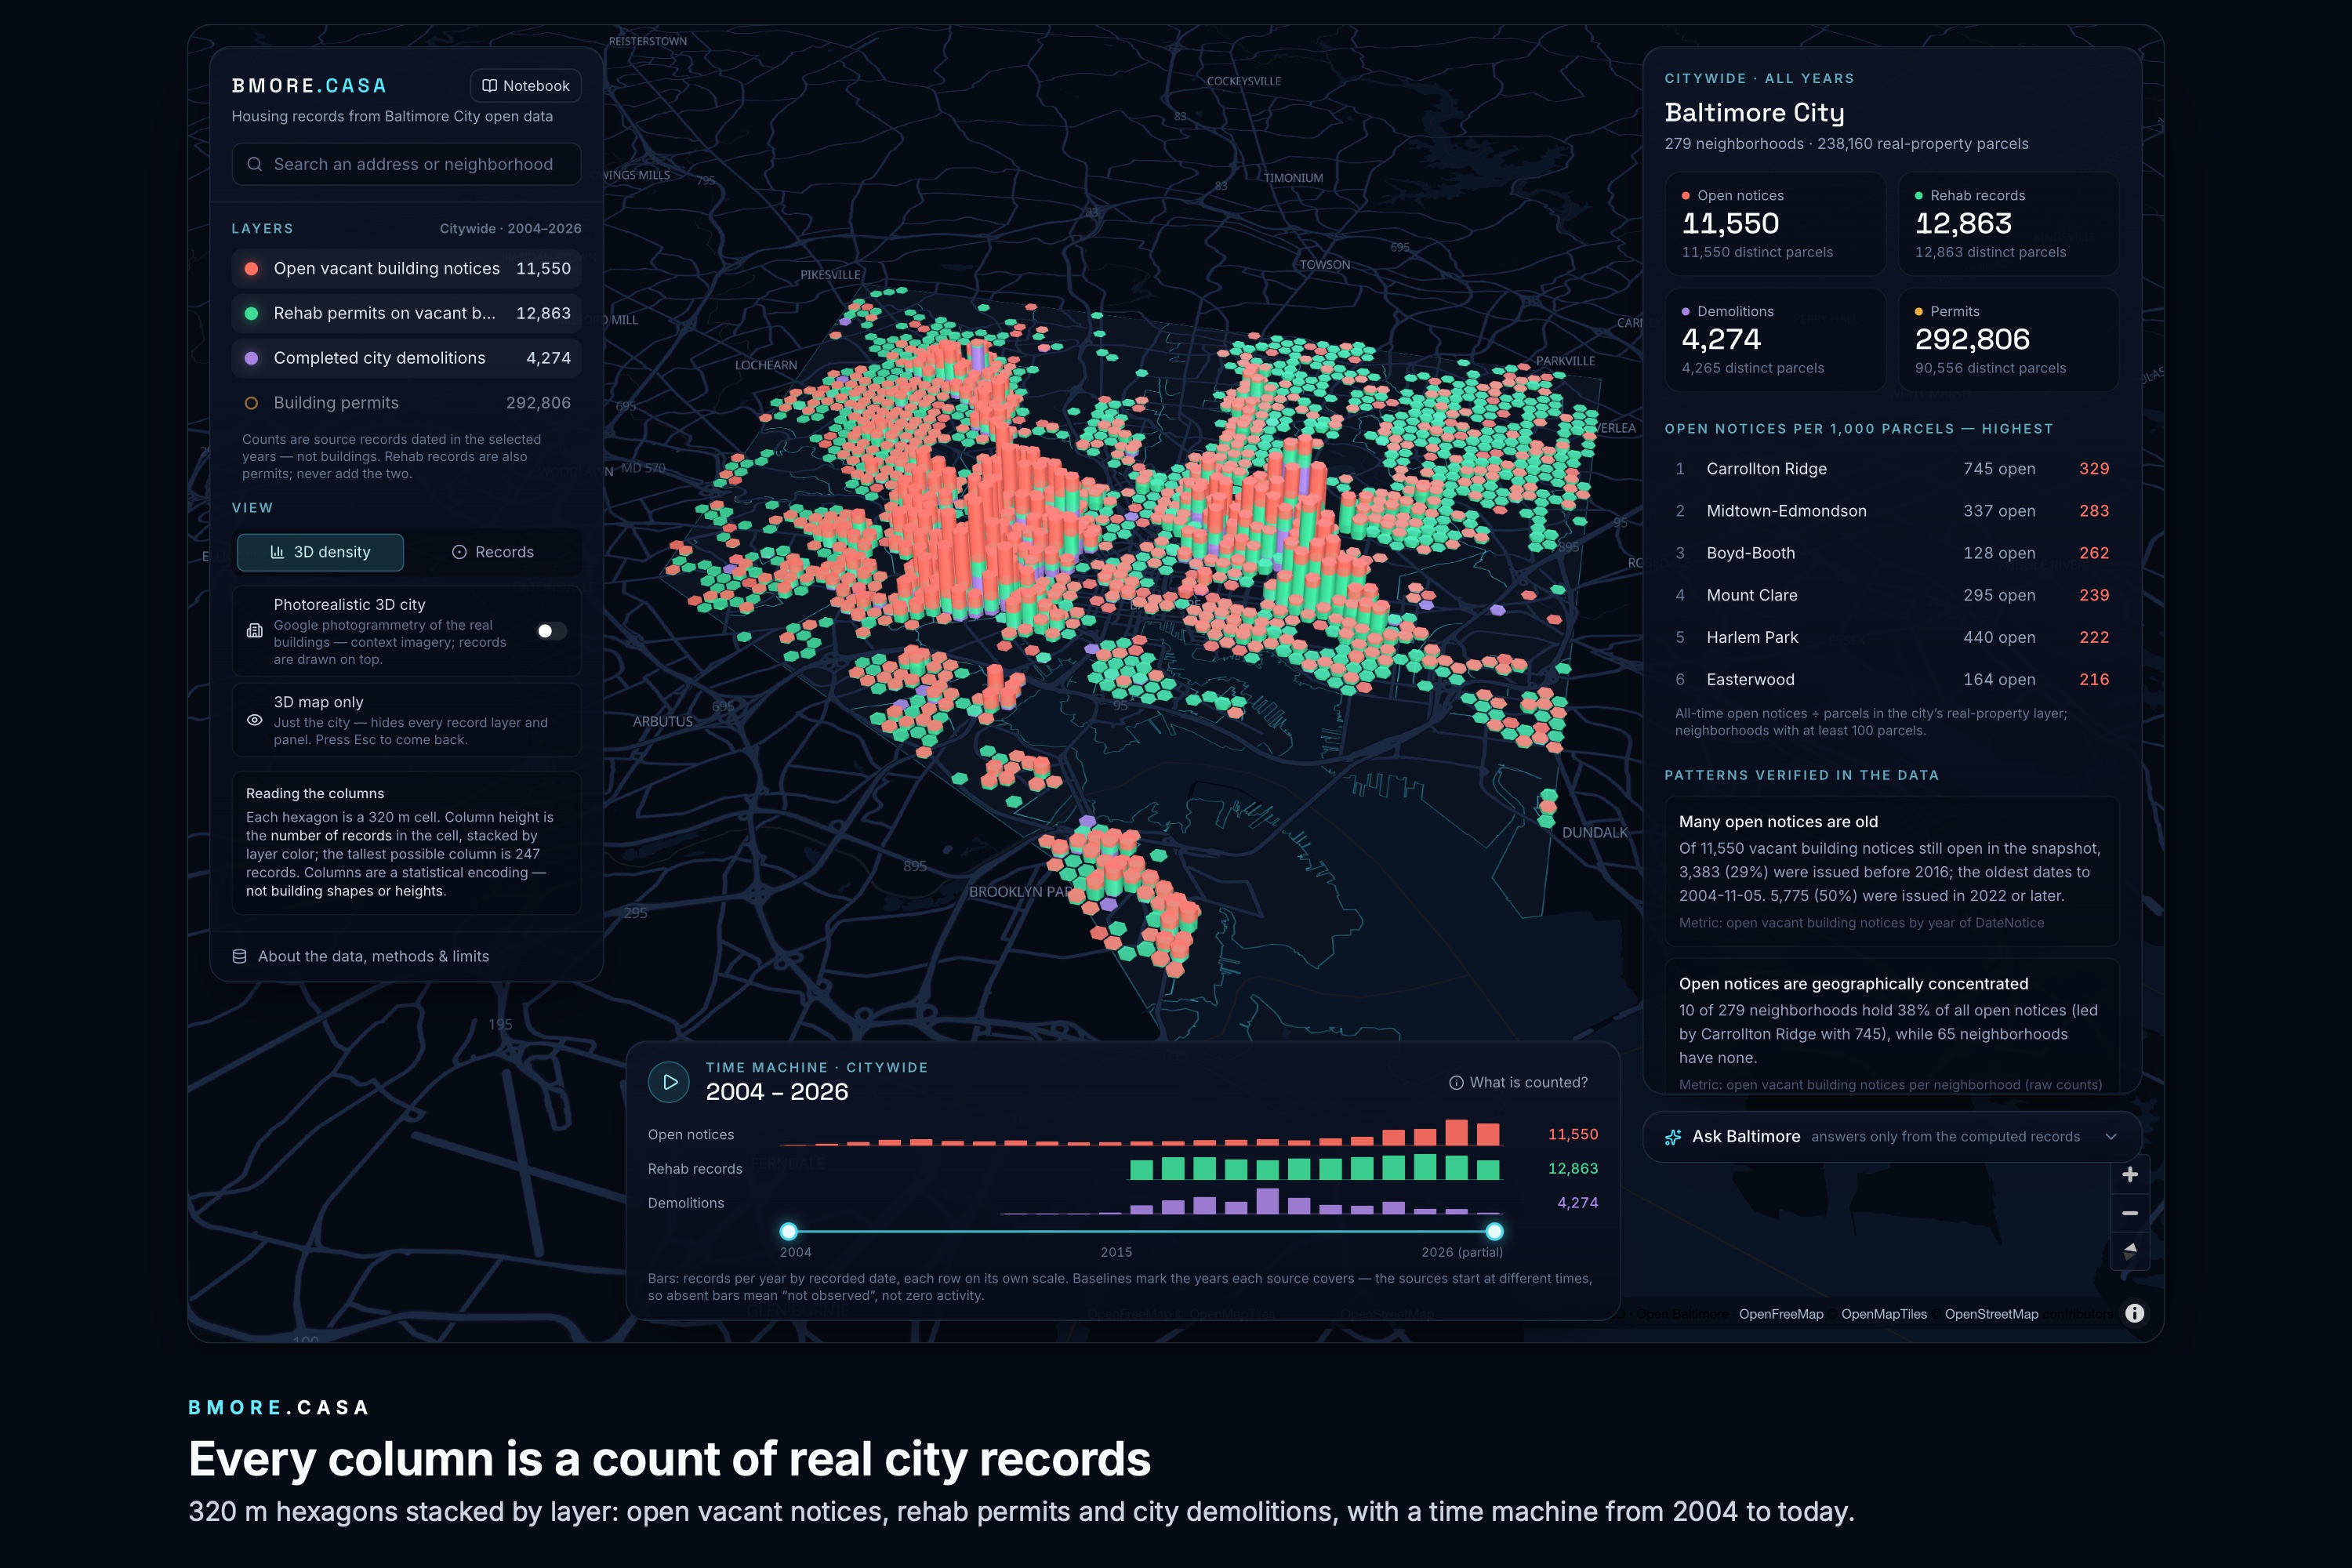
The full explorer with hex columns, rankings and time machine
-
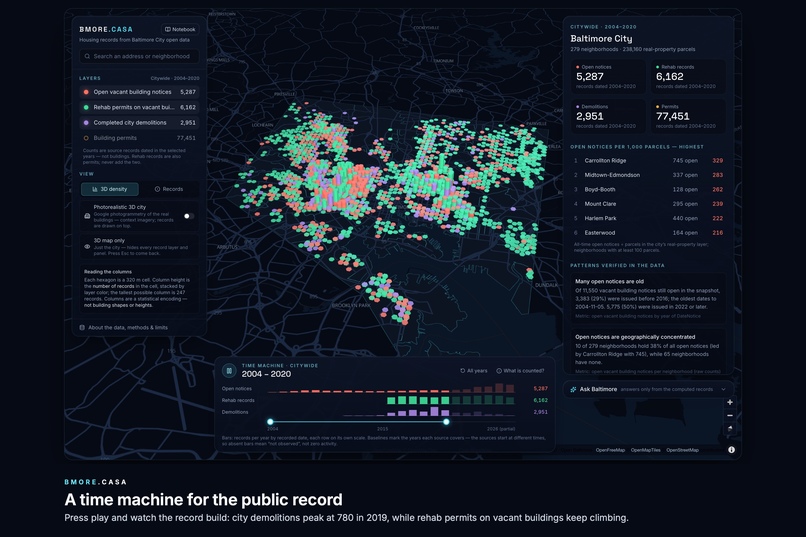
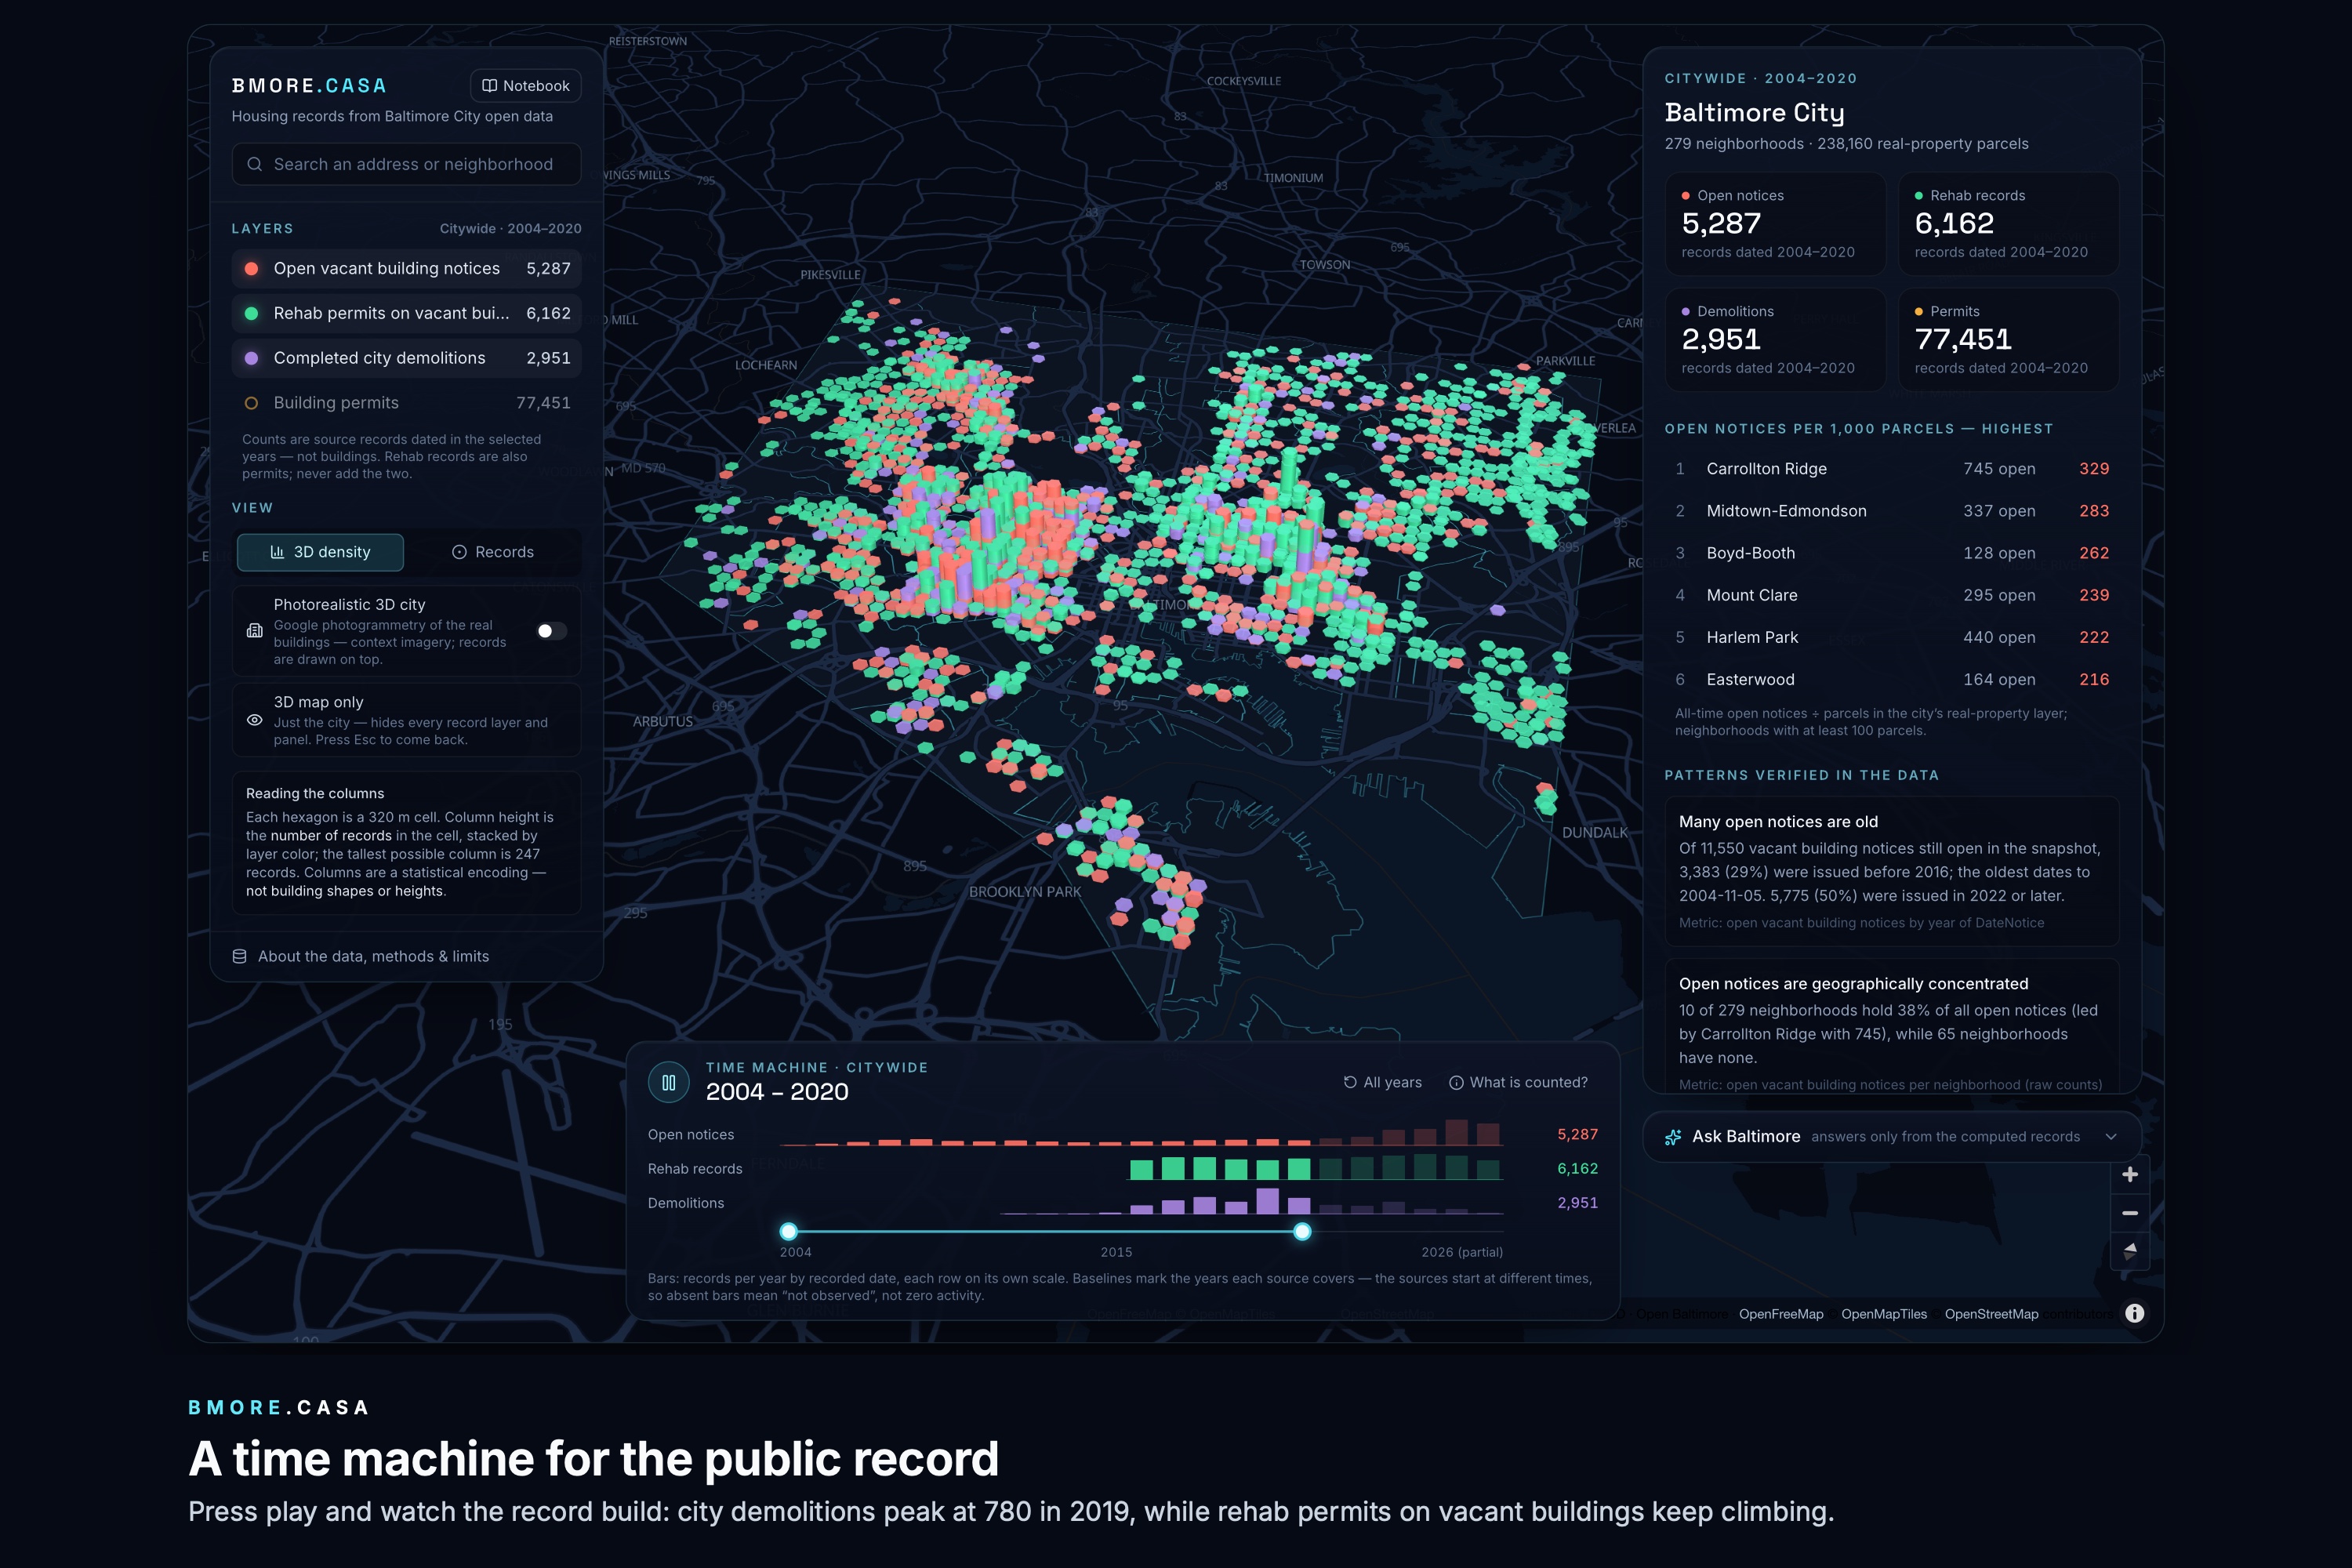
Timeline mid-play, captured at 2004–2019
-
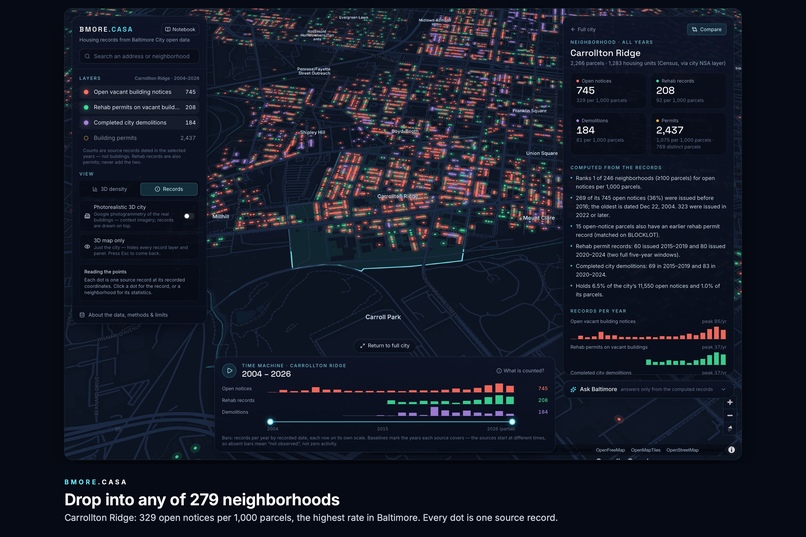
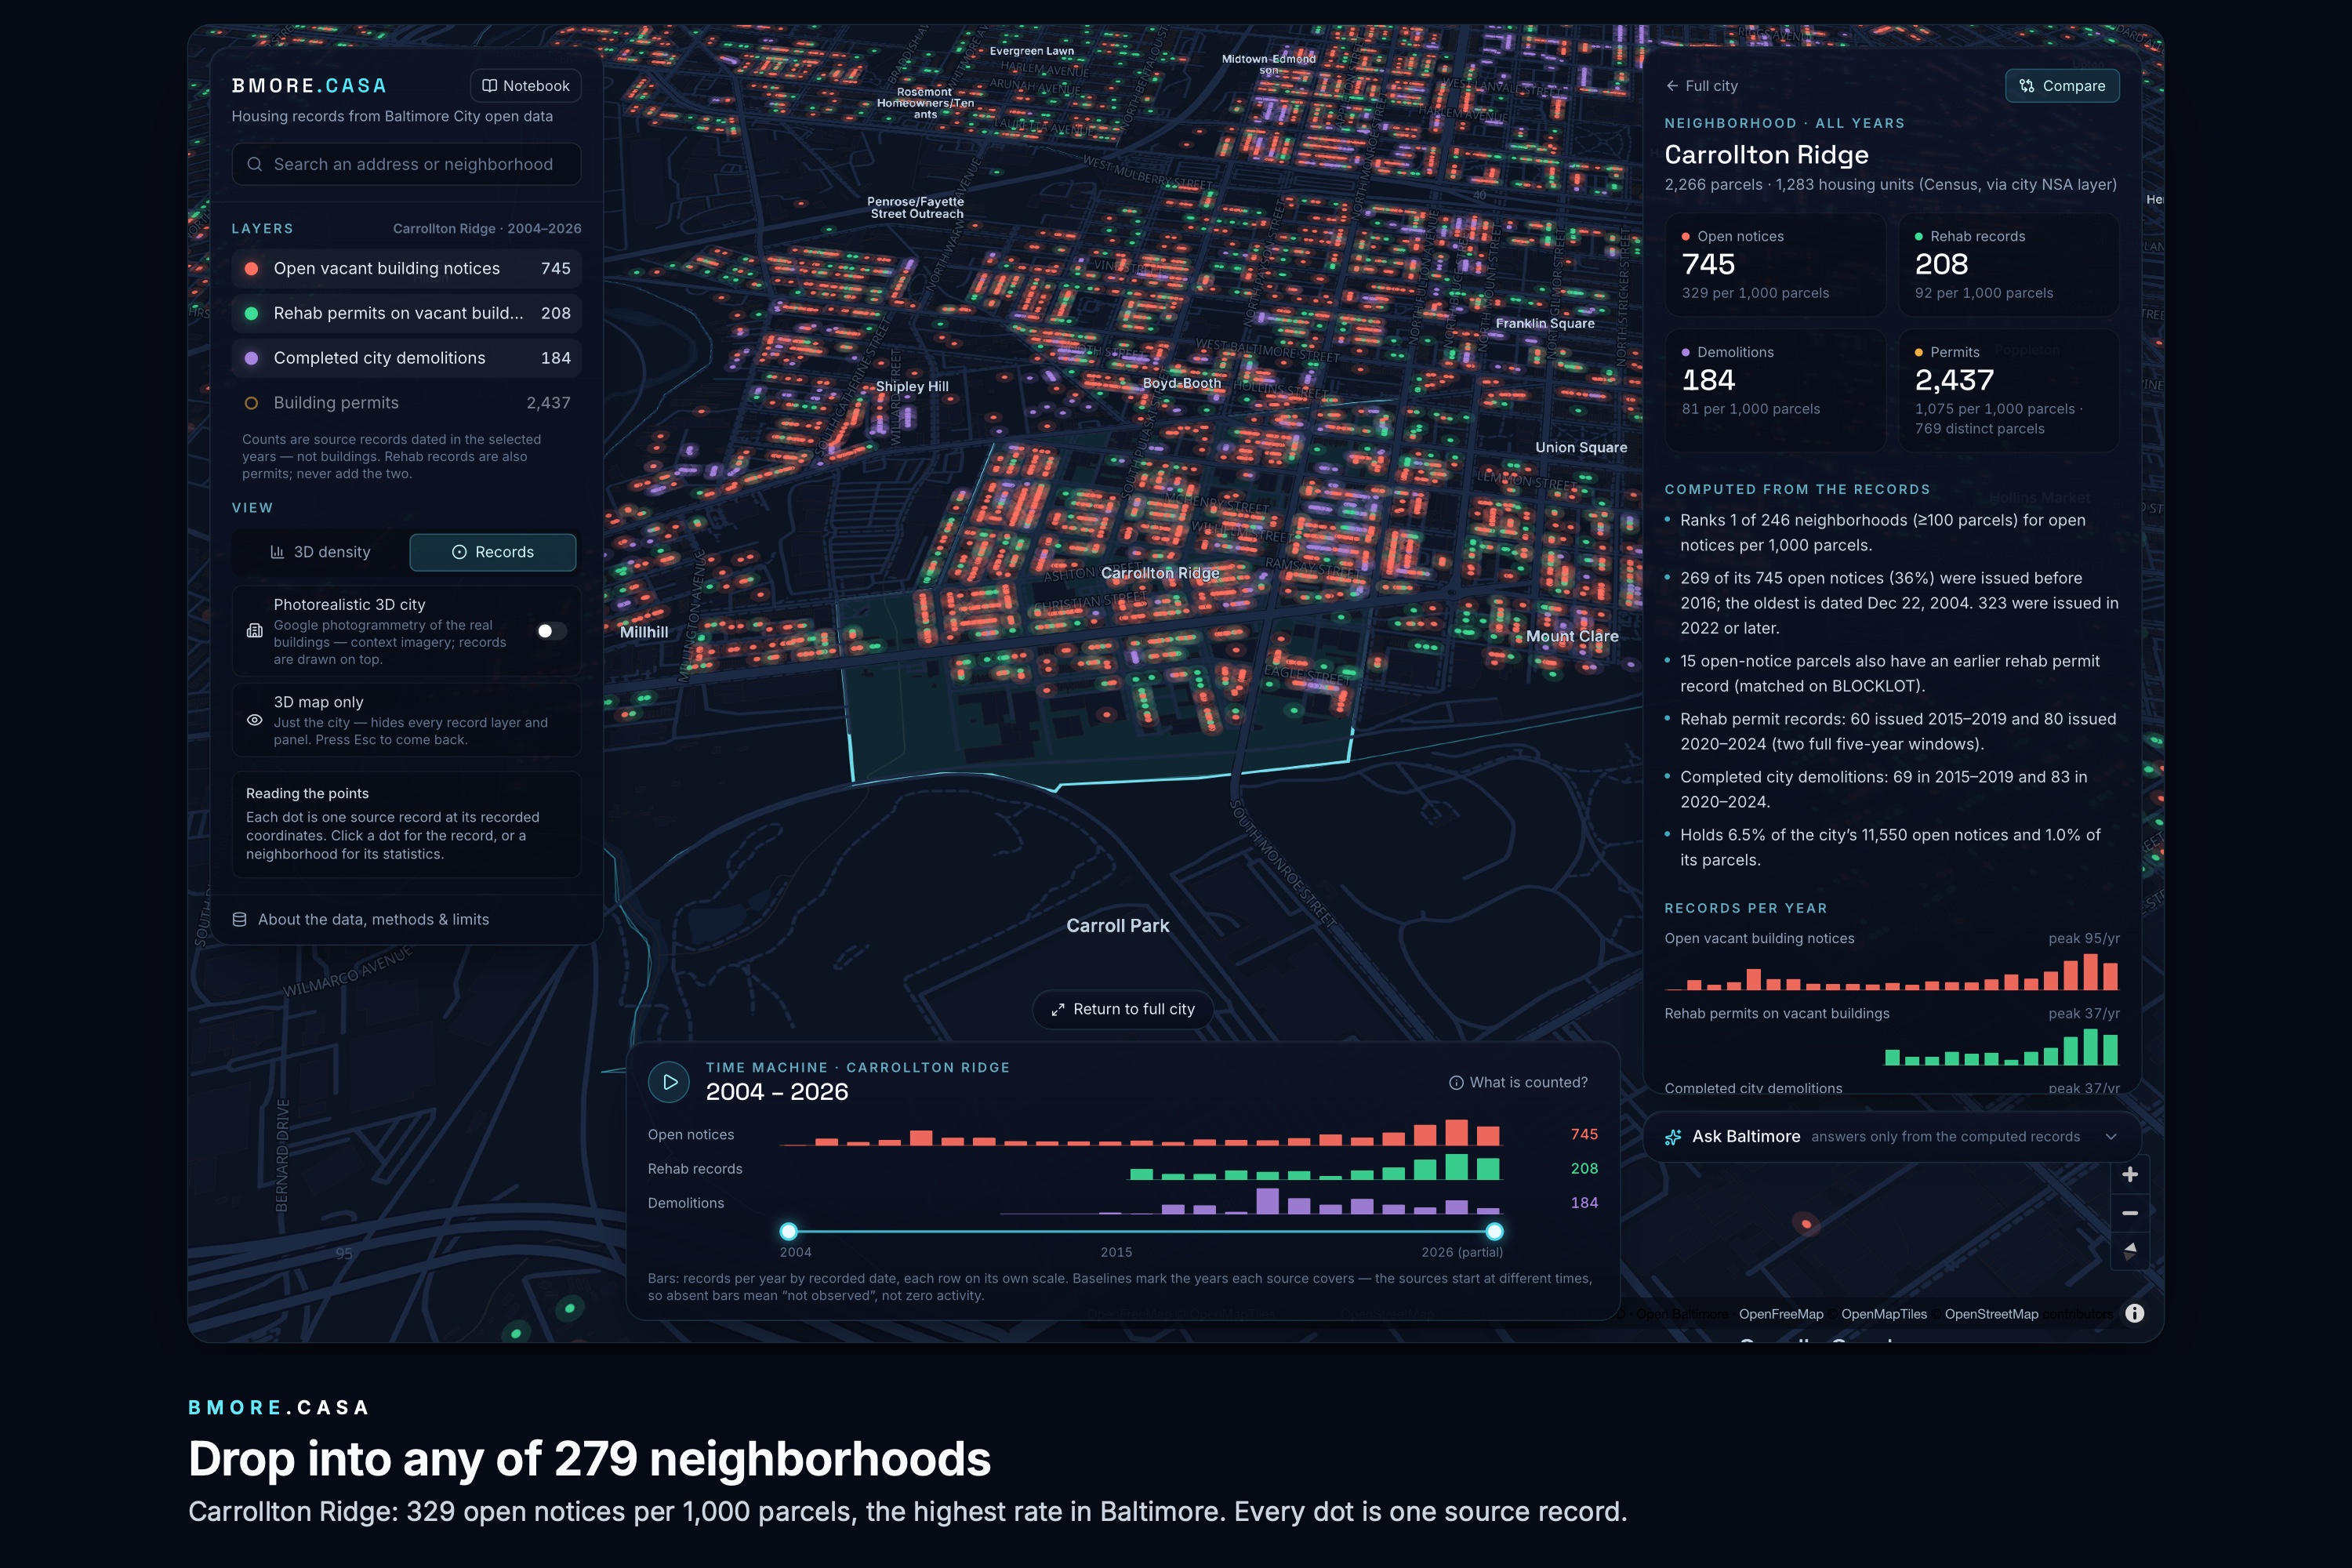
Carrollton Ridge at block level, 329 per 1,000 parcels
-
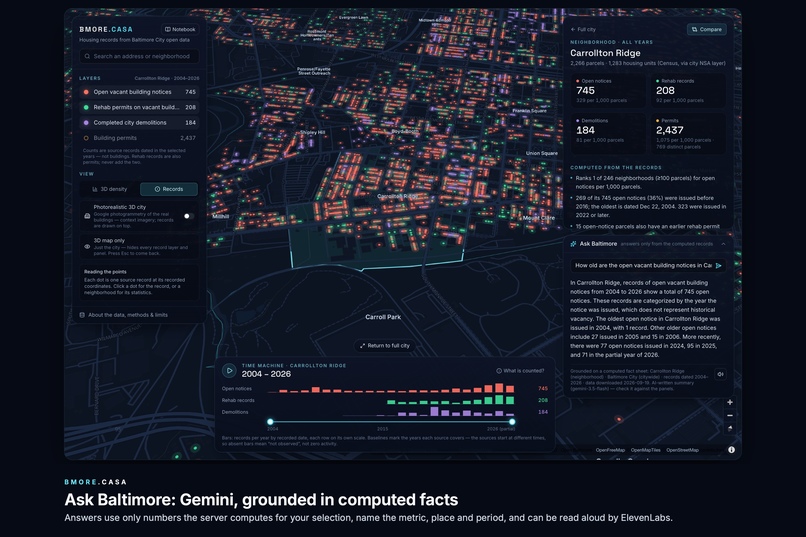
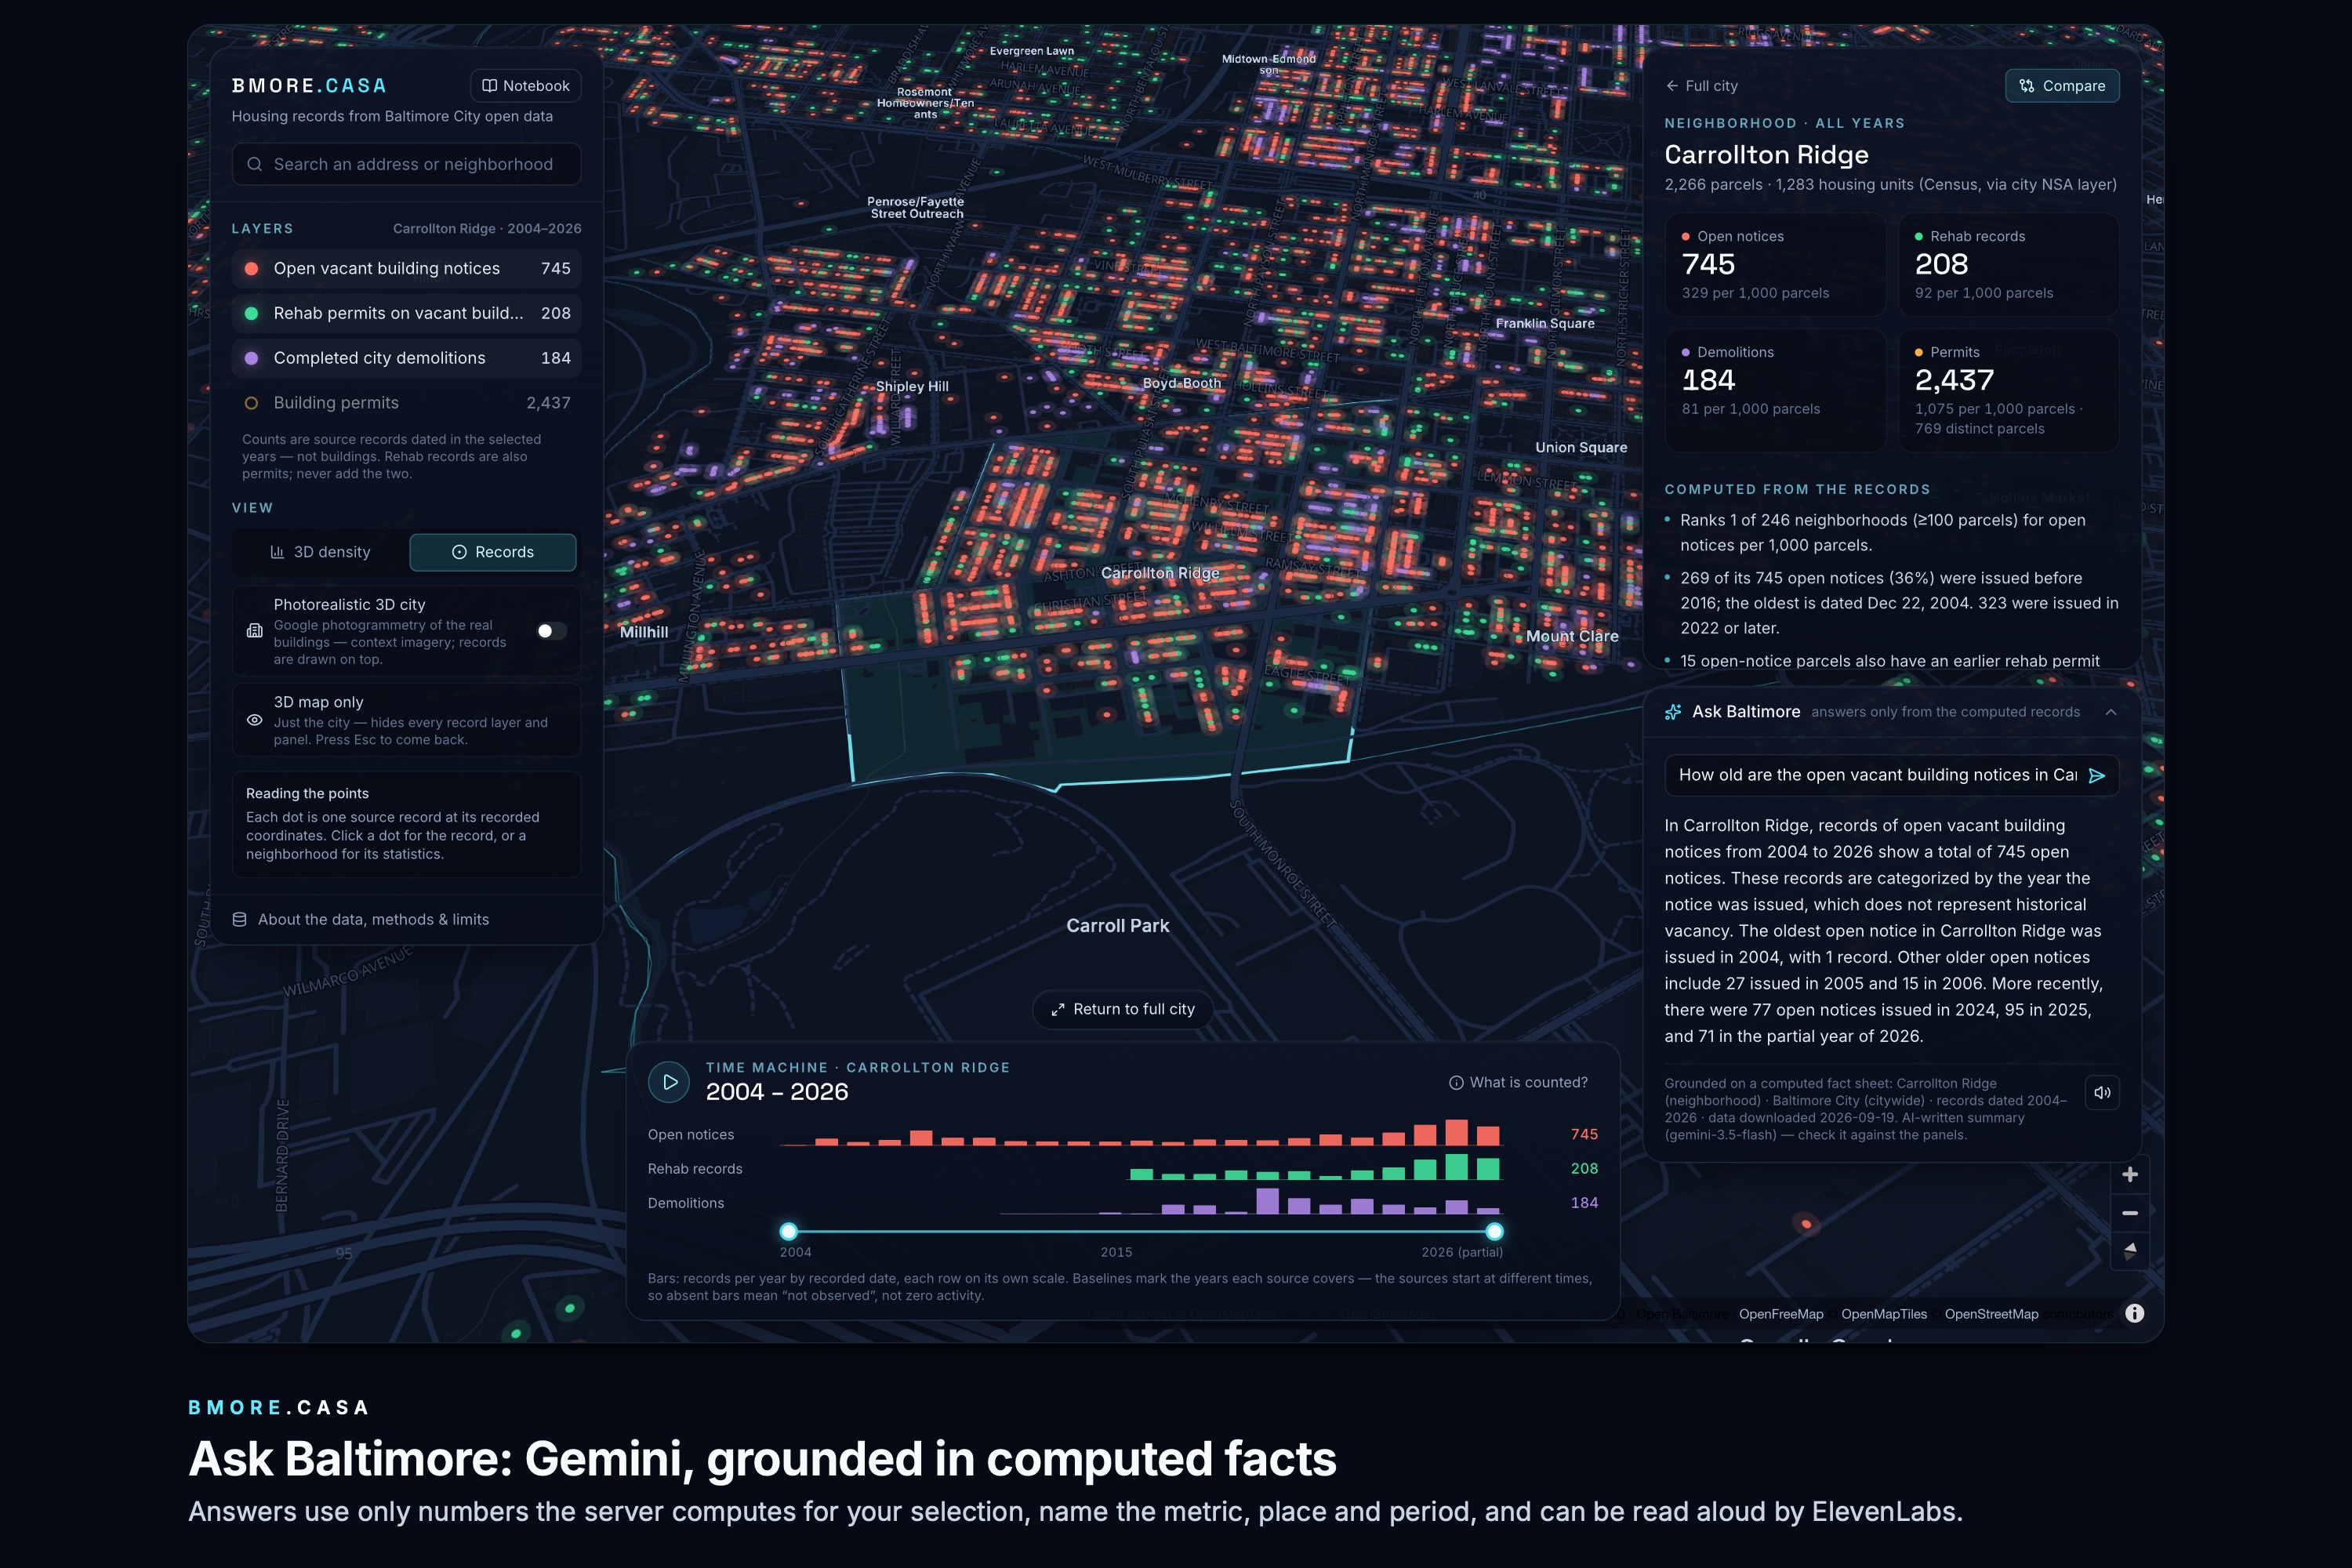
A real grounded Gemini answer (one API call on your key)
-
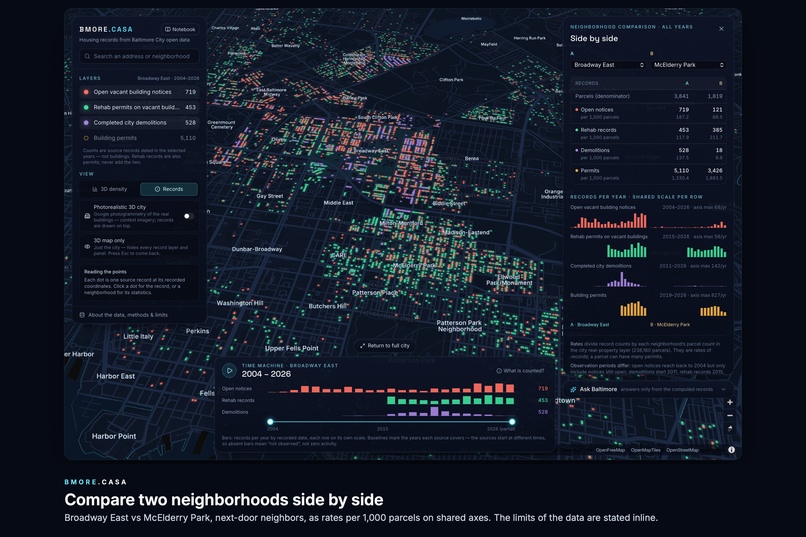
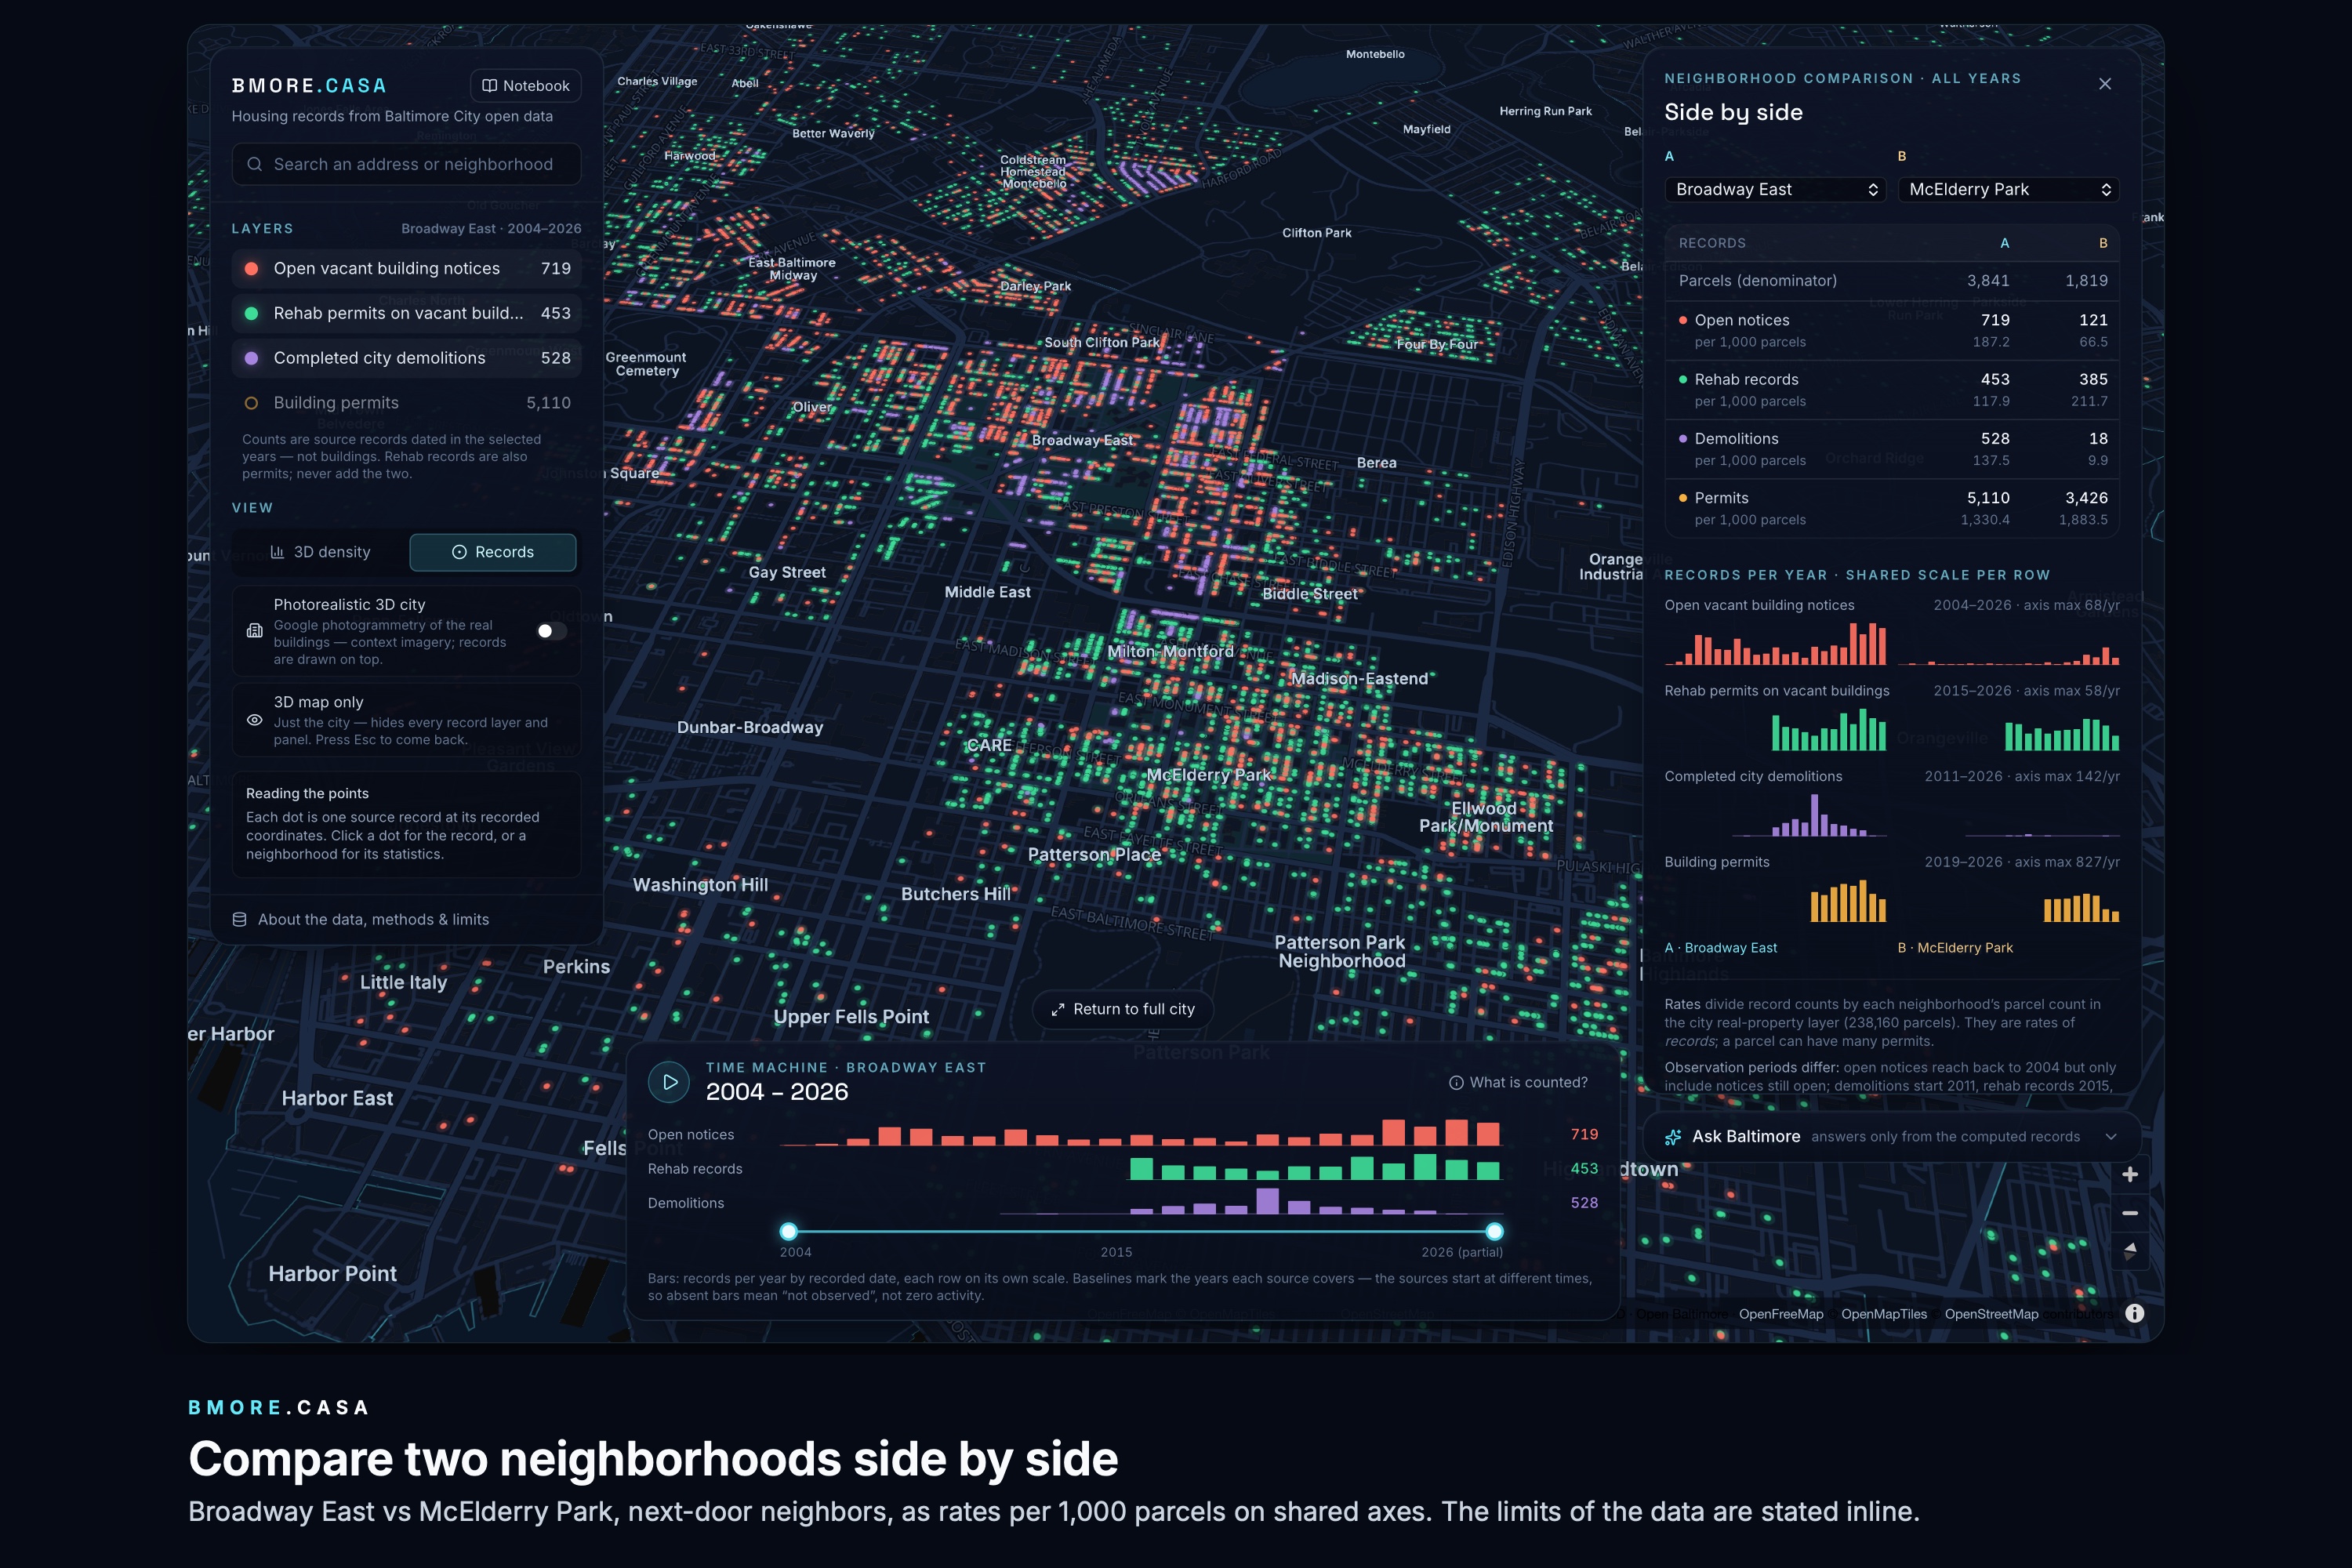
Broadway East vs McElderry Park, all years
-
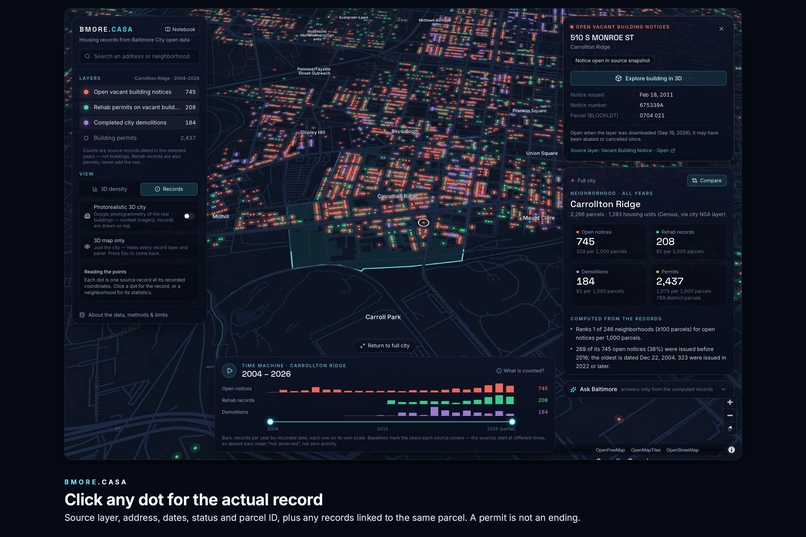
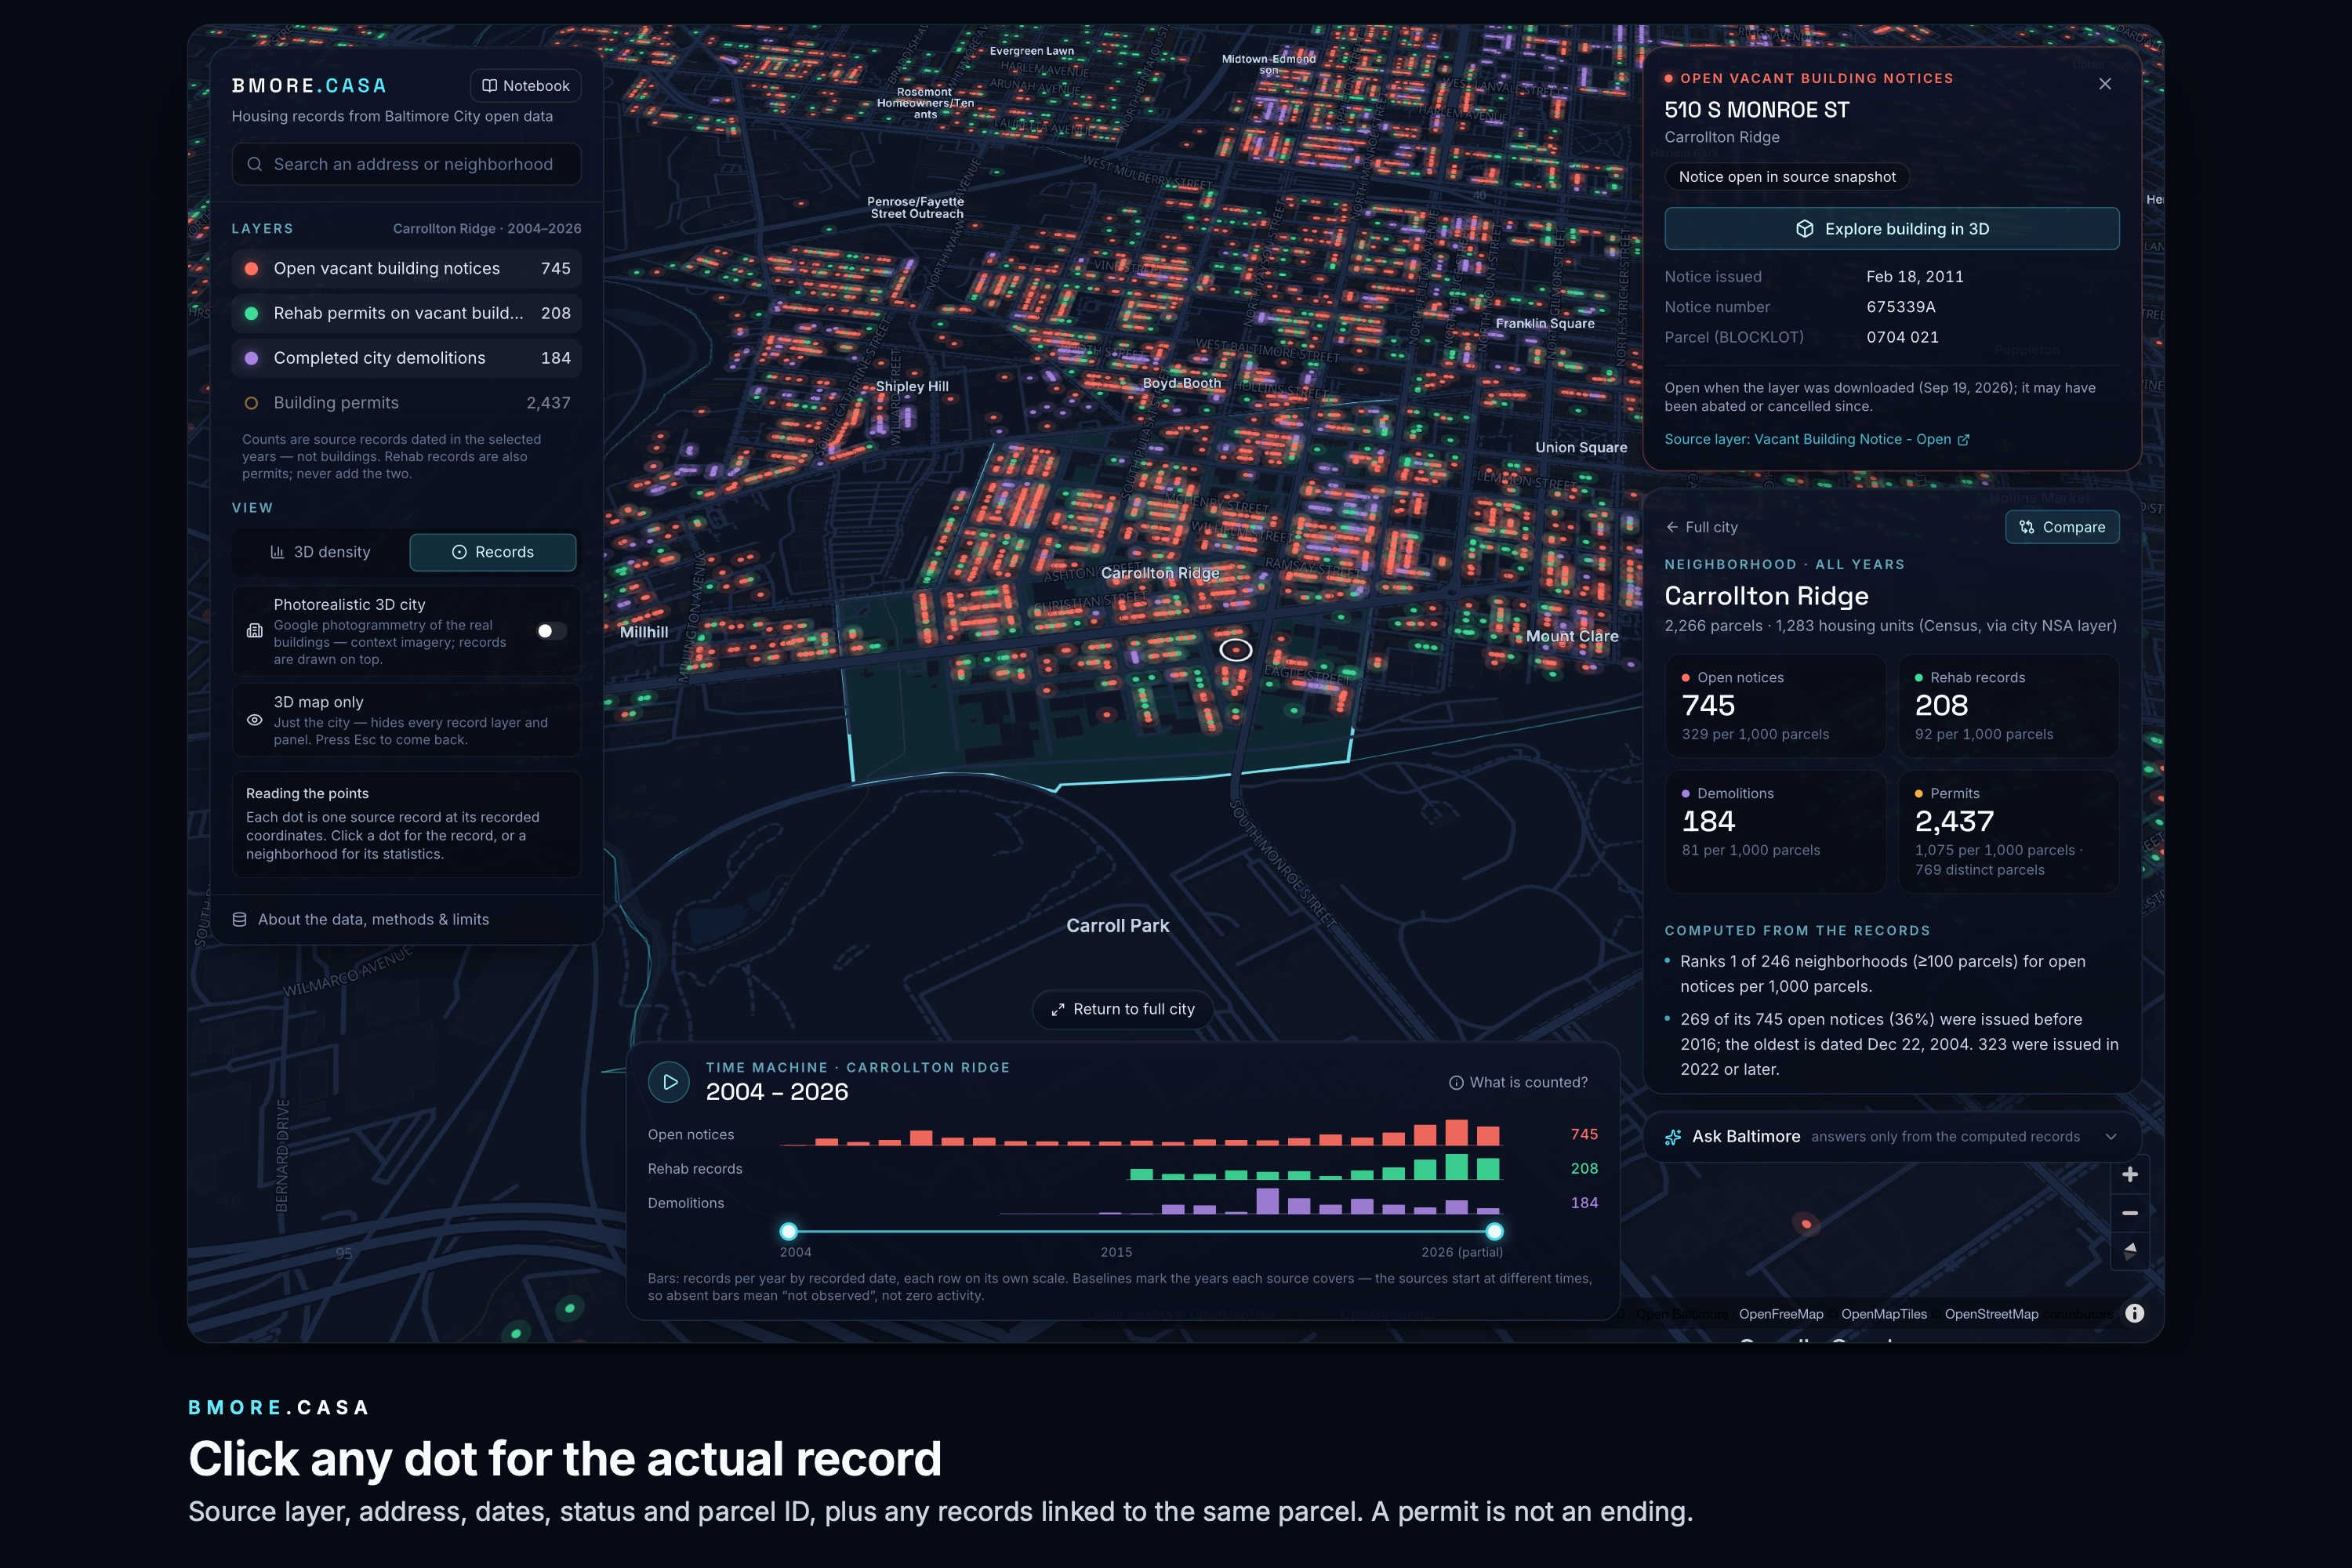
A real record opened (510 S Monroe St, notice from 2011)
-
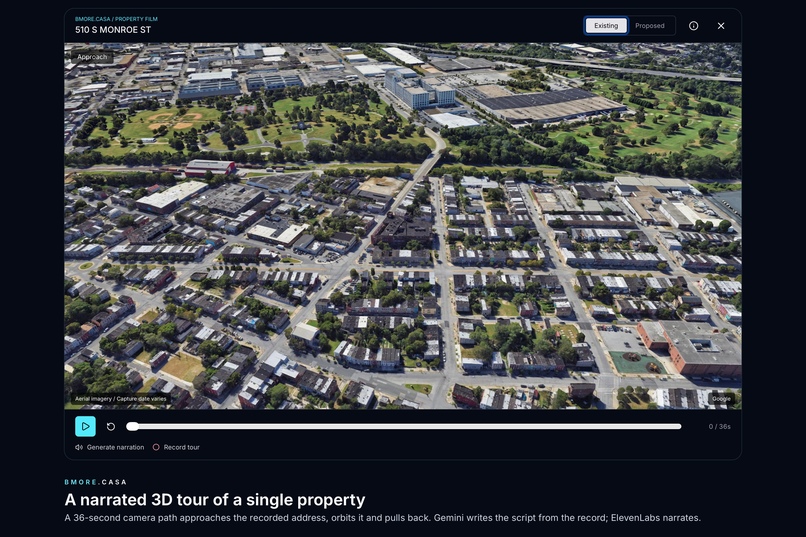
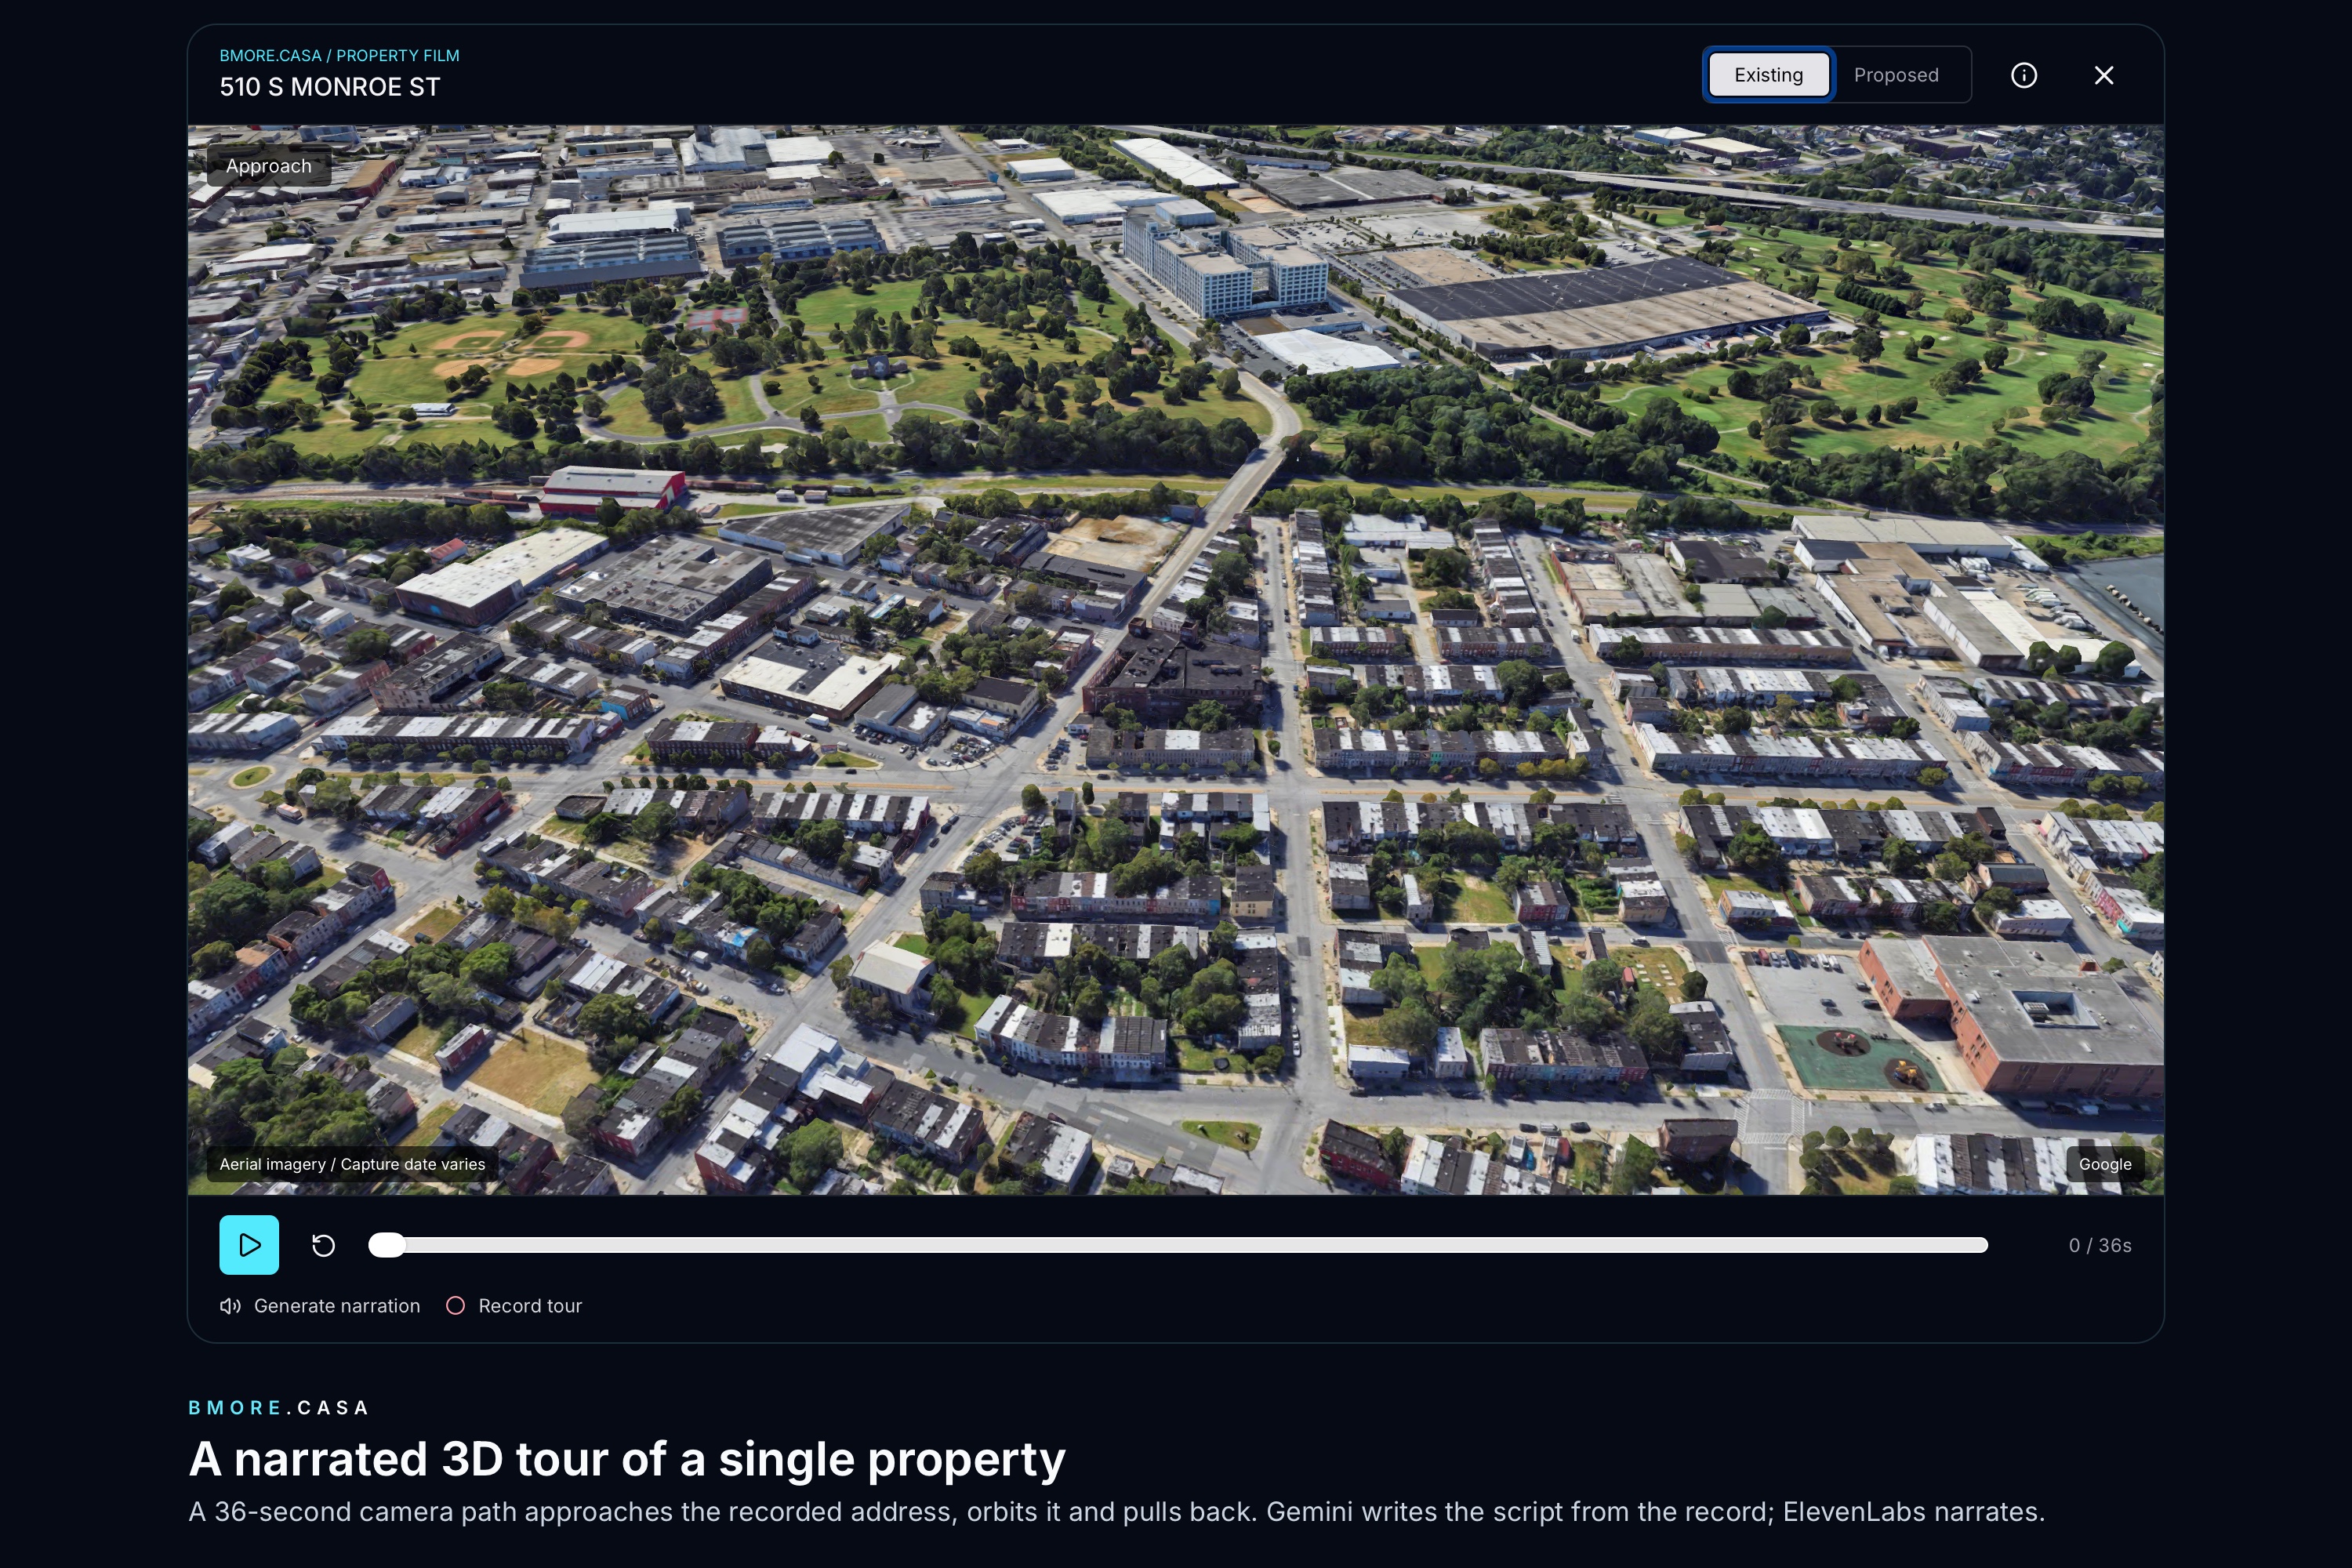
The 3D property film view
-
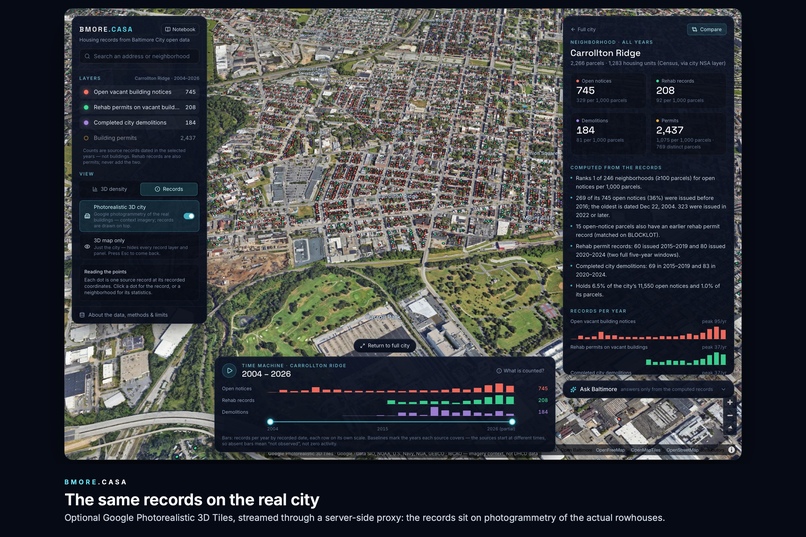
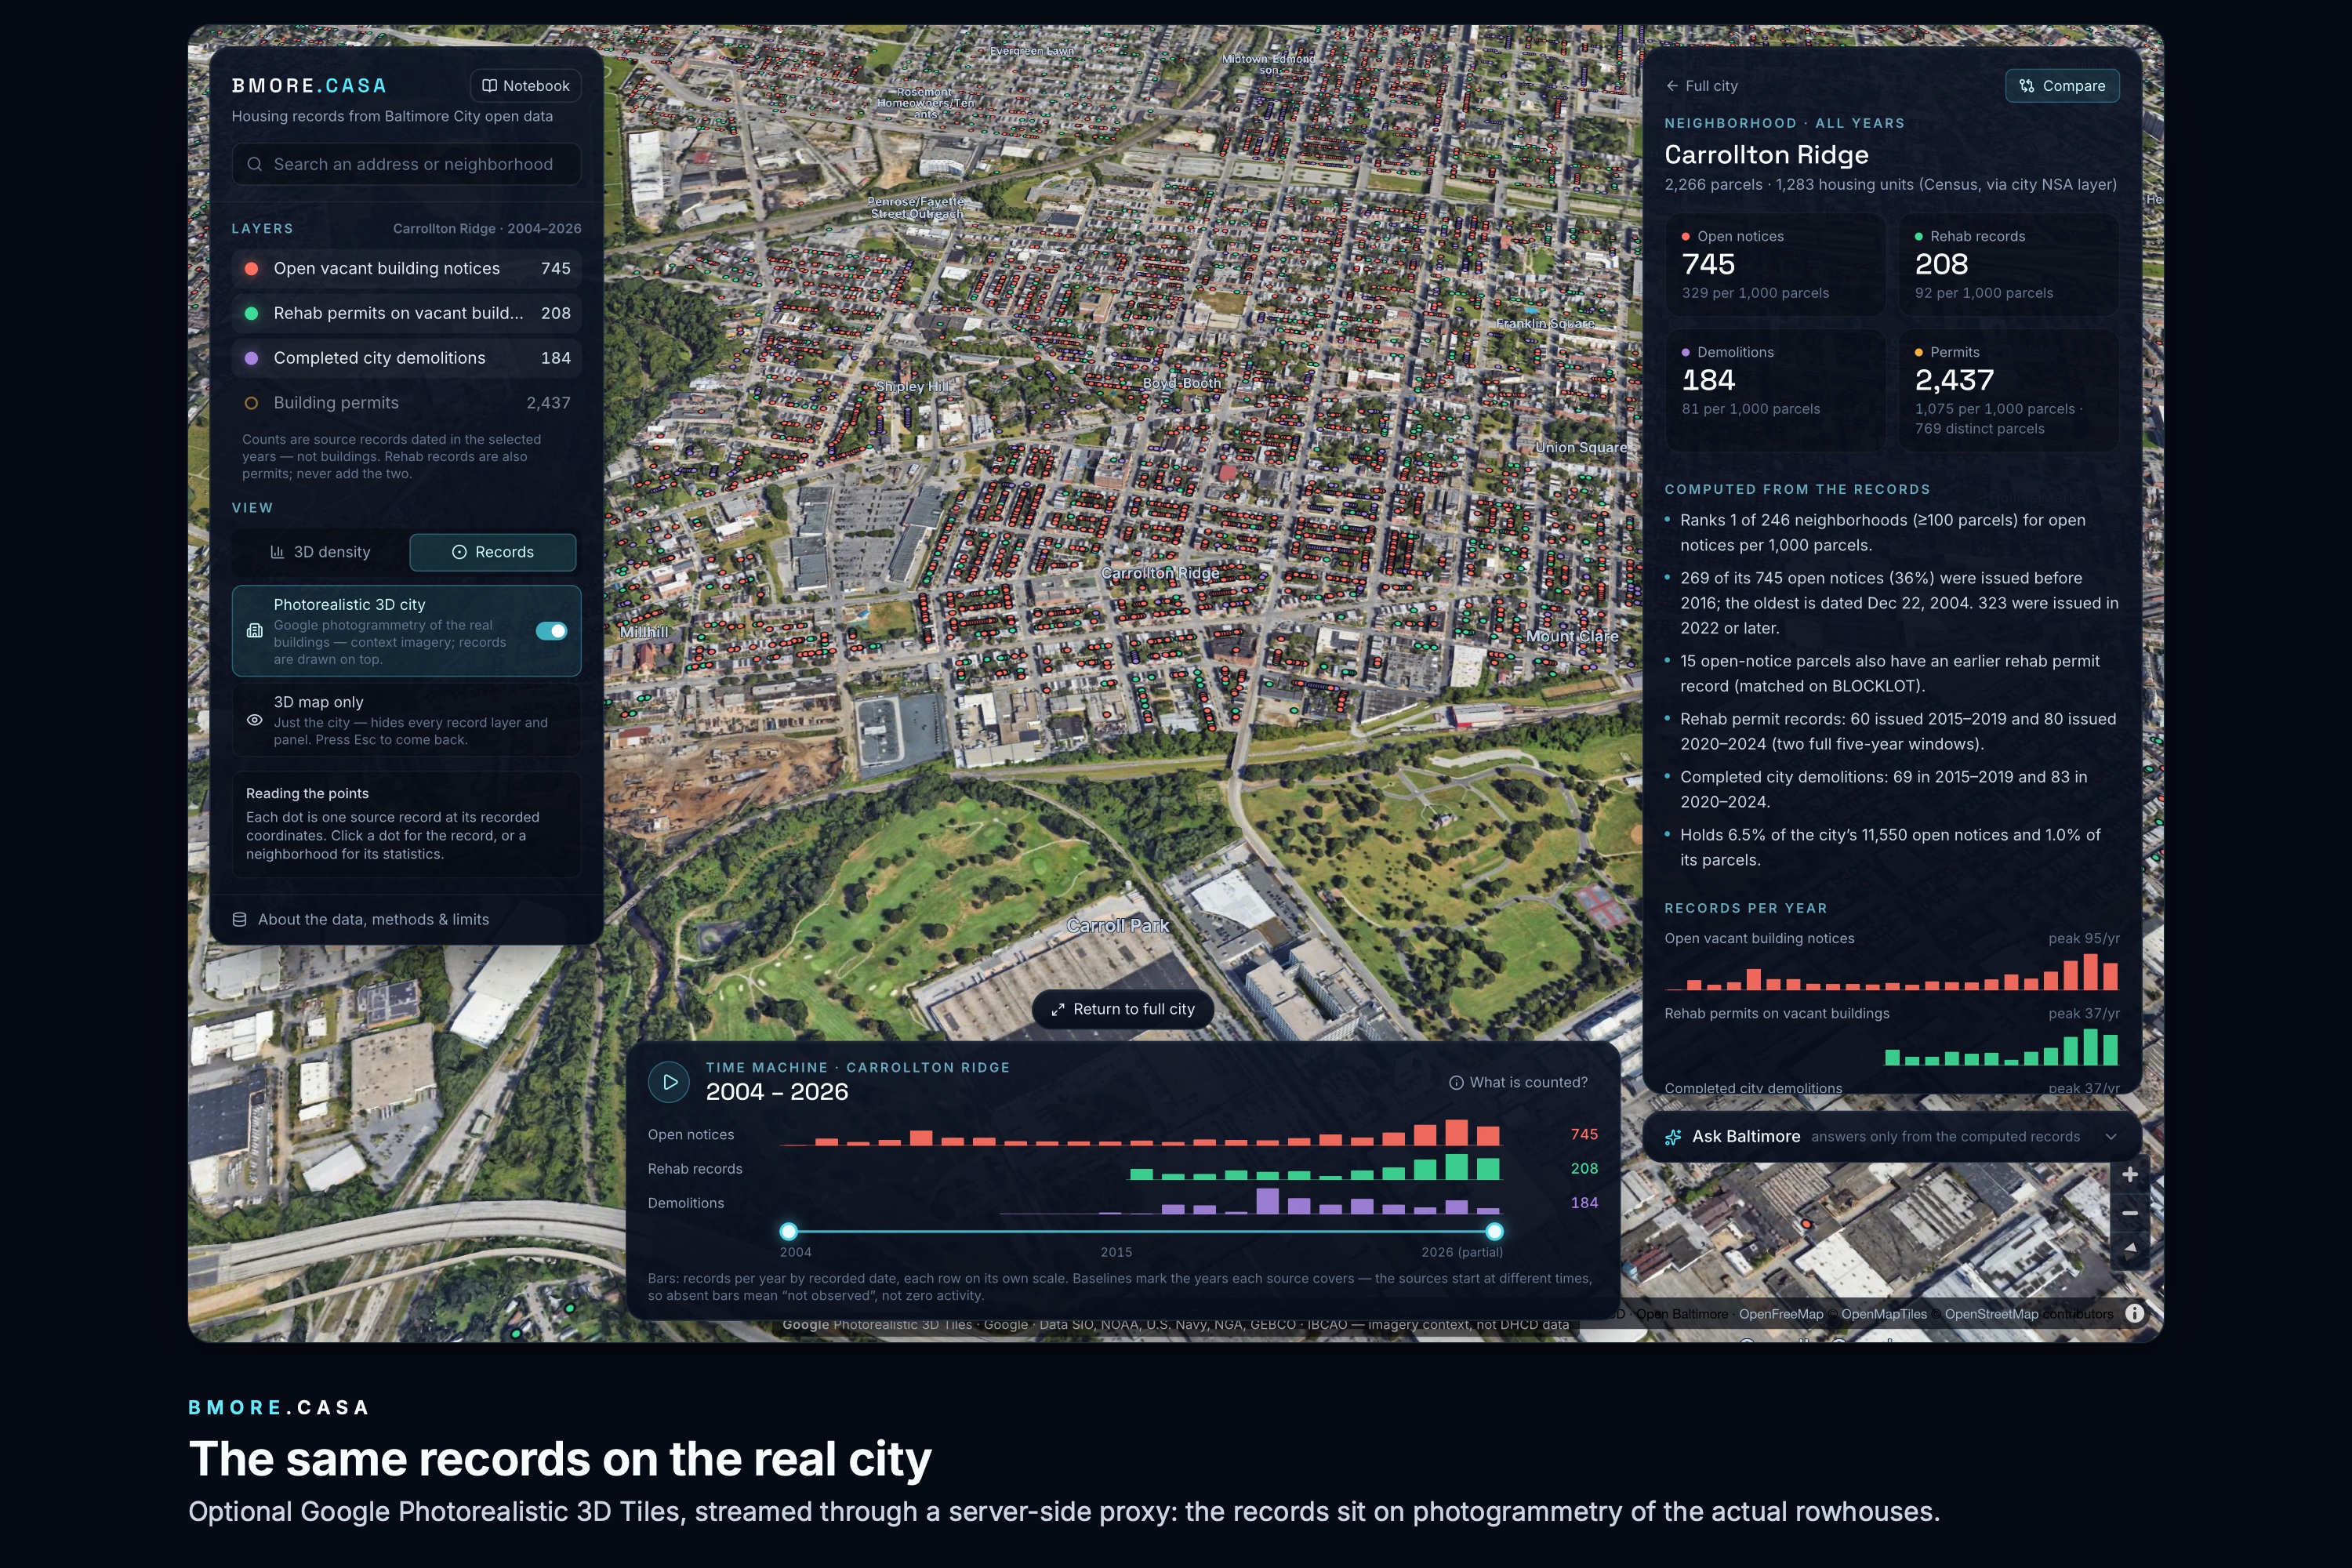
The records on Google's photorealistic city
Inspiration
Walk a few blocks in Baltimore and you pass a rowhouse with boards on its windows, then another. The city publishes a record of every one of them on Open Baltimore, but the records sit in separate layers: vacant building notices in one, rehab permits in another, demolitions and building permits in two more. A resident cannot easily ask the obvious question about their own block:
Where has vacancy lasted a decade or more, where is reinvestment being recorded, and do those two maps overlap?
We wanted to make that question answerable for any neighborhood, and to be honest about what public records can and cannot show.
What it does
bmore.casa is a civic data twin of Baltimore's housing records, in two parts that share one cleaned dataset:
- A reactive marimo notebook (bmore.casa/notebook, also on molab) that tells the story in five minutes: an executive summary with a Play/Replay chart, a custom notice-age widget, a clickable ridgeline of the ten hardest-hit neighborhoods that drives the map and comparison, a lasso-able map, a fair per-1,000-parcel comparison of any two neighborhoods, and a synthesis with downloadable records. An optional guided tour walks a first-time reader through it.
- A 3D web app (bmore.casa) built on MapLibre and deck.gl: 320 m hexagon columns whose height is the number of real records, a time machine from 2004 to today, every notice, rehab and demolition as a clickable point, neighborhood insight and comparison, address search, and an optional photorealistic 3D city with narrated property tours.
Ask Baltimore answers questions with Gemini, but only from a fact sheet the server computes for the current selection. It must name the metric, place and period, and it refuses causal questions or "is this building vacant today". ElevenLabs reads the answers and property narration aloud.
What the data shows:
- 11,550 open vacant building notices; 29% were issued before 2016, the oldest in 2004.
- 10 of 279 neighborhoods hold 38% of them. Carrollton Ridge has 329 open notices per 1,000 parcels, the highest rate in the city.
- City demolitions peaked at 780 in 2019 and fell to 163 in 2025, while rehab permits on vacant buildings rose from 959 to 1,253.
- A permit is not an ending: 202 parcels carry an open notice issued after their rehab permit.
How we built it
- Pipeline (Python, uv, httpx, Polars, DuckDB, Shapely). We download six Open Baltimore layers from the city's ArcGIS services, about 322,000 records. The downloader fetches metadata first, counts, then pulls features in object-ID batches, retries errors, and aborts unless the rows downloaded equal the count the API reports. Processing normalizes dates and addresses, validates coordinates, fills missing neighborhood labels with a point-in-polygon join, and links layers only on the city's parcel ID (
BLOCKLOT). Output is Parquet plus a DuckDB file, and about 4 MB of JSON for the browser. - Notebook (marimo, Plotly, DuckDB, anywidget, WigglyStuff). One
selectiondataframe feeds the stat tiles, map, timeline and table, so changing a control re-runs exactly the cells that depend on it. The map is wrapped inmo.ui.plotly, which turns a lasso into a Python value. The notebook ships with PEP 723 inline dependencies and a data archive it unpacks itself, so it runs from a single command or a molab fork with no API keys. - Web app (Next.js 16, TypeScript, Tailwind 4, MapLibre GL 6, deck.gl 9, Three.js). The 293,000 permits are never sent in bulk: citywide they appear as aggregated columns, and individual permits load per neighborhood on demand. Google Photorealistic 3D Tiles stream through a server-side proxy so keys never reach the browser.
- AI (Gemini, Veo, ElevenLabs). Gemini answers are grounded in server-computed numbers; Veo generates clearly-labelled renovation concept films from a photo the user owns; ElevenLabs provides narration.
- Shipping. Both halves run on one domain behind Caddy, with GitHub Actions running typecheck, tests, the build, and a headless run of every notebook cell, including a standalone run of the packaged notebook.
- We built with AI coding agents (Claude Code, Codex and Cursor) and reviewed their output against the data. No language model invents a record, scores a neighborhood or produces any statistic shown.
Challenges we ran into
- The vacancy data is not a history. Both vacancy layers, including the one titled "All Vacant Building Notices", contain only notices that are still open: the cancel and abate dates are empty on every record. We could not show "vacant buildings in 2015", so the timeline shows when today's open notices were issued, and the app says so everywhere.
- Two timestamp conventions. One service stores true UTC instants, another stores local wall-clock time labelled as UTC. Both had to be normalized to Baltimore calendar dates.
- IDs that are not unique. The demolition layer reuses object IDs for different demolitions, so IDs could not be a join key. ArcGIS also returns errors as HTTP 200, which a naive downloader treats as success.
- Scale in the browser. 293,000 permits would not fit a web page, which led to the hex-binned columns and per-neighborhood loading.
- Making the notebook impossible to break. Judged notebooks cannot show errors, so every input is checked before use, missing data produces a message instead of a traceback, and CI runs the packaged notebook from an empty folder on every push.
- Hosting marimo publicly. After a server restart, tabs that were already open silently stopped reacting because of marimo's skew-protection token. We found it in the logs and now run with it disabled for the public link.
- Keeping the AI honest. Getting Gemini to refuse "why" questions and stick to computed numbers took more work than getting it to answer.
Accomplishments that we're proud of
- A complete pipeline from the city's raw services to two polished, live products in one weekend, both at bmore.casa.
- A custom anywidget and an adapted ridgeline chart that are real controls, not decoration: one click recomputes the whole notebook, with keyboard access.
- Honesty as a feature. Every chart says what one record is, rates use parcels as the denominator, unobserved years are shown as gaps instead of zeros, and the limits of the data are stated next to the claims.
- The "relapse" finding: 202 parcels with a new vacancy notice after a rehab permit, which turns a dataset into a list of addresses worth visiting.
- It works offline. Once the data is downloaded the app makes no calls to the city's servers, and the map falls back to a local style on bad Wi-Fi.
What we learned
- Read the data before trusting its title. The most important fact about our main dataset was what it left out.
- Administrative records describe what a city wrote down, not what happened. A permit is not completed work, and a correlation between vacancy and rehab is partly built into how the rehab layer is defined.
- Reactive notebooks change how you build: a marimo notebook is a plain Python file, so it diffs cleanly, an agent can edit it like any module, and
python baltimore.pyis a full test. - AI agents are fast at writing code and need a skeptical reader. One comparison claimed to omit unobserved years while plotting zeros in them; we only caught it by reading the plotting code, not the prose.
What's next for bmore.casa
- Snapshot the open-notice layer daily. The city only publishes open notices, so repeated snapshots are the only way to see notices enter and leave the list.
- Follow a parcel end to end by joining 311 requests, tax-sale and receivership data from Open Baltimore.
- Bring the 3D map into the notebook as a custom anywidget, so clicking a neighborhood on the map drives every cell.
- Put it in residents' hands: shareable links per block and exportable address lists for community associations, outreach teams and reporters.
Built With
- baltimore-datasets
- bun
- cursor
- elevenlabs
- gemini
- google-maps
- marimo
- python
- typescript
- uv


Log in or sign up for Devpost to join the conversation.