Inspiration
We are incredibly saddened by the fact that misinformation around the Covid-19 vaccines remains prevalent, which has caused many unfortunate and unnecessary deaths from unvaccinated patients, as detailed by the Washington Post. Thus for this hackathon, we want to build something that will help reduce Covid-19 misinformation on social media, thus leading to our idea of BlueZone
What it does
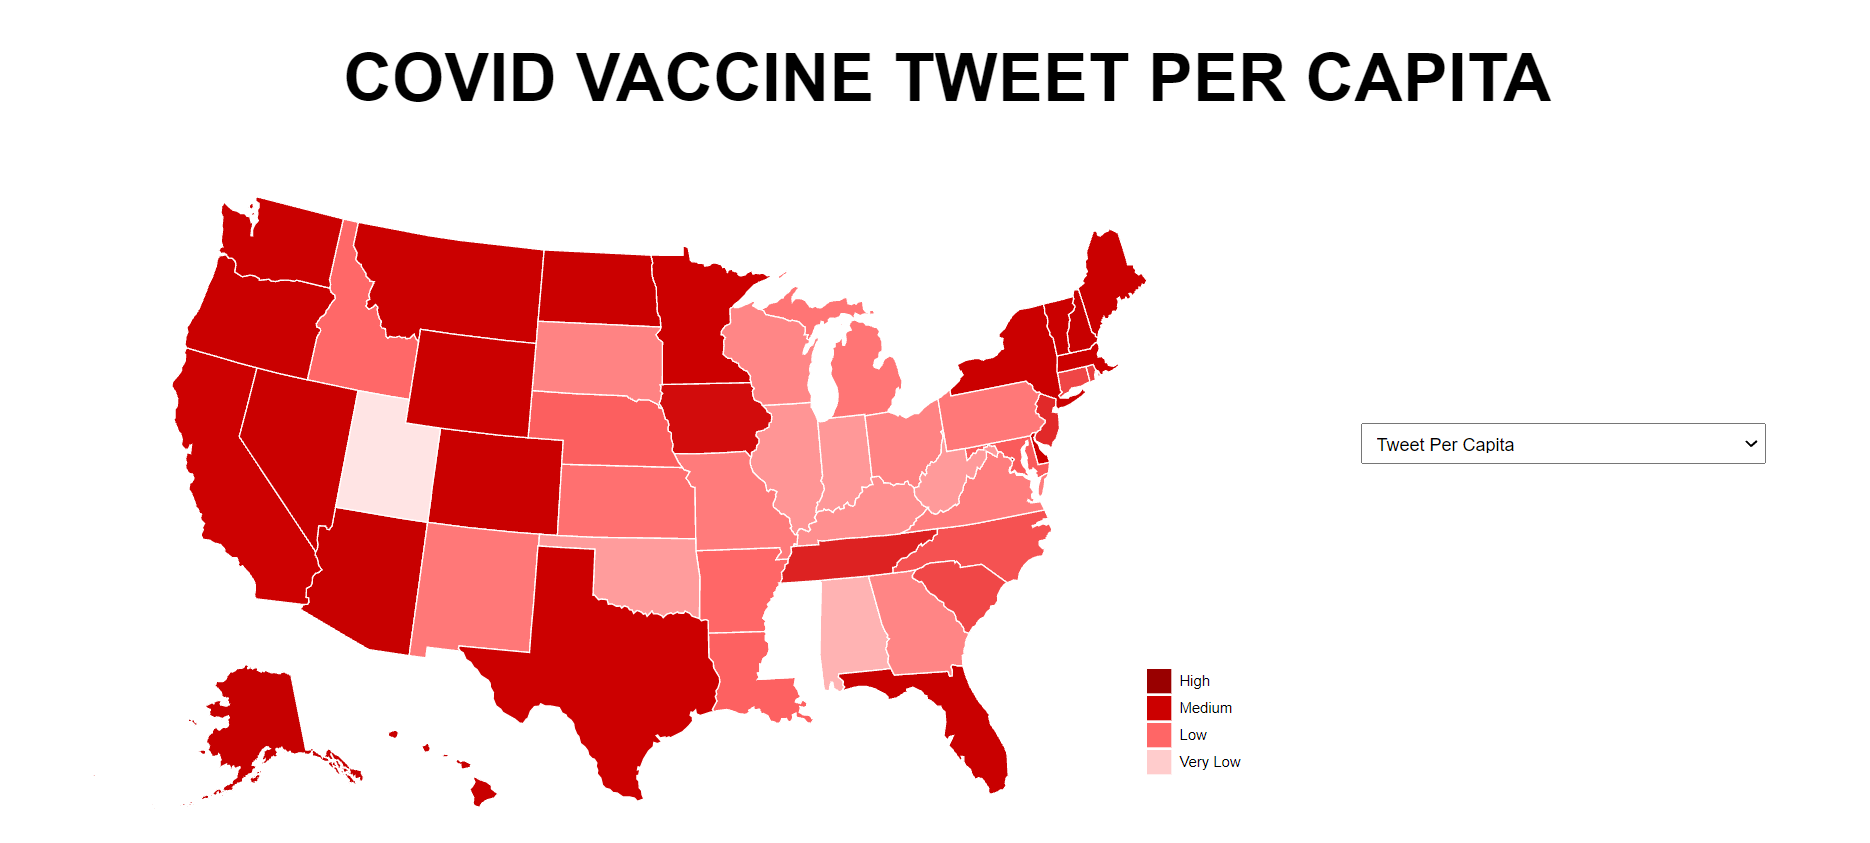
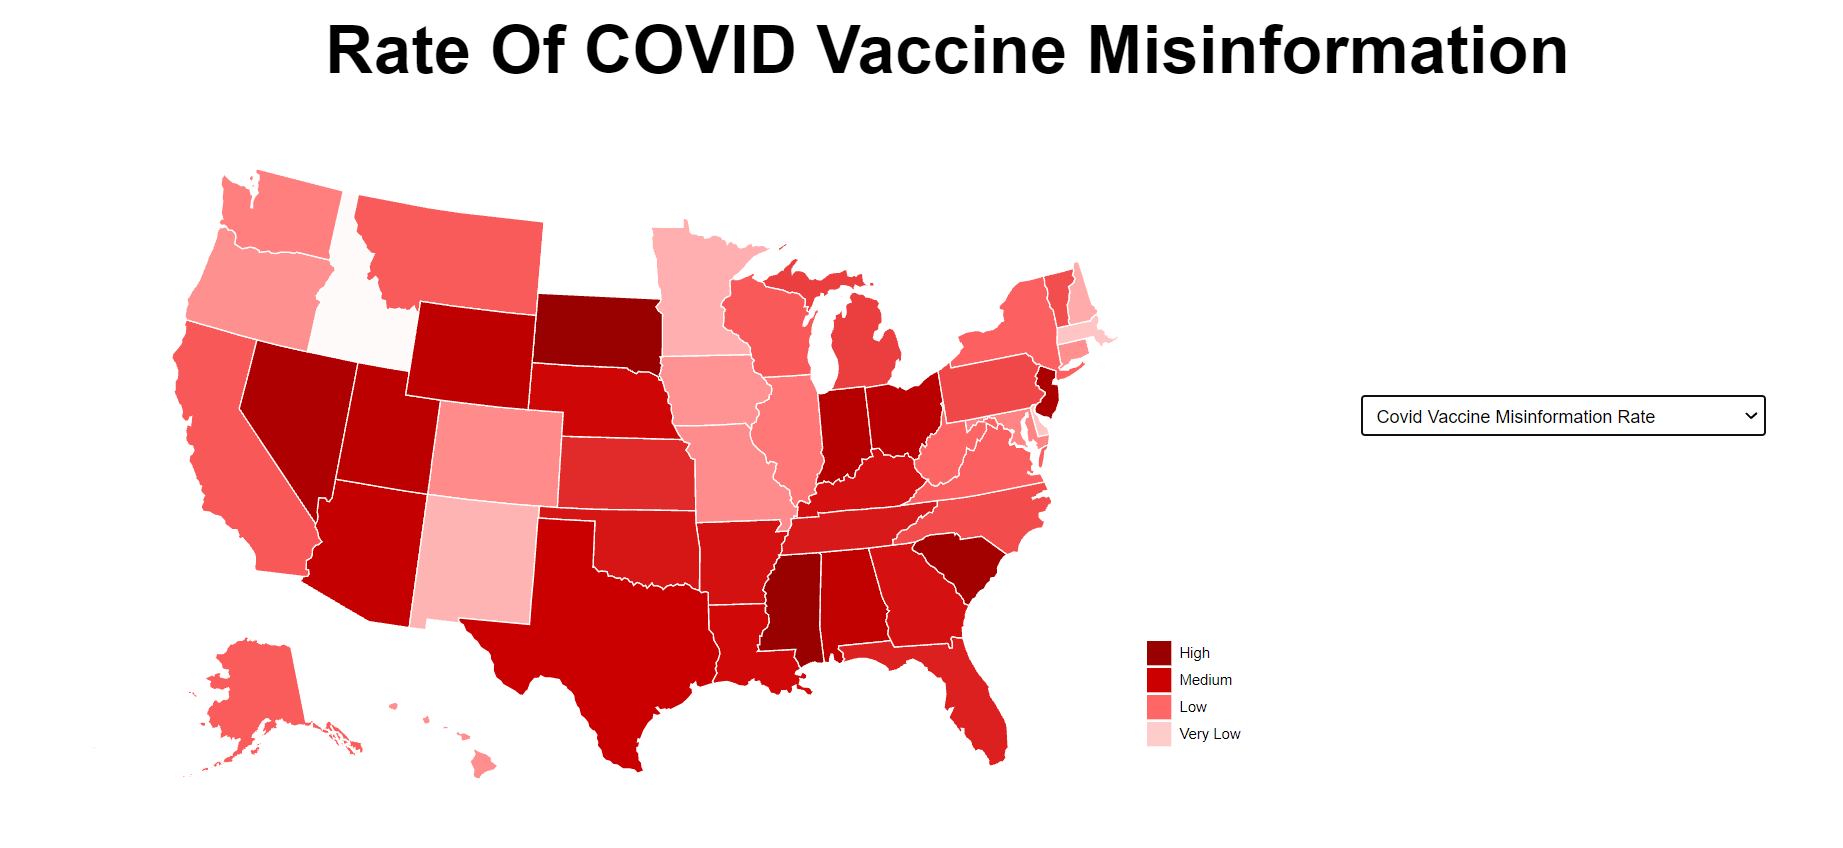
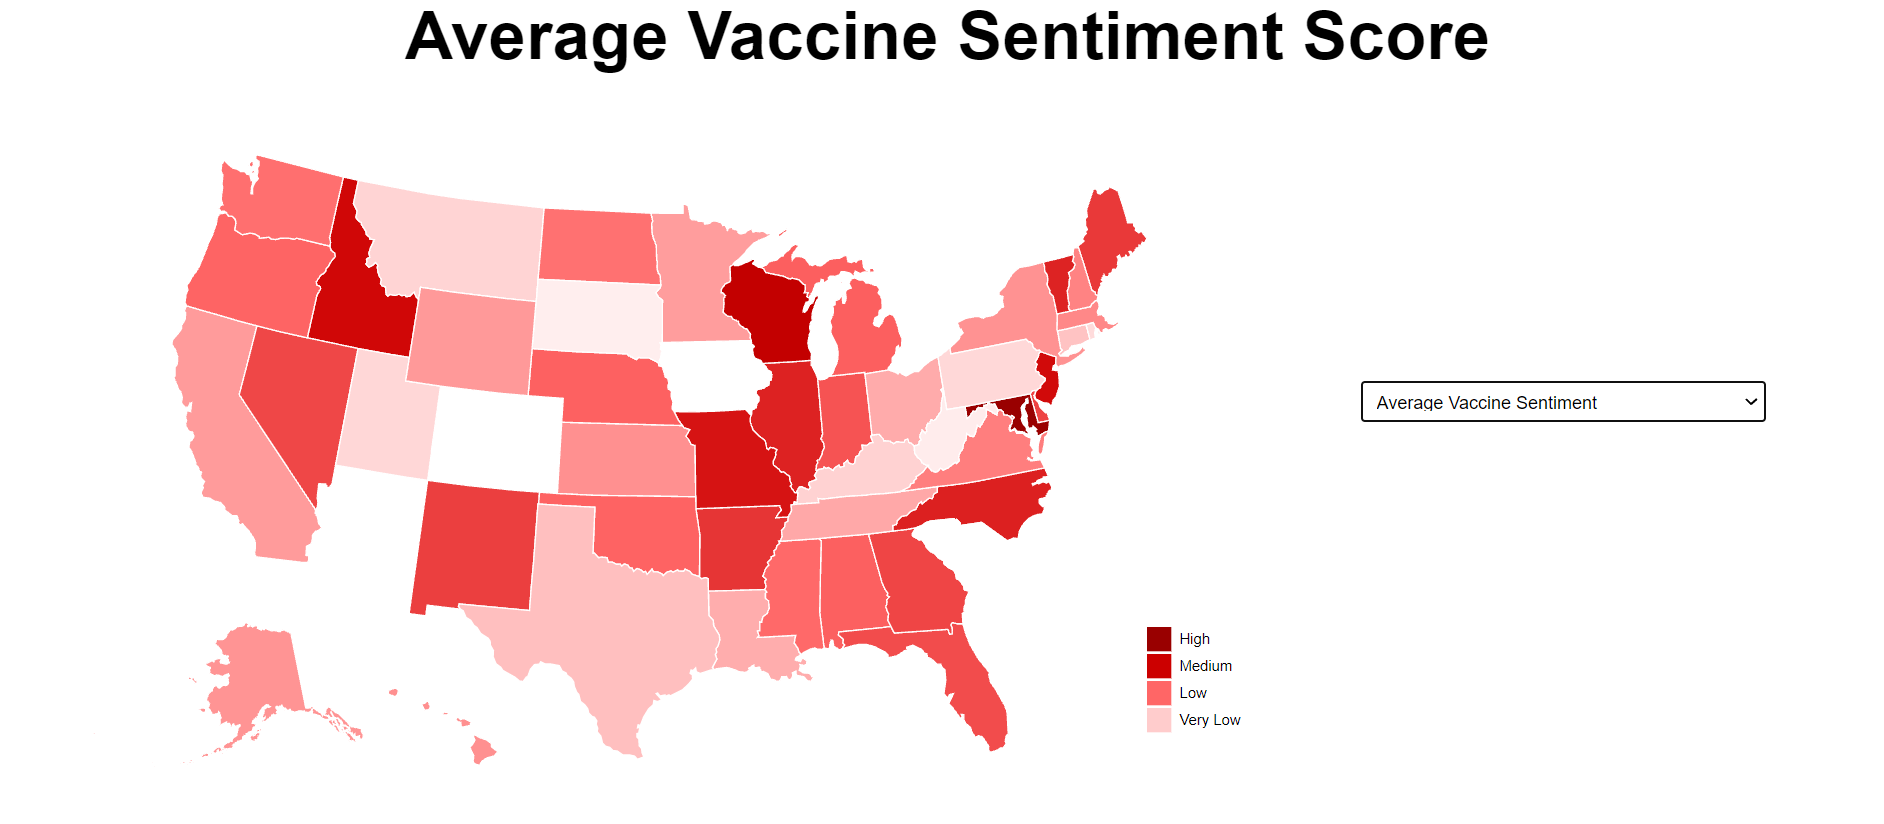
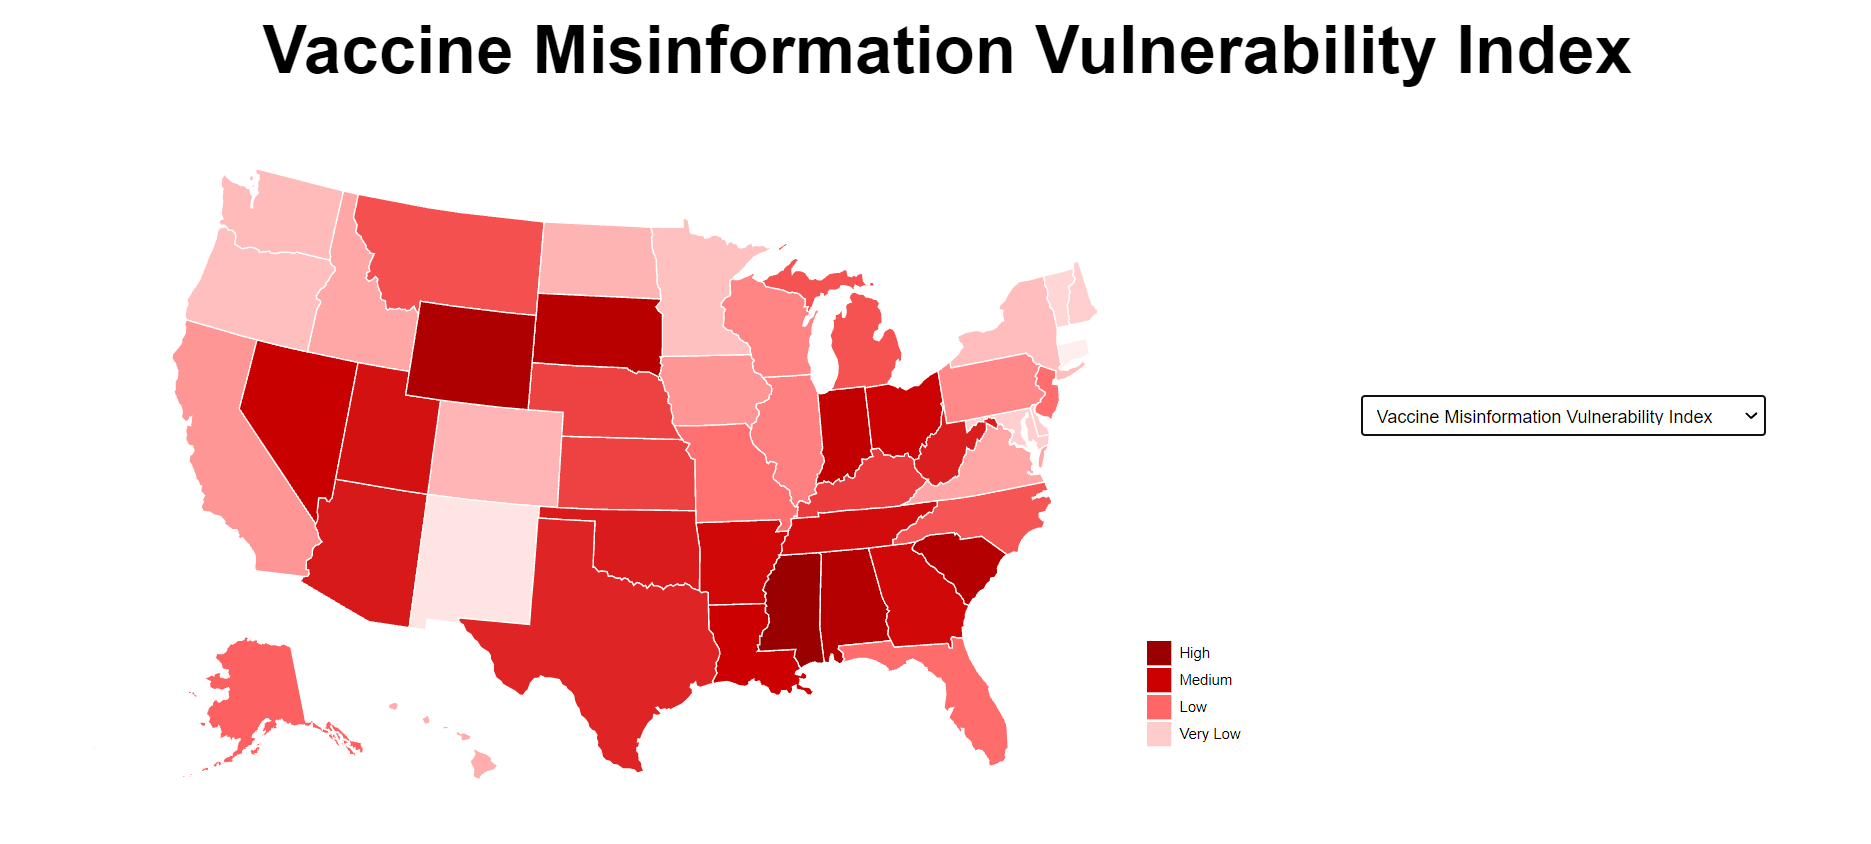
Ideally, BlueZone is an dashboard that collects Twitter tweets regarding Covid-19 vaccine and vaccine-related misinformation in the background, and visualizes the prevalence of and vulnerability to Covid-19 vaccine misinformation across the 50 US States. In particular, it will automatically calculate and visualize what particular misinformation topic is currently prevalent for each state and also how vulnerable each state is to misinformation based on their current vaccination rate and vaccine misinformation rate
How we built it
Due to time constraints, we performed all Tweet-gathering via the Twitter API and derivation of key metrics using Python (pandas, tweepy, numpy). To collect tweets on Covid-19 vaccine misinformation, we identify common terms that are extremely likely to be associated with vaccine misinformation (list can be found in Github Link), on top of generic Covid vaccine search terms. After calculating the score of the 4 key metrics (described in the Github Link and video presentation) for each state, we export this data to a csv file, which will then be used for visualization using the d3.js library
Challenges we ran into
One early challenge we found was that not all users self-report their location data (a key criteria for visualization). Furthermore, since user location is self-reported, the location format is highly variable and requires careful parsing to retrieve the state where user resides (or None if the user resides elsewhere). However, the biggest challenge we ran into was that most members of the team had very little practical experience regarding d3.js and other web technologies, which significantly slowed down development time.
Accomplishments that we're proud of
We are extremely proud of the fact that despite our lack of experience, we managed to finish extracting data and building 4 interactive visualizations for key metrics regarding COVID vaccine misinformation from the 155000 tweets gathered over a period of 24 hours, which we hope will be useful for public health officials to help strategize their outreach efforts against COVID misinformation.
What's next for Bluezone
We hope to turn Bluezone into a full-fledged web dashboard that can be expanded to other areas of medical misinformation.


Log in or sign up for Devpost to join the conversation.