-
-
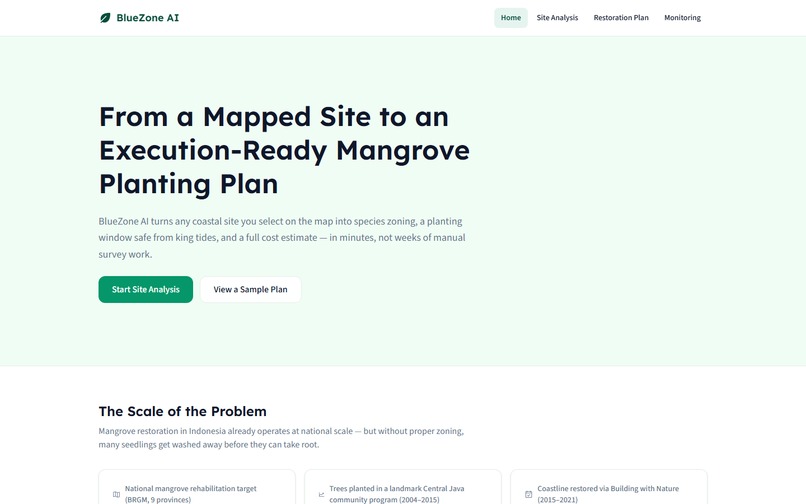
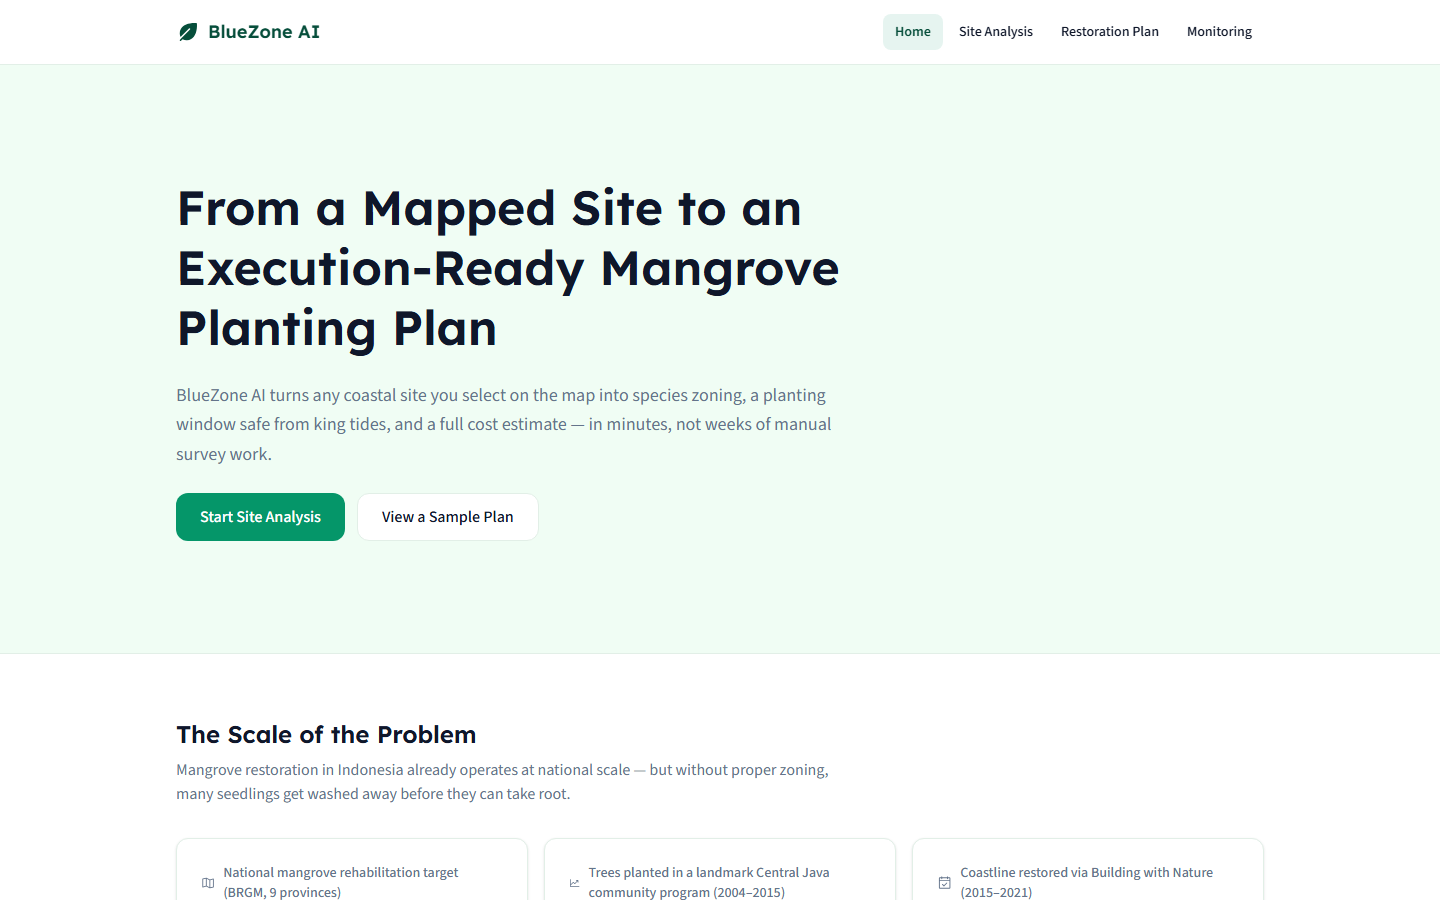
Landing Page
-
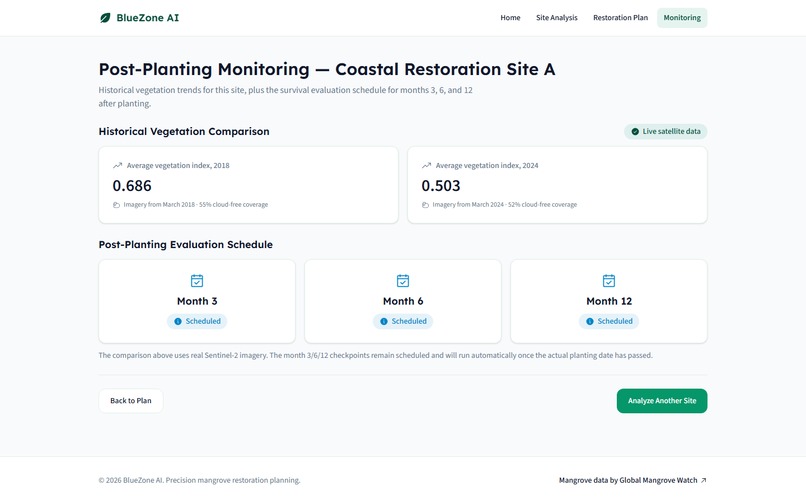
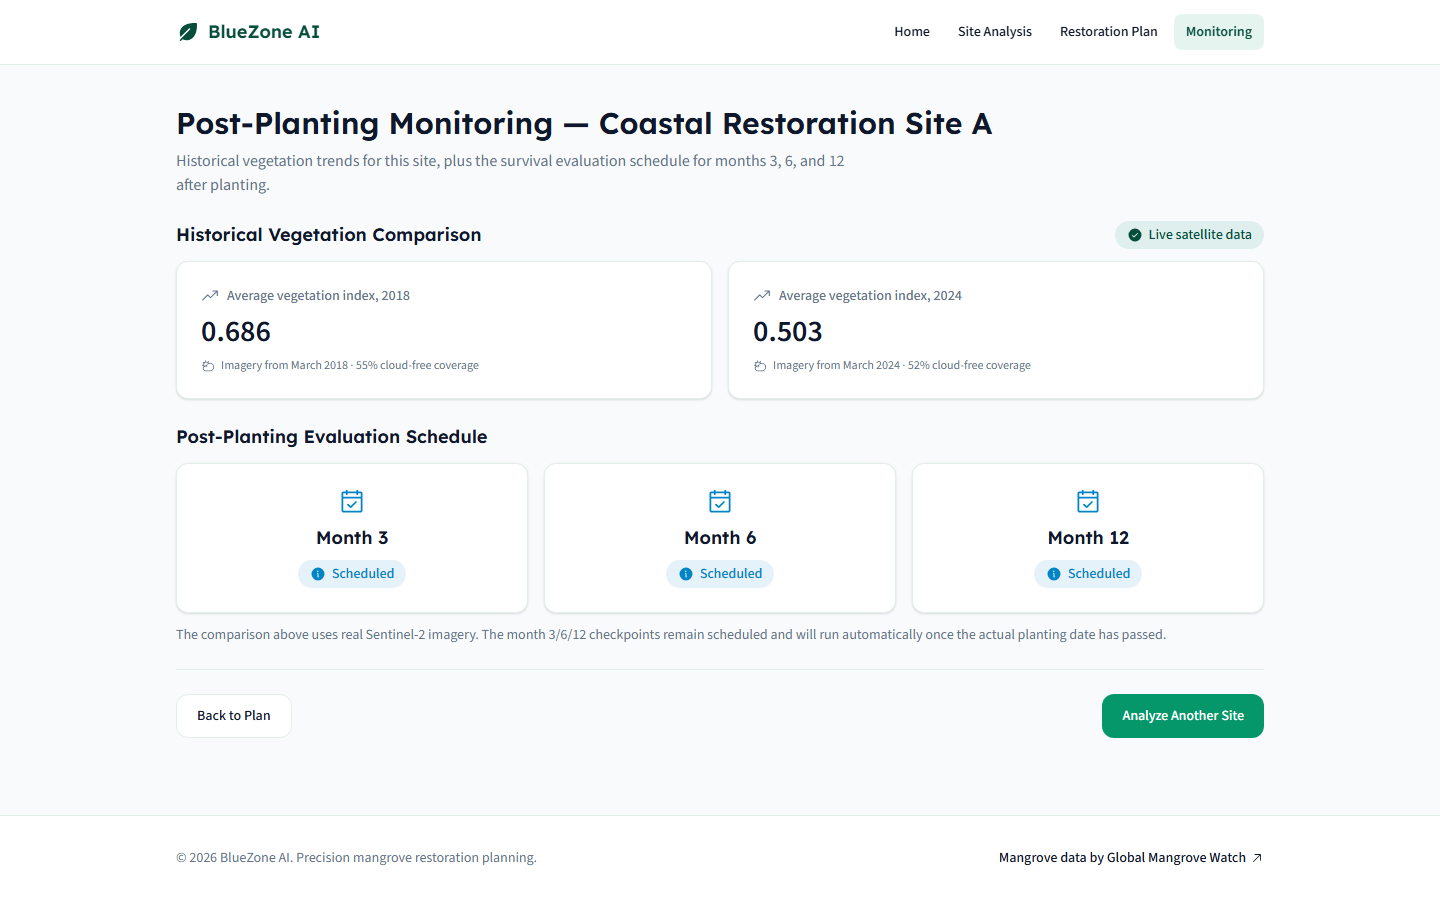
Monitoring
-
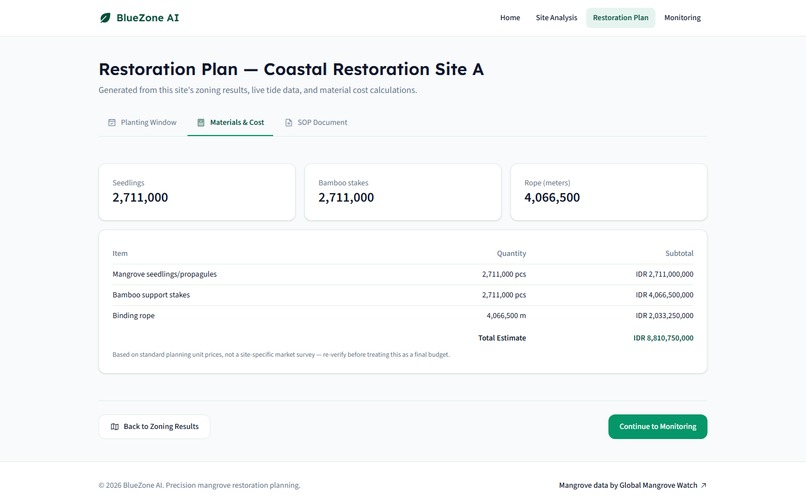
Restoration Plan Cost
-
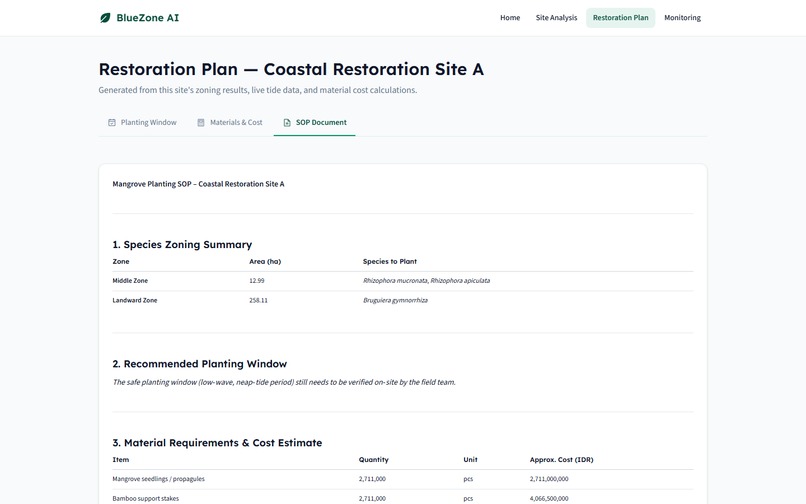
Restoration Plan Sop
-
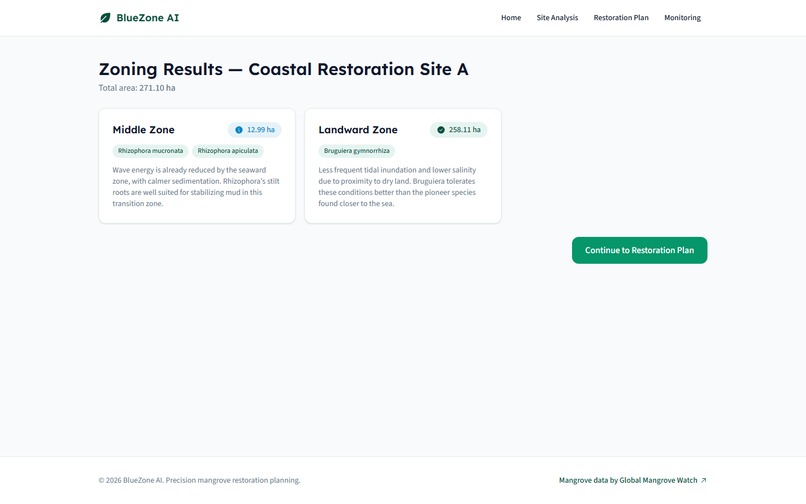
Site Analysisz
-
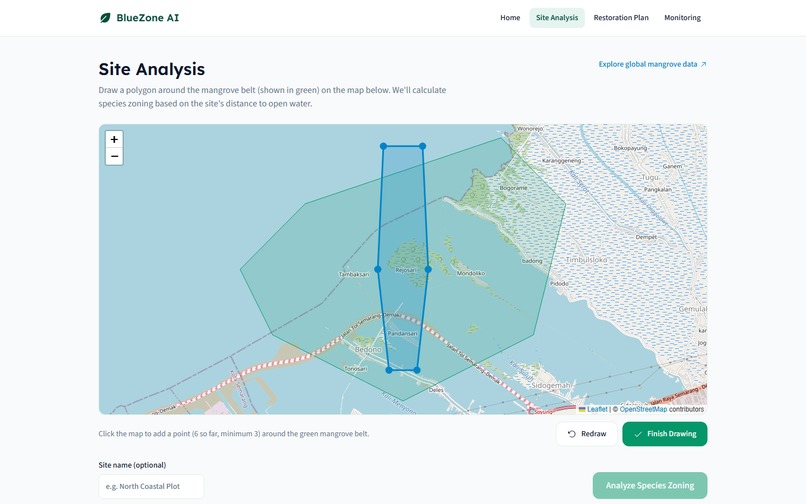
Zoning Results
Inspiration
Indonesia's mangrove restoration efforts already run at national scale — Indonesia's Peatland and Mangrove Restoration Agency (BRGM) targets 600,000 hectares of rehabilitation across 9 provinces. But most seedlings are planted without proper species zoning or tidal timing, so many get washed away before they take root — a "plant and pray" pattern that has caused countless community programs to fail. A field facilitator with no GIS or ecology background has no easy way to turn a coastal site into a scientifically-grounded, ready-to-execute planting plan. We wanted to close that gap: take one polygon drawn on a map and turn it into everything a field team actually needs.
What it does
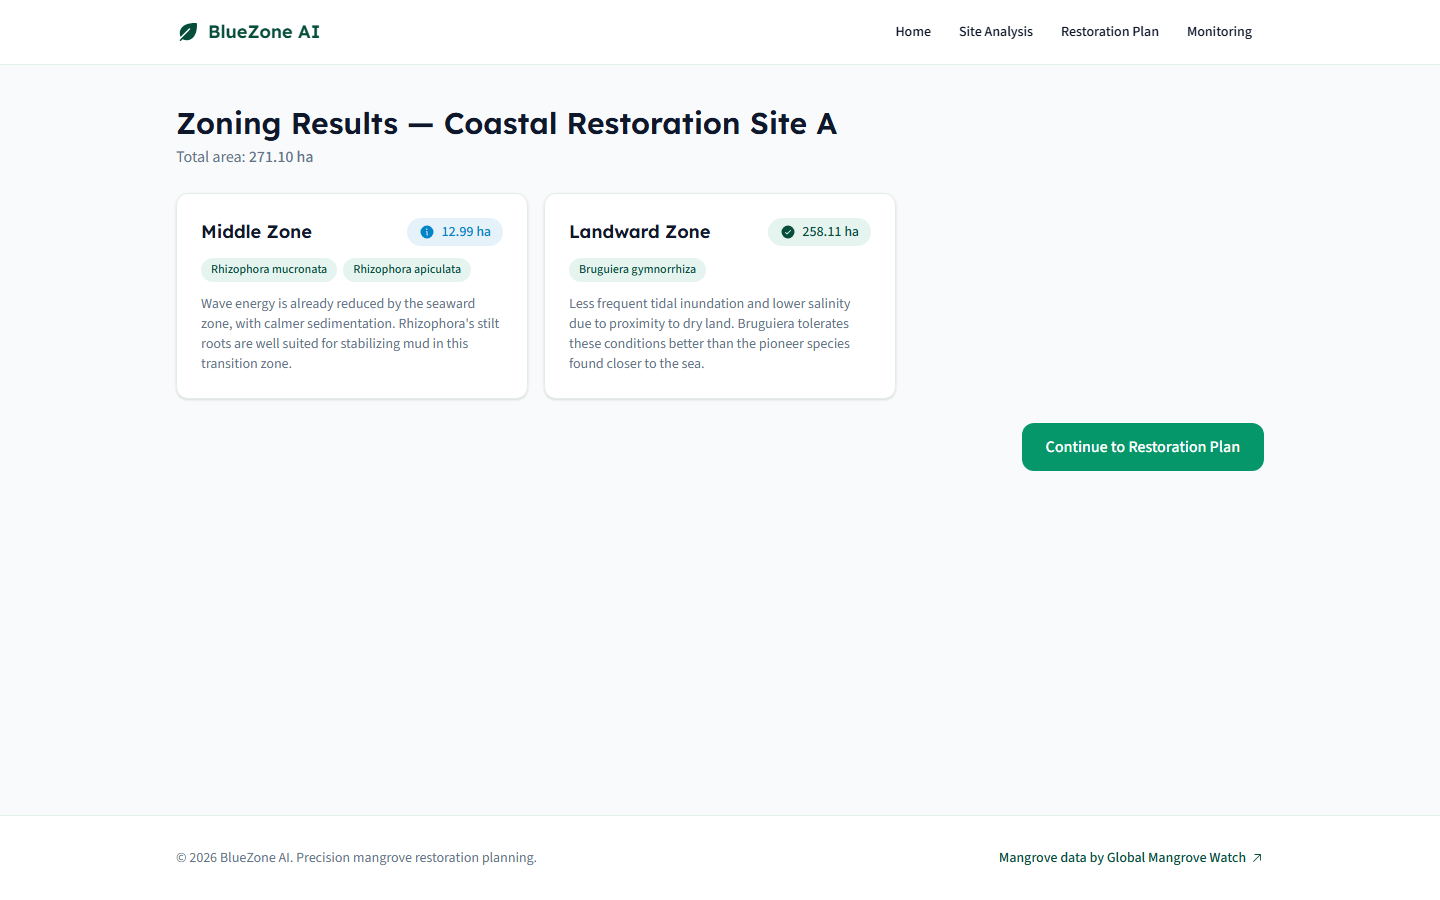
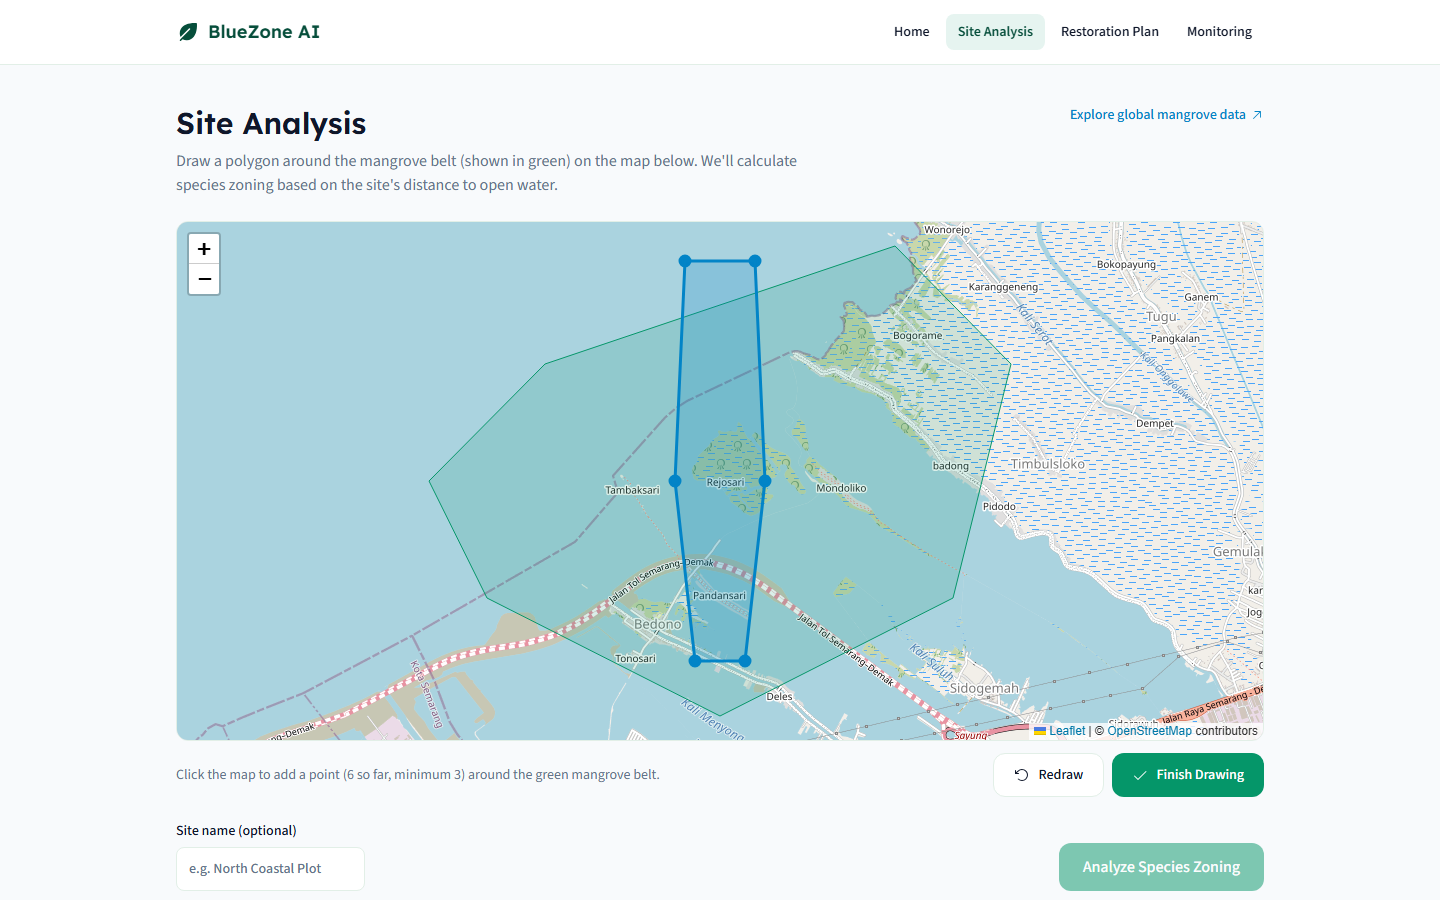
- Species zoning — the user draws a polygon on an interactive map; the app classifies it into seaward, middle, and landward zones based on distance to open water, and recommends the right mangrove species for each zone, grounded in established zonation science.
- Planting window — pulls live tide data to find the safest upcoming dates (low tidal range, lower risk of seedlings being washed away).
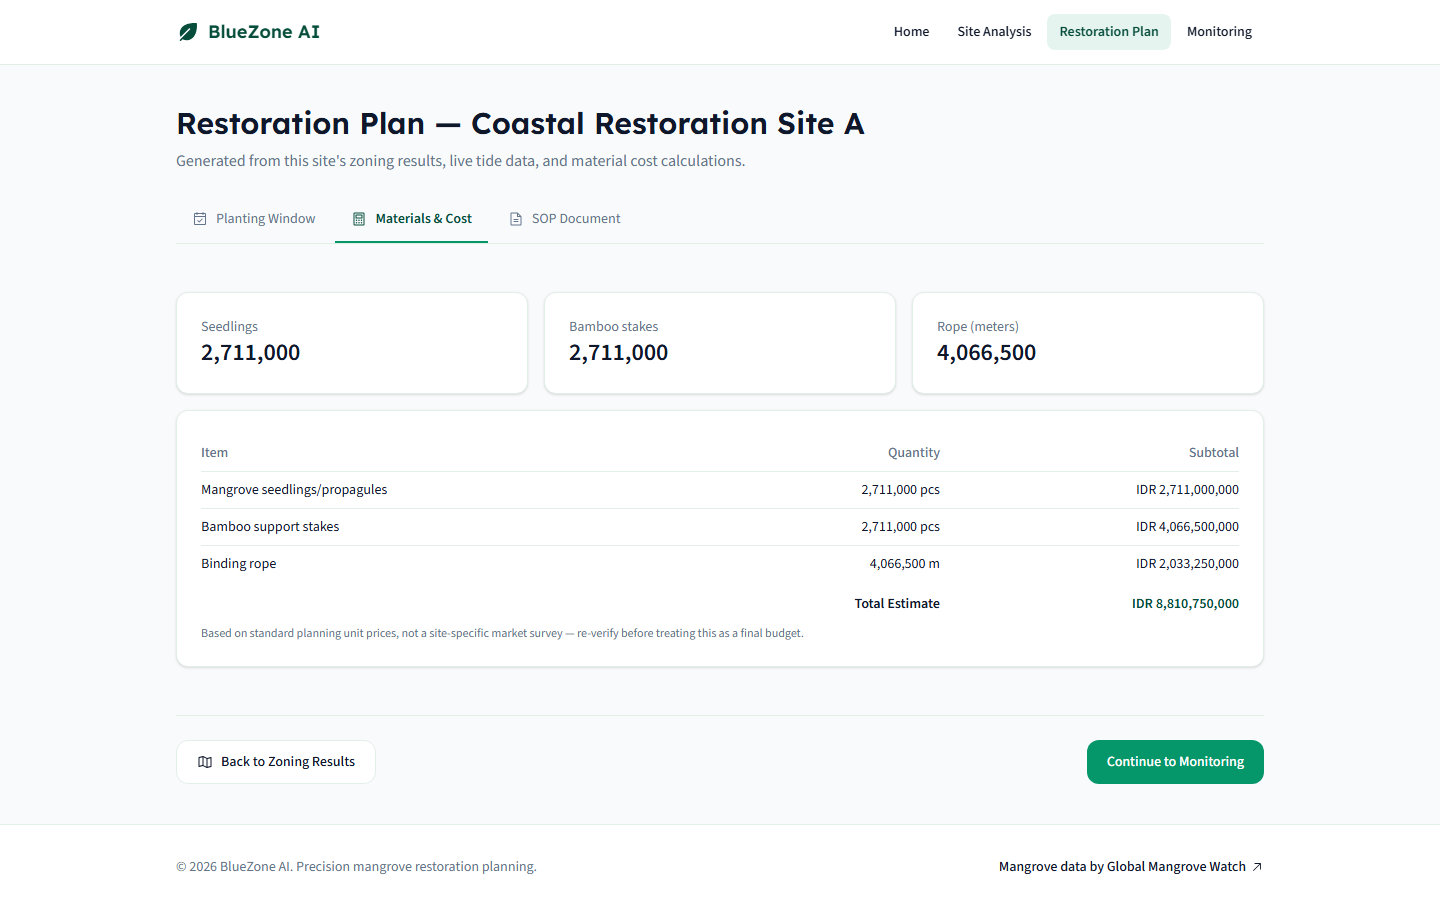
- Material & cost estimate — calculates seedlings, bamboo stakes, rope, and a budget estimate for the site.
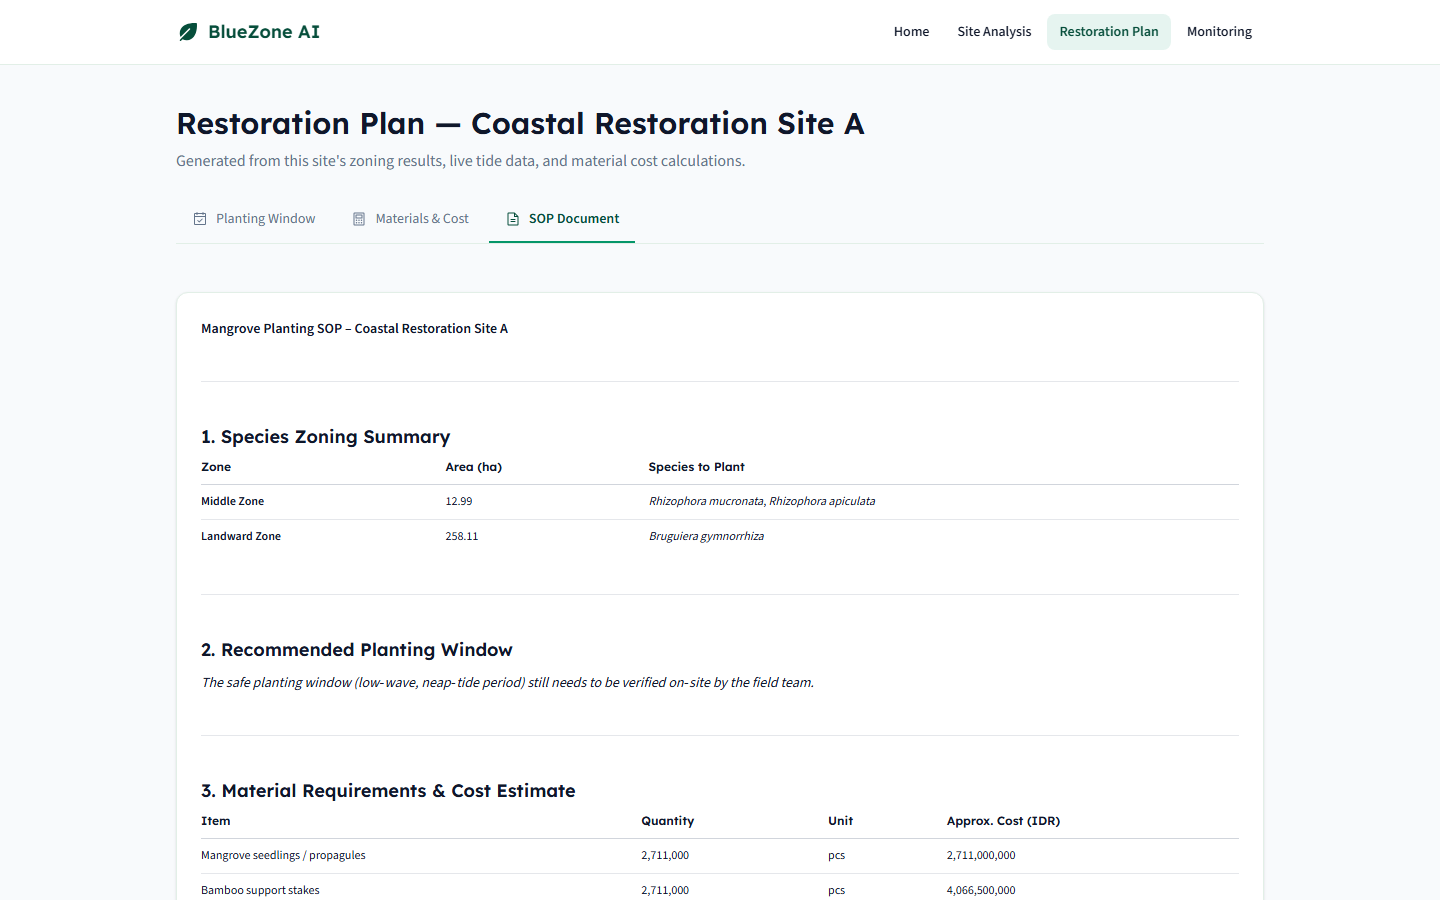
- AI-drafted SOP — an AI agent calls the planting-window and cost tools for real figures, then writes a complete, ready-to-use Standard Operating Procedure, downloadable as a PDF.
- Satellite monitoring — shows a real historical vegetation-index (NDVI) comparison for the site from actual satellite imagery, plus a post-planting evaluation schedule for months 3, 6, and 12.
How we built it
A Next.js 16 (App Router, TypeScript, Tailwind CSS v4) web app with three real external data integrations, wired end-to-end and tested against live APIs rather than assumed from documentation:
- TideCheck API for real tidal data behind the planting-window feature.
- Copernicus Data Space Ecosystem (Sentinel Hub Statistical API) for real Sentinel-2 satellite imagery, used to compute an actual historical NDVI comparison for the exact polygon the user drew.
- Groq API (Llama/OpenAI-OSS models, OpenAI-compatible tool-calling) powering a genuine AI agent: the model decides on its own when to call the tide-data tool and the cost-calculator tool before writing the final SOP, rather than following a hardcoded template. The species-zoning engine is a transparent, rule-based model grounded in mangrove zonation literature — not a black-box ML model — because we felt an honest, explainable method mattered more than an inflated "AI" claim for a tool that field teams need to trust.
Challenges we ran into
Every external integration had a real bug we only found by testing against the live API instead of trusting the docs:
- TideCheck's tide-condition field returns
"Neap"(capitalized) in production, while their own published documentation example shows lowercase"neap"— our first live test silently returned zero safe planting windows until we caught the mismatch. - The Sentinel Hub Statistical API interprets pixel-resolution parameters in the coordinate system's own units. We initially passed
10intending 10 meters, but our request used a geographic (degree-based) coordinate system, so it was read as 10 degrees — roughly 1,000 km per pixel — and rejected. Fixed by switching to the correct degree-scale value. - Our first cloud-masking pass only filtered out water pixels, not clouds — a sanity check against a known dense-forest location returned an implausibly low vegetation index (~0.1–0.3 instead of the expected ~0.5–0.8) until we expanded the mask to exclude cloud and cloud-shadow pixel classes too.
- Groq's model catalog changes frequently; our first chosen model had already been deprecated by the time we tested with a real API key, so we had to query the live model list to find one that actually supports tool-calling.
- Our AI agent's first drafts leaked internal implementation details (literally naming our backend function
calculate_rabinside the SOP text meant for non-technical field staff) — fixed by rewriting the system prompt to explicitly forbid mentioning tool or function names in the output.
Accomplishments that we're proud of
Every feature in the app is backed by real data or real computation, not simulated for the demo — including a genuinely agentic AI workflow (the model itself decides which tools to call, verified by checking that the numbers in the generated SOP exactly match the numbers our calculators actually produced) and a real satellite-derived vegetation comparison for whatever site the user chooses, not a canned example. We also rebuilt the entire UI copy from the ground up to read like a finished, professional product rather than a research prototype explaining its own internals.
What we learned
Documentation for real-world APIs is a starting point, not a guarantee nearly every integration in this project had a live-behavior mismatch versus its official docs, and the only way to catch that was to actually call the API with real credentials before shipping. We also learned that prompt-engineering an AI agent for a non-technical audience takes as much care as engineering the tools it calls an agent can be technically correct and still produce output that undermines user trust if it exposes implementation details it was never asked to hide.
What's next for BlueZone AI
Replacing the demo's placeholder mangrove-extent layer with a real Global Mangrove Watch export, deploying to Vercel for a public live demo, adding true live satellite-monitoring scheduling that automatically checks in at the 3/6/12-month marks, and extending support to multiple restoration sites in parallel for NGOs managing several locations at once.
Built With
- copernicus-data-space-ecosystem
- groq
- jspdf
- next.js
- react
- react-leaflet
- react-markdown
- sentinel-hub
- tailwind-css
- tidecheck-api
- typescript

Log in or sign up for Devpost to join the conversation.