-
-
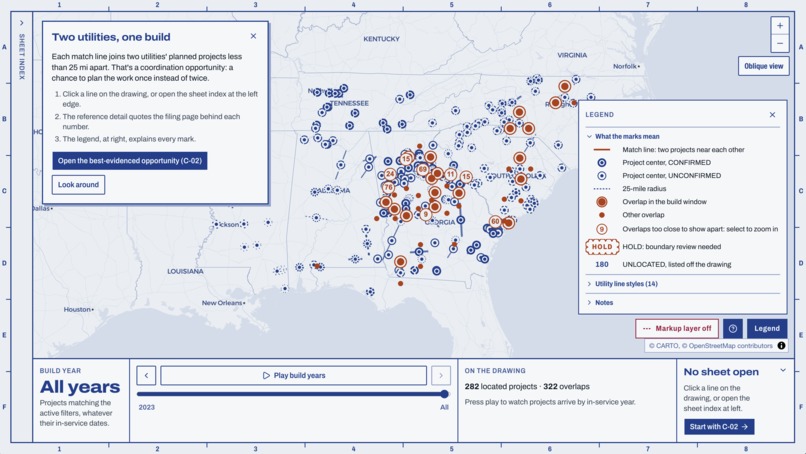
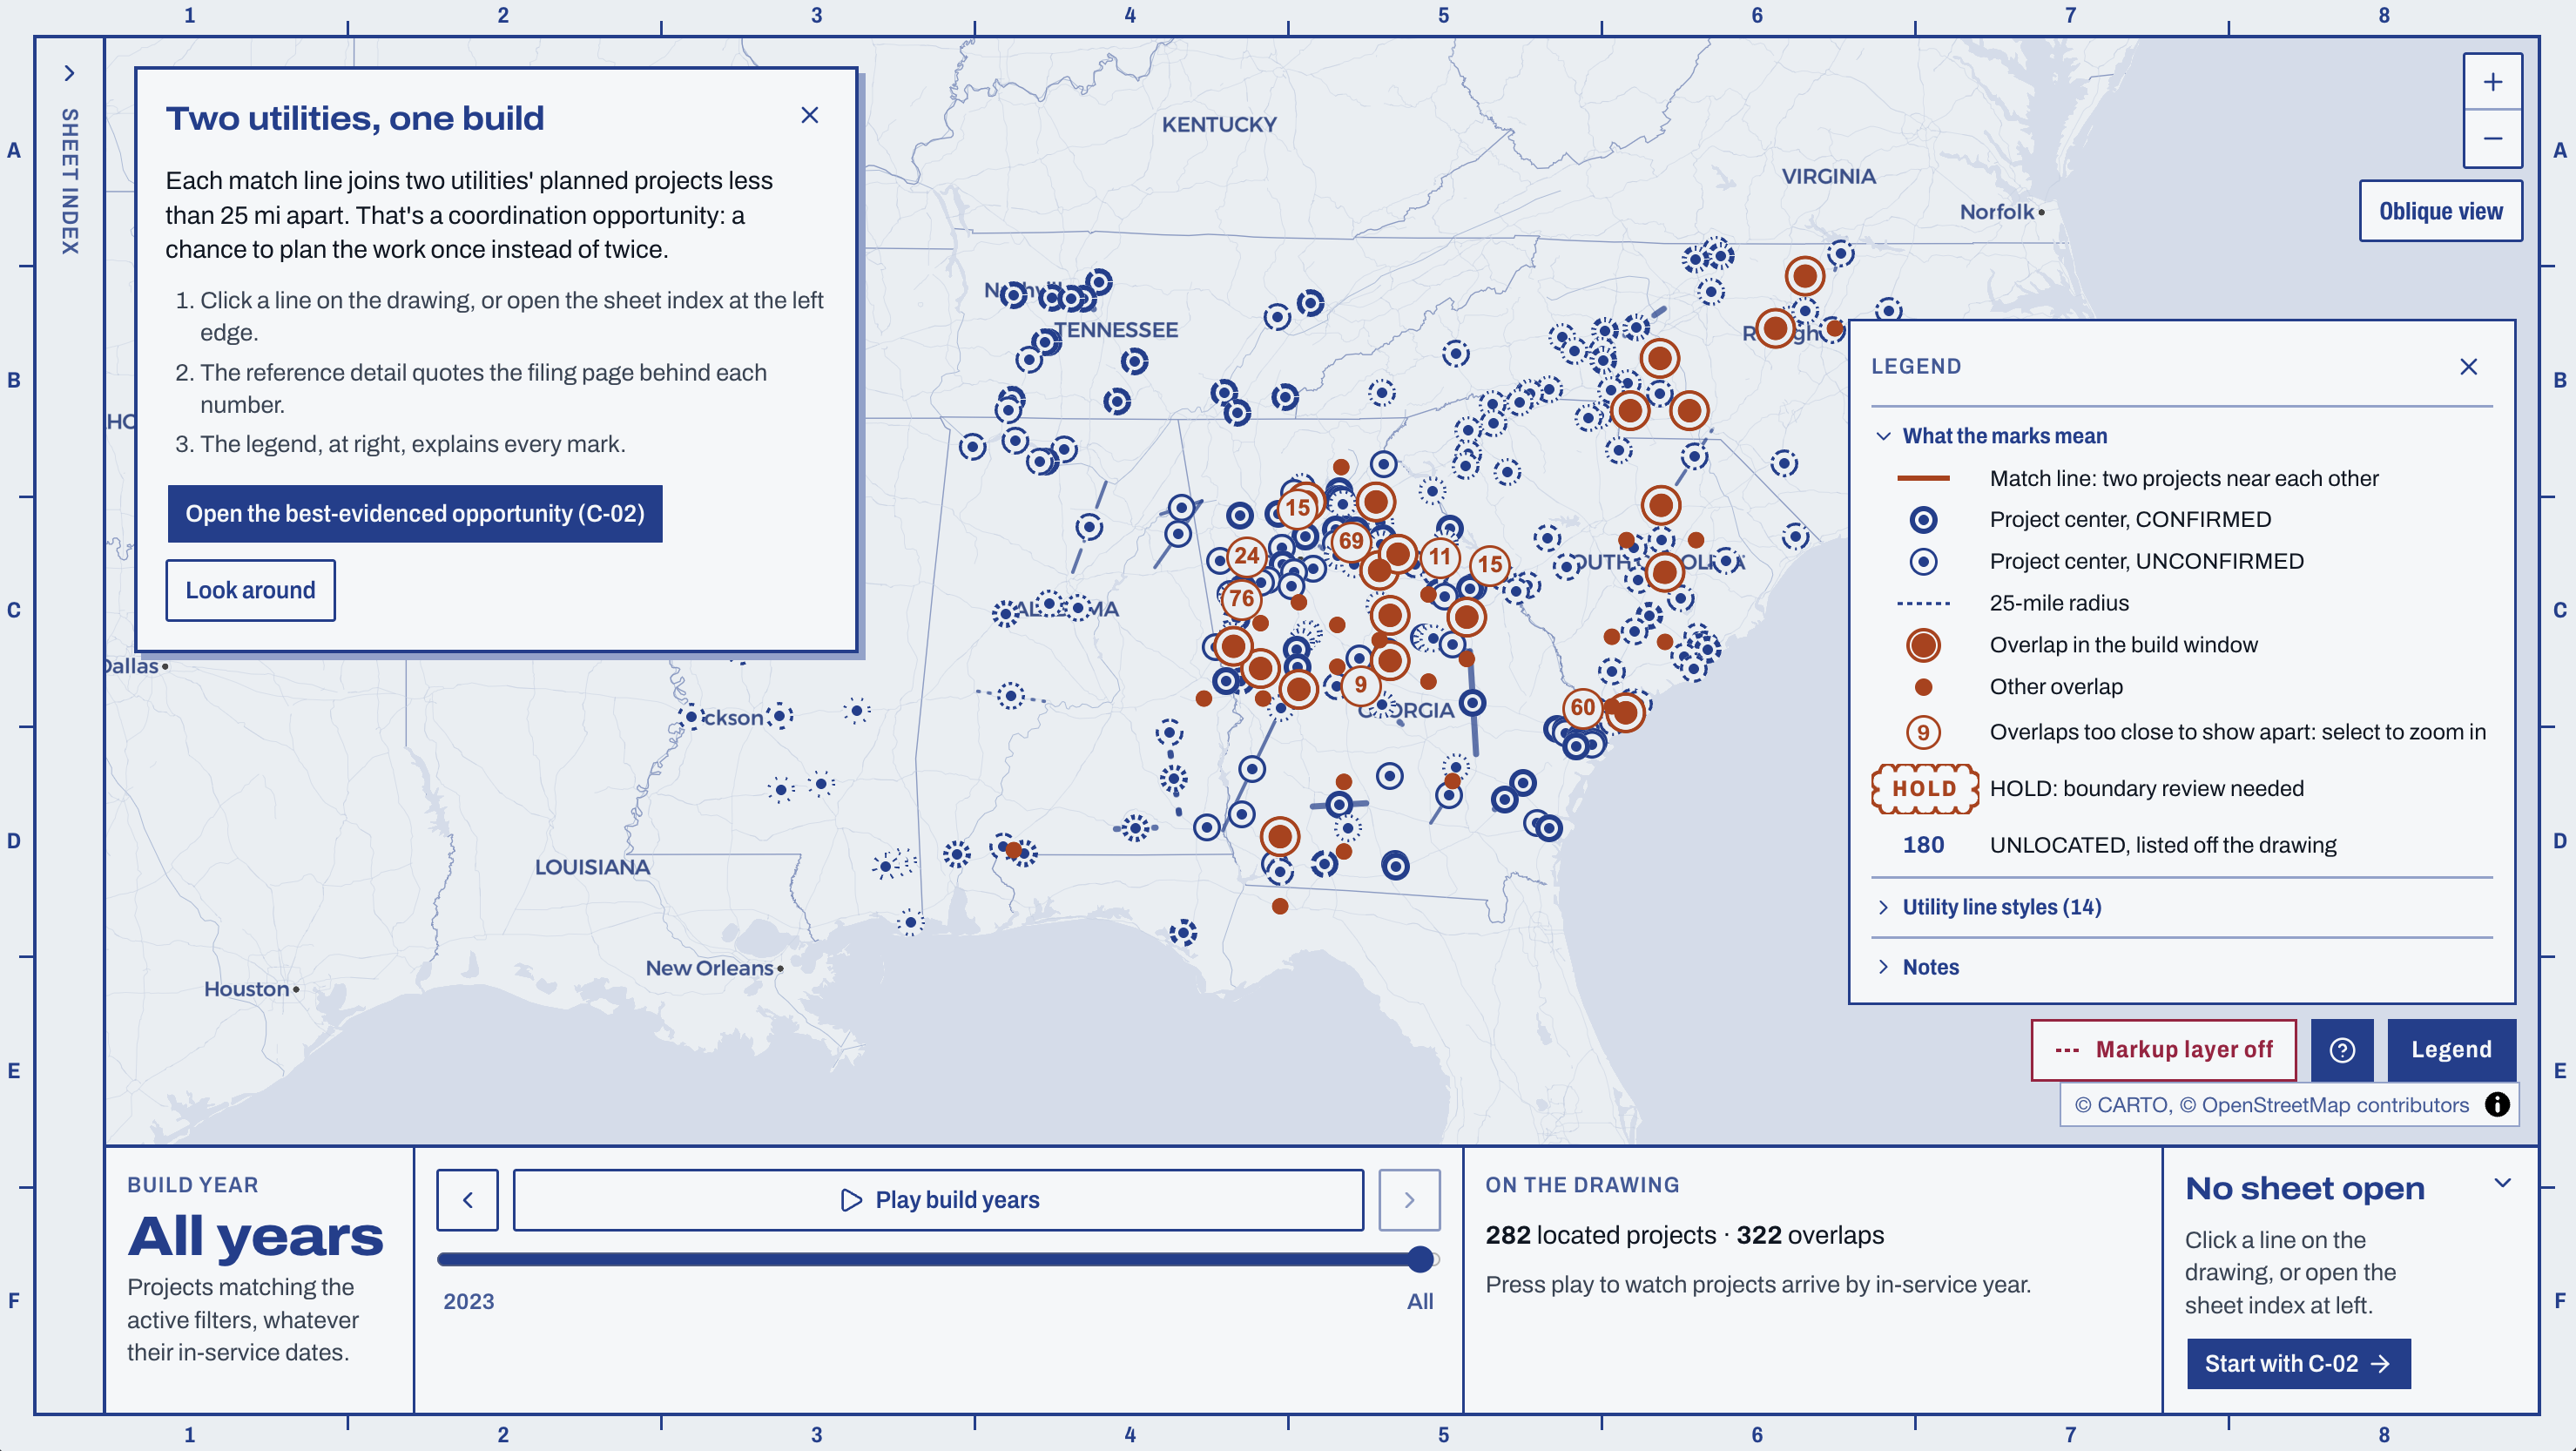
A view of the initial blueseam landing page.
-
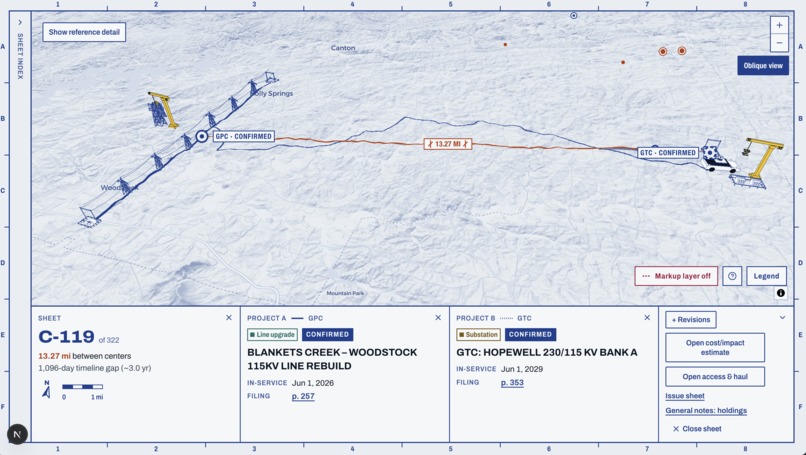
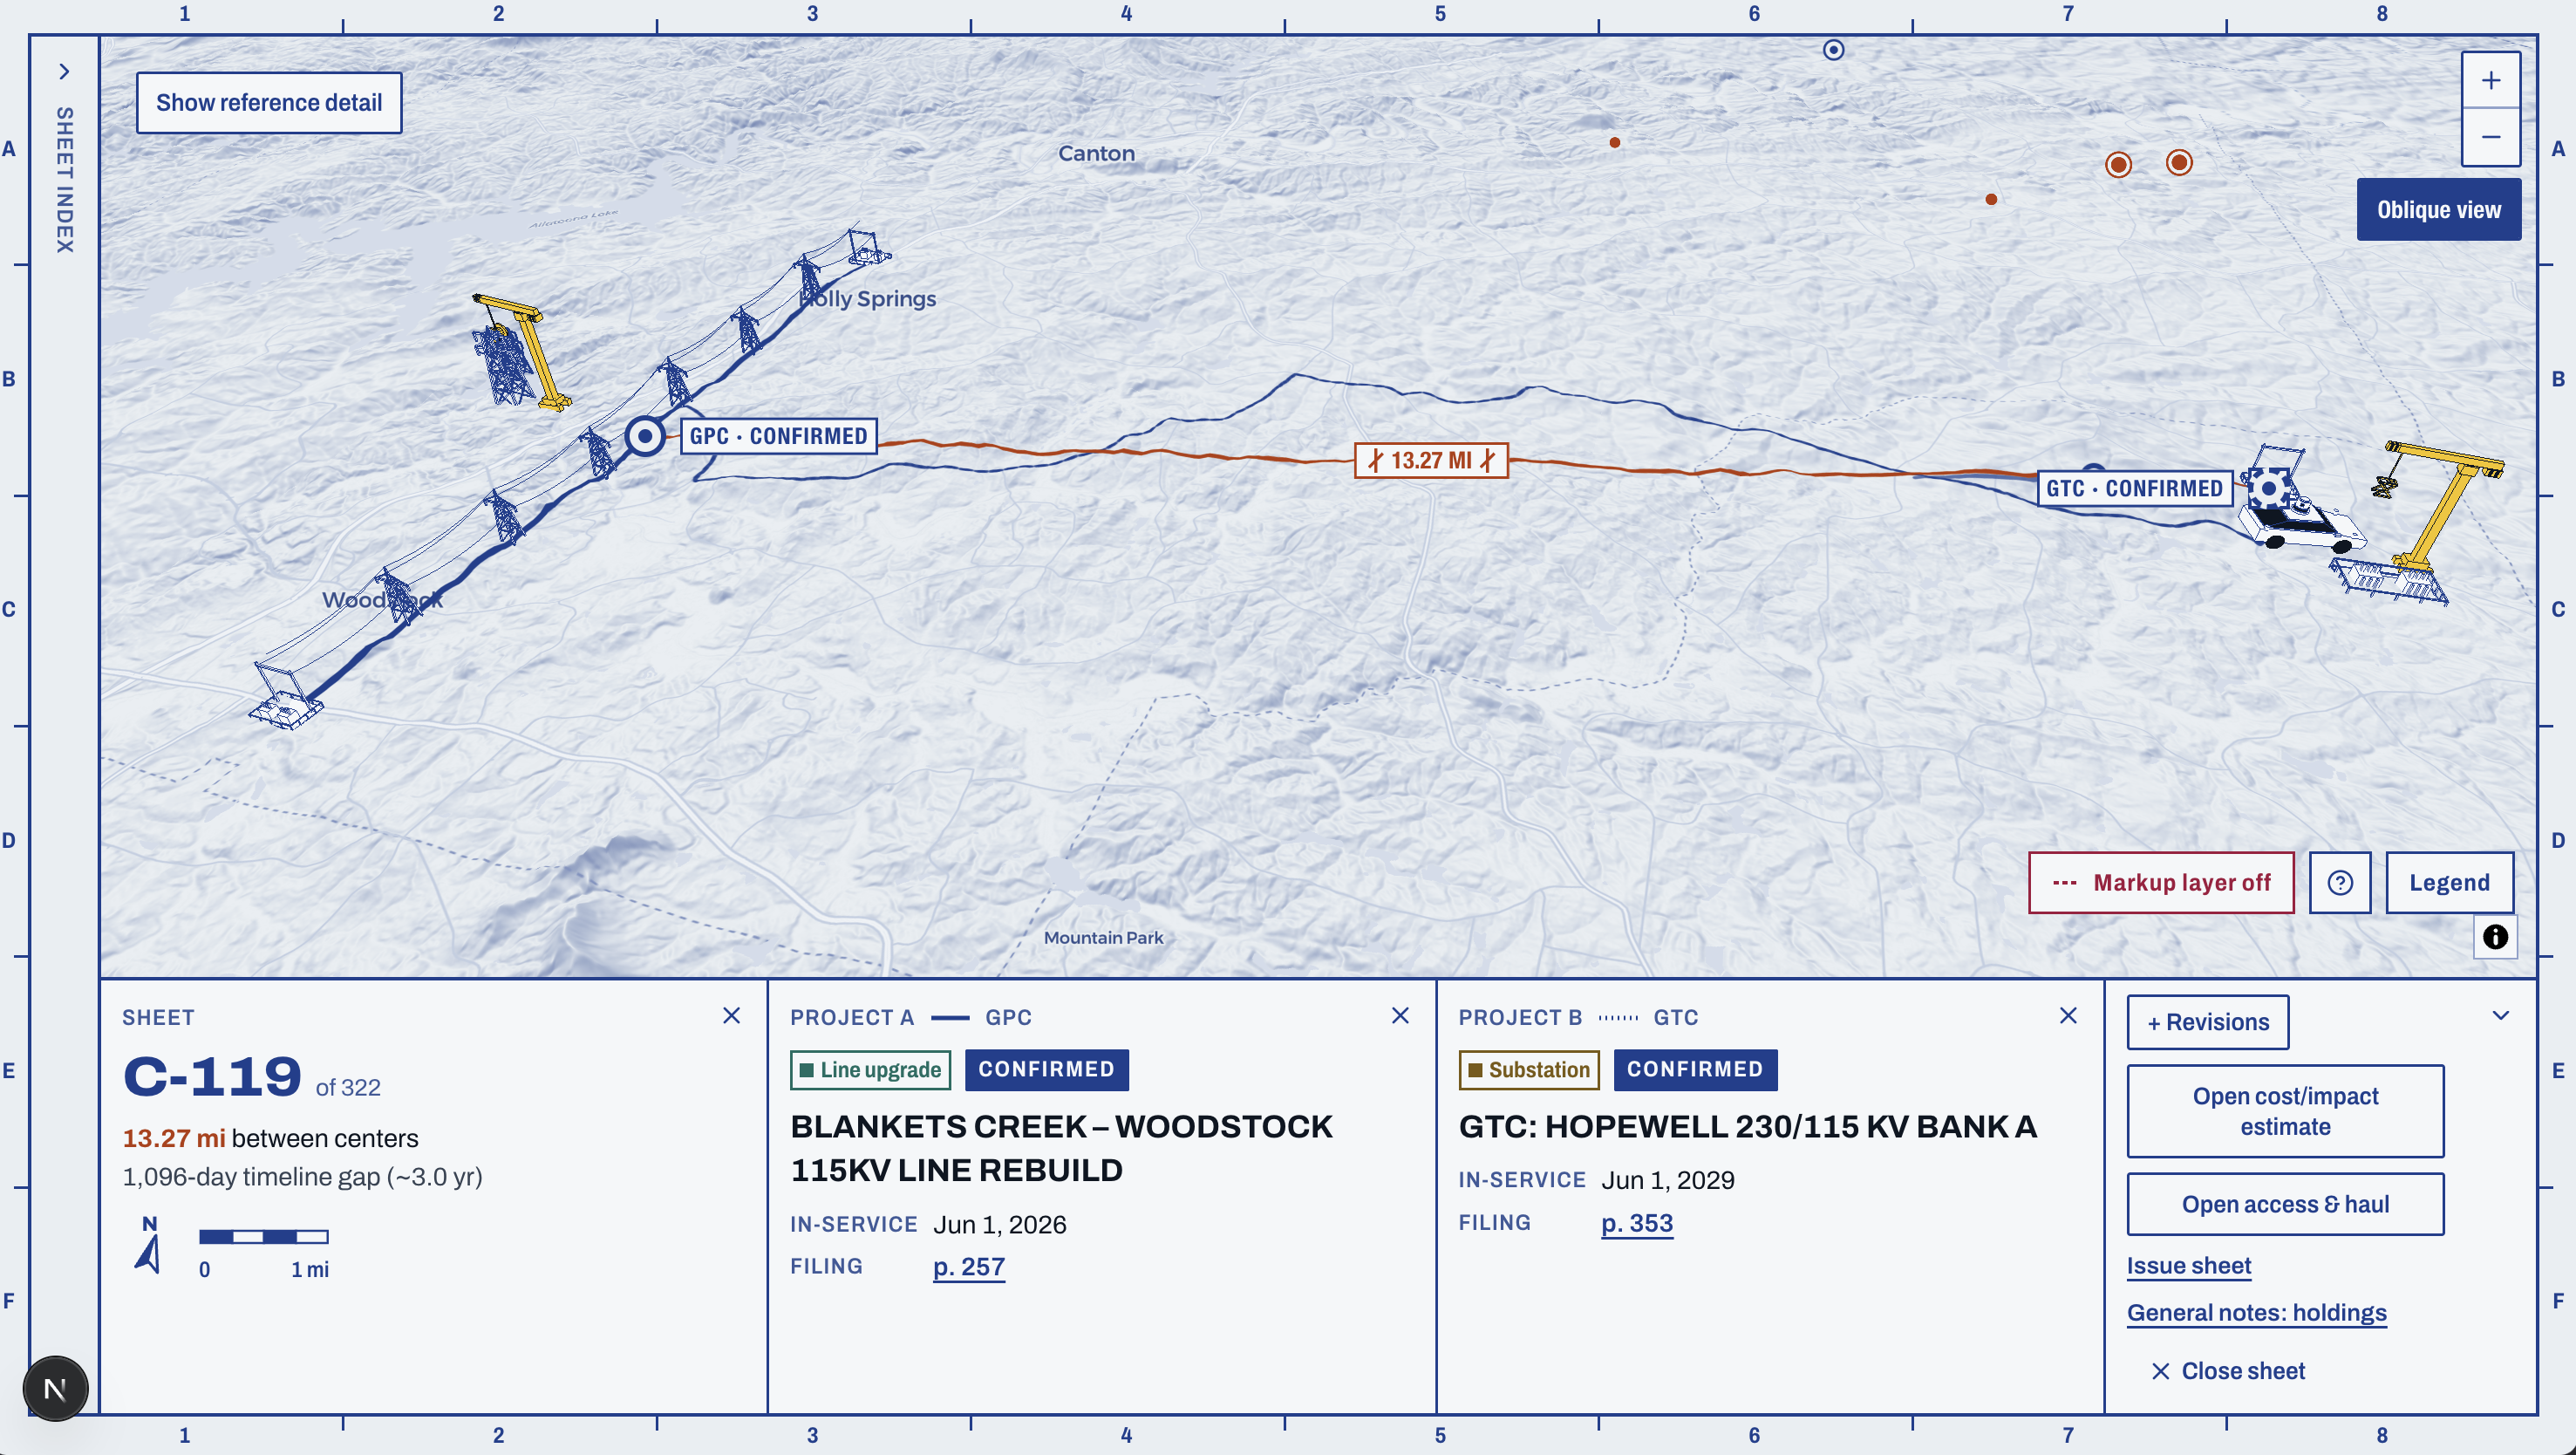
The oblique view showcases the topology of the area, rendering models in three.js to represent various types of projects.
-
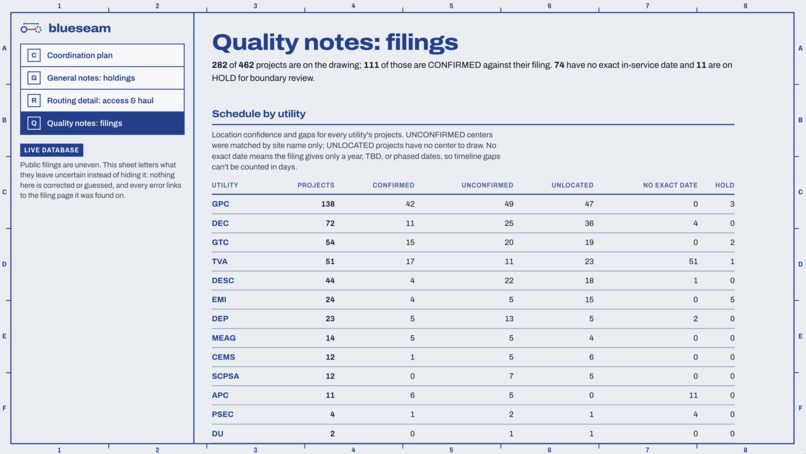
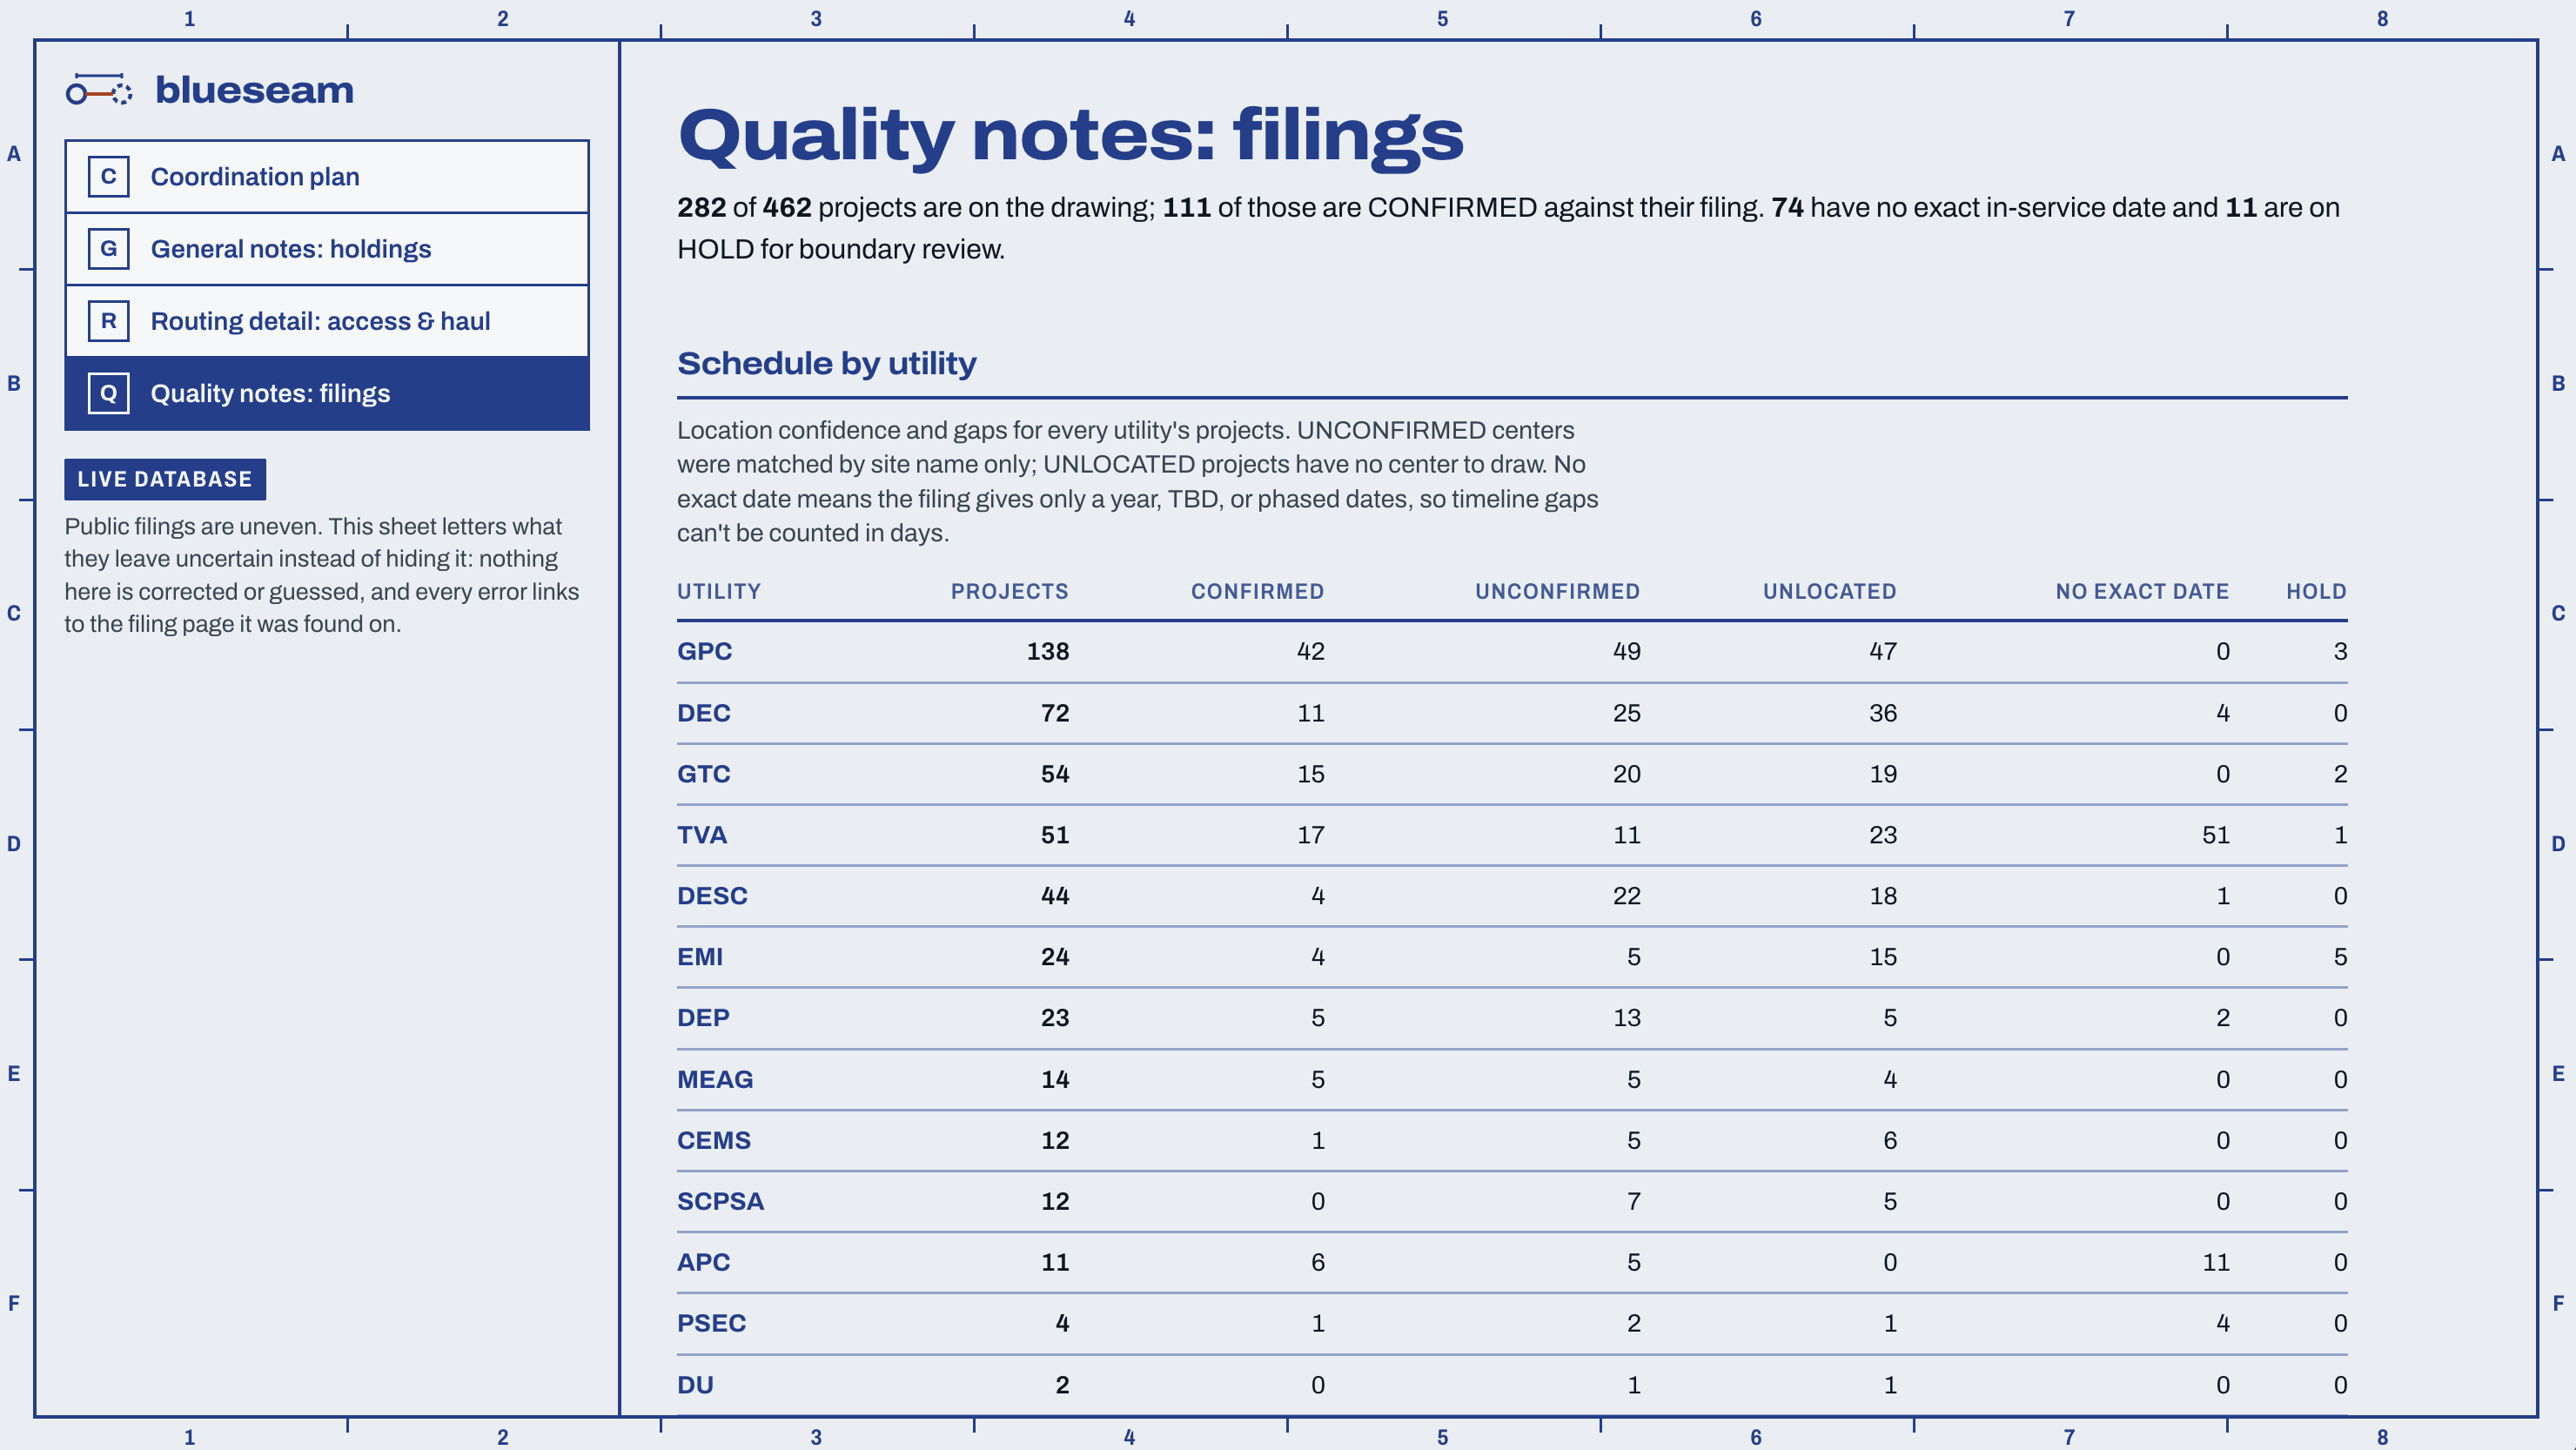
Verify the data by looking at the quality report.
-
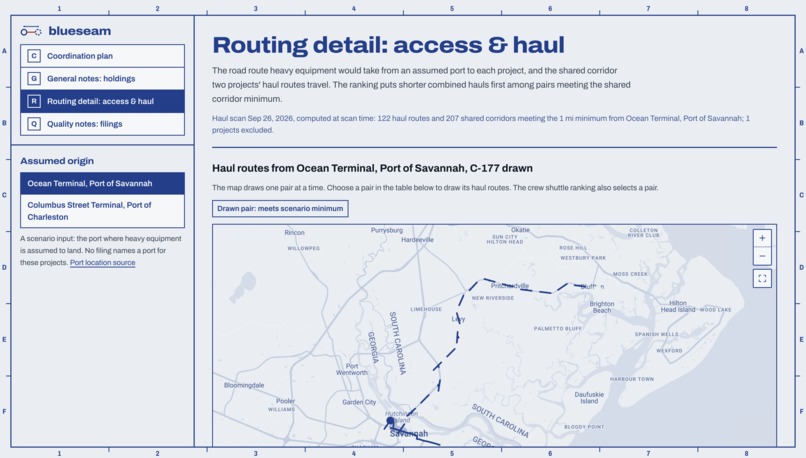
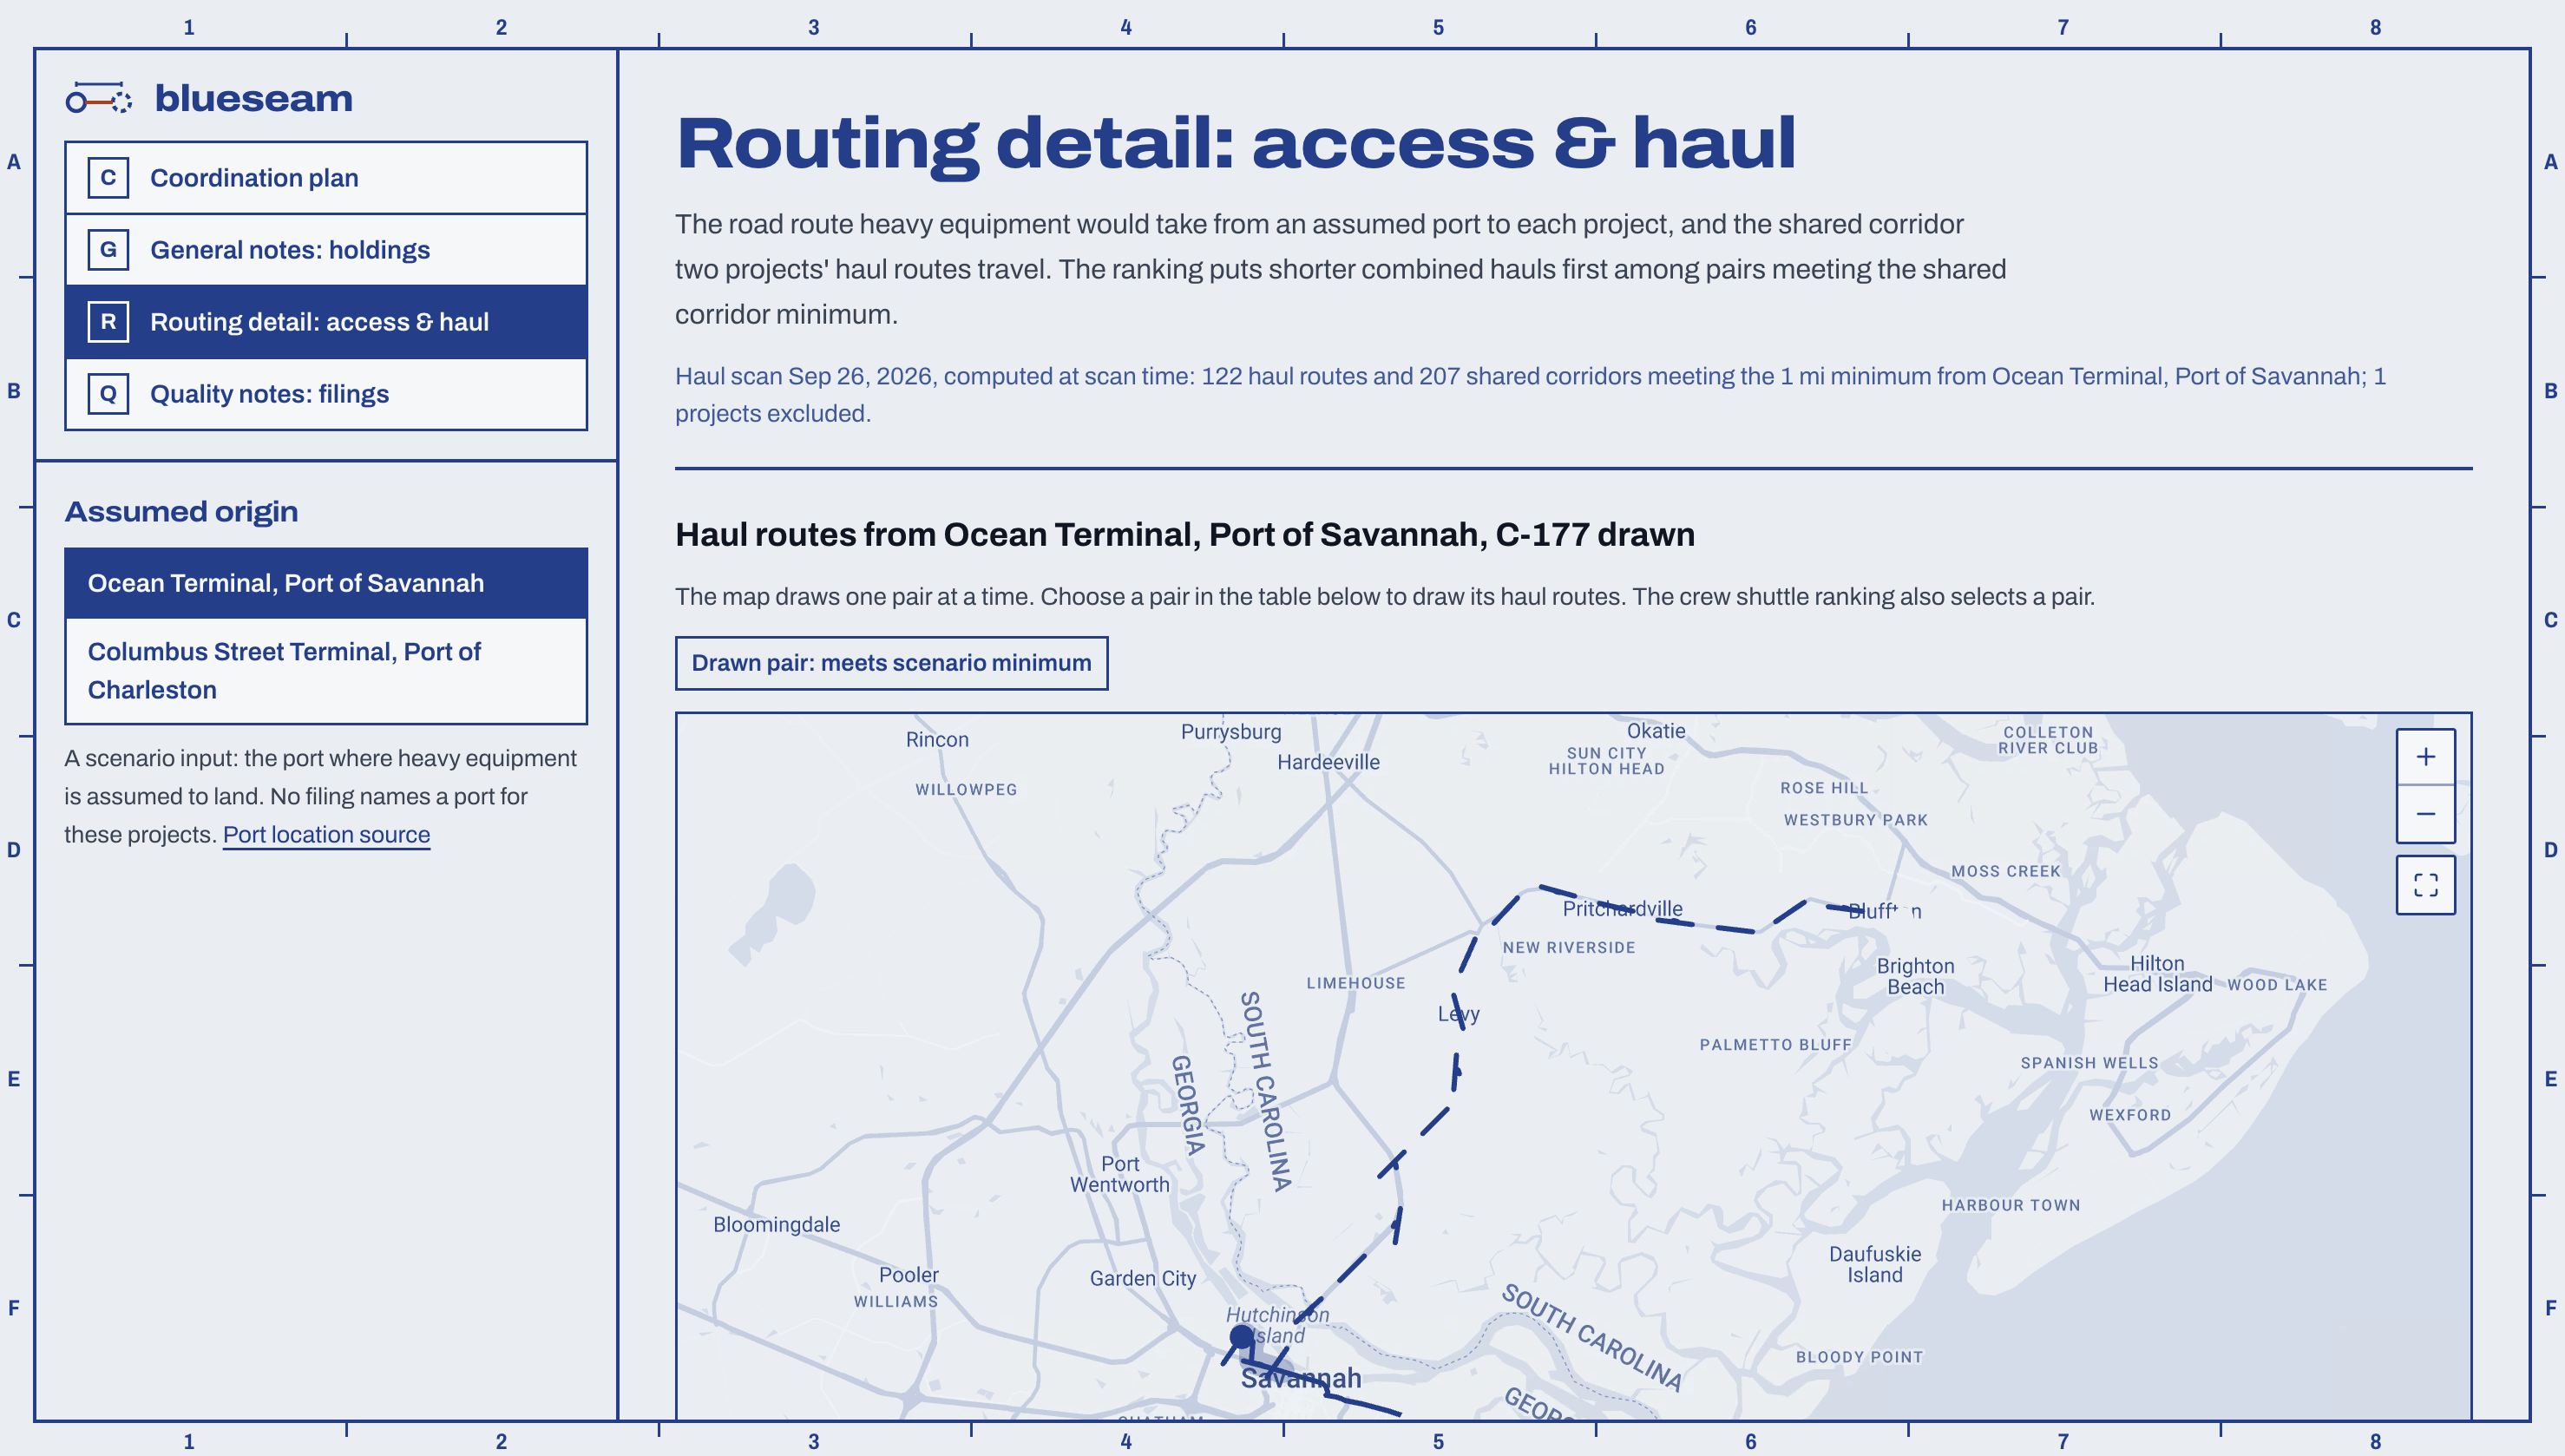
See routes from the nearest ports that cover various working sites.
-
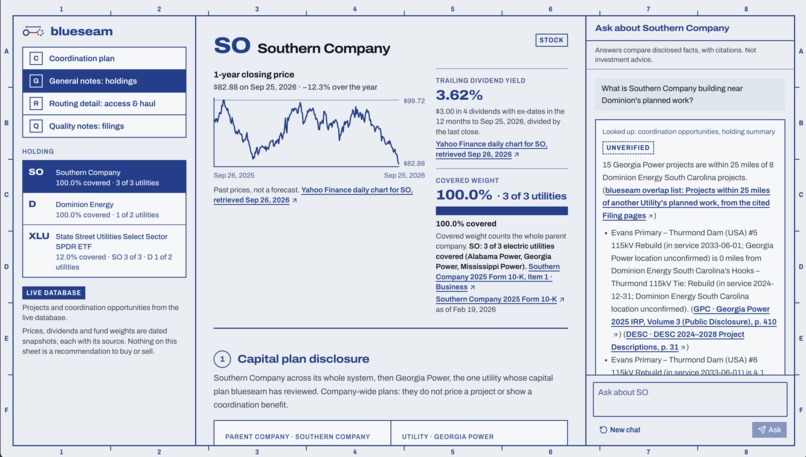
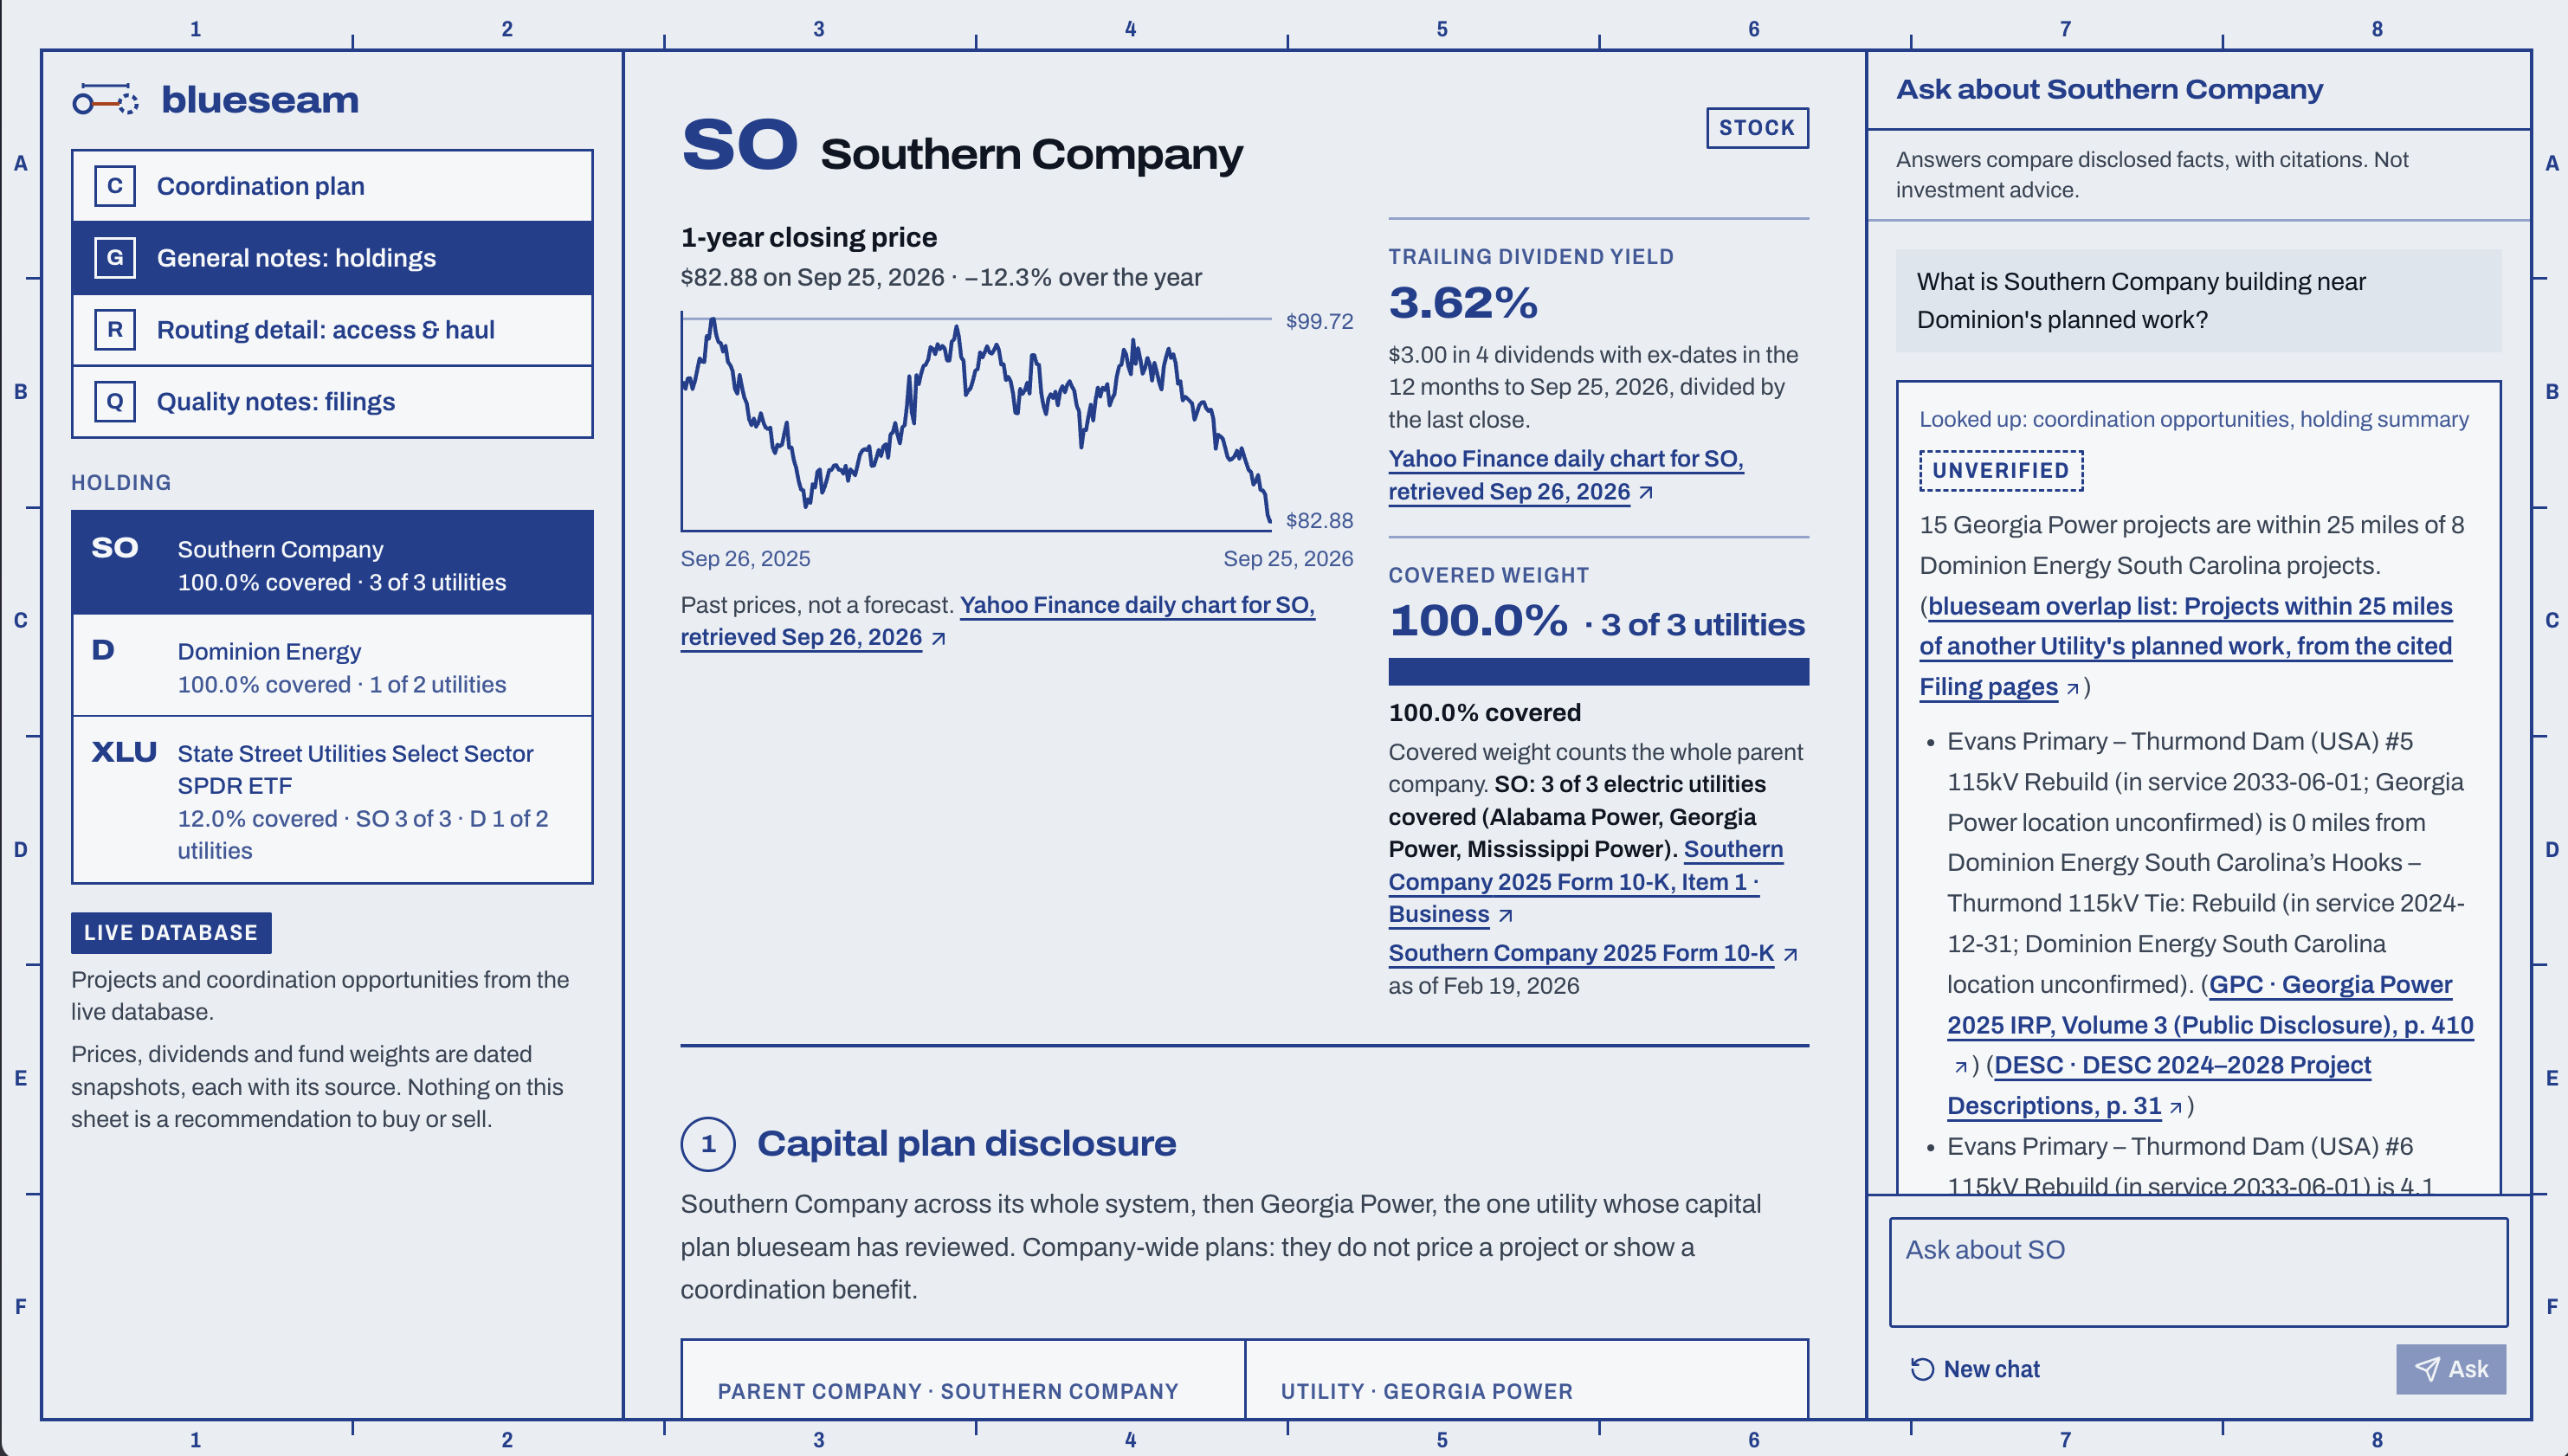
Users can chat with an AI agent about the various companies building public utilities.
Inspiration
Neighboring electric utilities plan their transmission upgrades separately. Two crews can end up clearing land and hauling transformers a few miles apart, a few months apart, and neither utility knows about the other. FERC Order No. 1920 now pushes utilities to plan regionally, but the details are buried in long PDF filings that nobody has time to compare line by line. Sperry Tech's Gridlock challenge asked us to fix that using only public data. Our test case was Georgia Power and Dominion Energy South Carolina, which meet along the Savannah River.
What it does
blueseam reads two utilities' public transmission filings, locates each project and flags any pair whose centers are less than 25 miles apart. It then ranks those overlaps as coordination opportunities.
The main screen is a map of both utilities' projects with the overlaps highlighted, next to the ranked list. The list is where a planner actually works; the map is there to orient them. Each opportunity shows the distance between centers, the gap between in-service dates, how confident we are in the location, and a rough cost/impact estimate. The planner can edit that estimate, and it's always labeled as a scenario.
Every center, overlap and boundary review links back to the exact filing page it came from. When we can't locate a project, or aren't sure of its location, the app says so instead of hiding it.
We also built two views on the same data:
- Access & haul: uses Google Maps routes from an assumed port to show whether two projects' transformer hauls could share road. Pairs are ranked by shortest combined haul and by miles of shared corridor.
- Investor view: for people holding Southern Company, Dominion or XLU. It shows price, dividend yield, capital plan and 10-K risk disclosures next to the utility's planned projects. A citation-checked agent answers questions about them, and it won't tell anyone to buy or sell.
The live dataset has 462 projects and 259 overlaps.
How we built it
- Pipeline: a Python 3.12 pipeline (uv) pulls projects out of the DESC and Georgia Power IRP PDFs with pypdf. It geocodes endpoints through OpenStreetMap/Overpass, computes centers and haversine overlaps, and ranks them.
- Boundary reviews: models on Vercel AI Gateway propose boundary reviews, each backed by a verbatim quote from the filing. A person accepts or rejects each one, and the ranking recomputes live.
- Web app: Next.js 16, React 19, Tailwind 4, shadcn/ui and MapLibre (via mapcn). We styled it after an engineering plan set, with a sheet index, a title block and a blueprint theme.
- Data: Postgres on Railway, accessed through Prisma 7, is the shared contract between the pipeline and the web app.
- Agent: the investor agent runs on Vercel eve. A route handler on the Railway app proxies it, so the agent never has a public endpoint.
- Repo: everything lives in a pnpm and Turborepo monorepo. One set of quality rules (oxlint, oxfmt, ruff) runs in git hooks, agent hooks and CI.
Challenges we ran into
Filings name substations and line endpoints, not coordinates. Plenty of projects came out unlocated or unconfirmed. Instead of guessing, we added location confidence, boundary reviews and a HOLD state.
We also had to keep the estimates honest. An in-service date doesn't prove two crews will be working at the same time, and an assumed shared length isn't an easement. We kept a strict vocabulary so that a scenario never reads like a fact.
With hundreds of DOM markers, the map got sluggish. Drawing projects and overlap midpoints as GPU-rendered layers fixed that.
Google Maps' terms only allow route data on a Google map, and its routing is for passenger cars, not permitted truck routes. We designed the haul view around both limits.
Accomplishments that we're proud of
A planner can check the top opportunity against its source filing in one click, because every claim in the app links back to a filing page. We confirmed 104 project locations and located 83 more endpoints through agent searches that a person then reviewed. The same product answers three sponsor briefs (grid planning, transport logistics and investor research) while keeping the main coordination ranking unchanged. We also borrowed the look of real plan sets, aimed for WCAG 2.2 AA, and never show utility, confidence or status by color alone.
What we learned
Planners trust a map that admits "we don't know where this is" more than one that quietly guesses. A single glossary, shared by the code, the UI and the team, saved us from a lot of bugs and arguments. AI worked best for us when it proposed an answer with a citation and a person made the final call.
What's next for blueseam
- Locate projects across whole states and add more utility pairs across the Southeast.
- Estimate overlaps and shared right-of-way from reviewed route geometry instead of center points.
- Replace passenger-car routing with permitted heavy-haul routes.
- Pilot blueseam with a transmission planning team to check the cost/impact defaults against real coordination decisions.
Built With
- next.js
- postgresql
- python
- react
- three.js
- webgpu


Log in or sign up for Devpost to join the conversation.