-
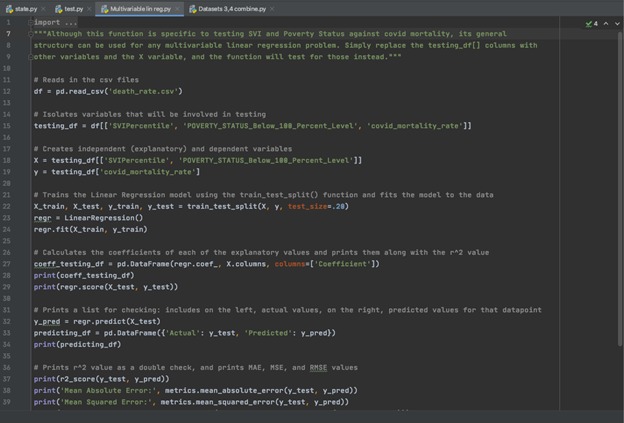
Use of Python in Pycharm IDE with reliance on matplotlib, sklearn, and pandas
-
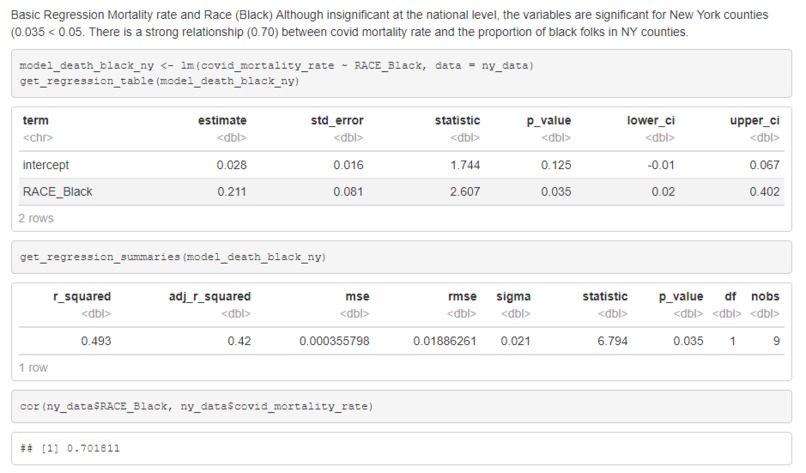
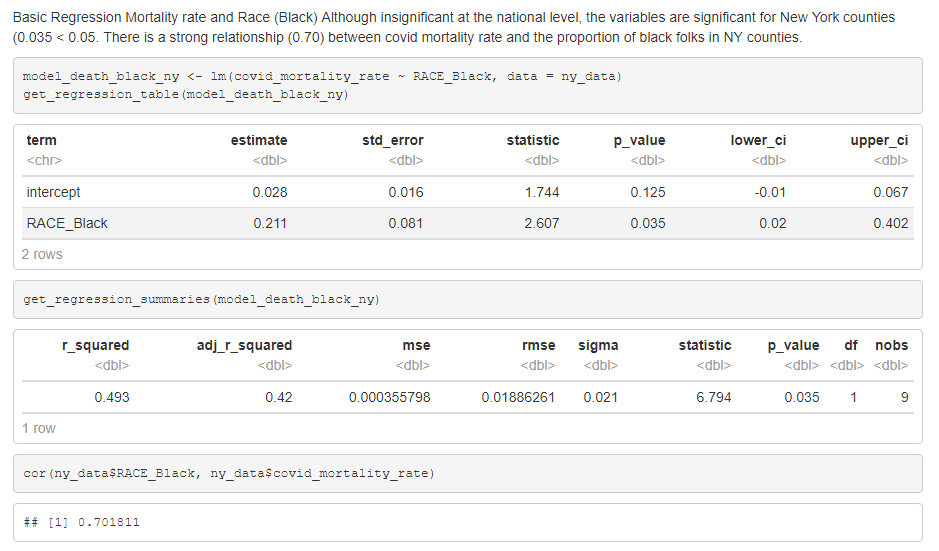
Use of R in RStudio with reliance on ggplot, dplyr, and moderndive libraries to complete regression analysis
-
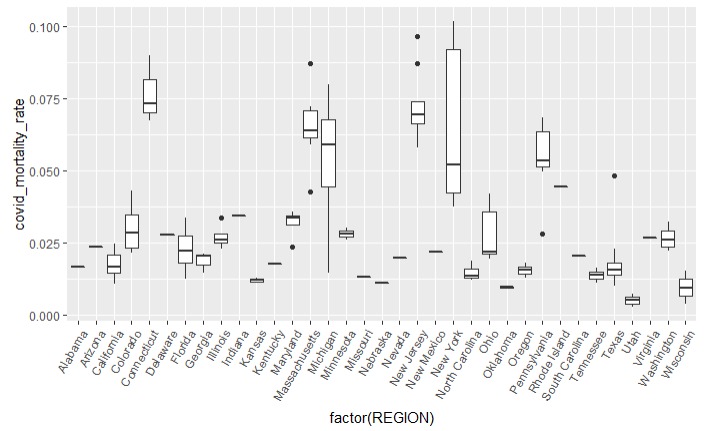
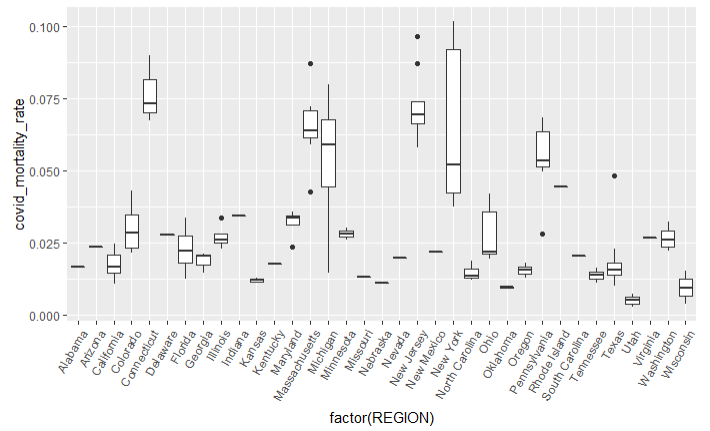
Spread Covid-19 Mortality Rates across states
-
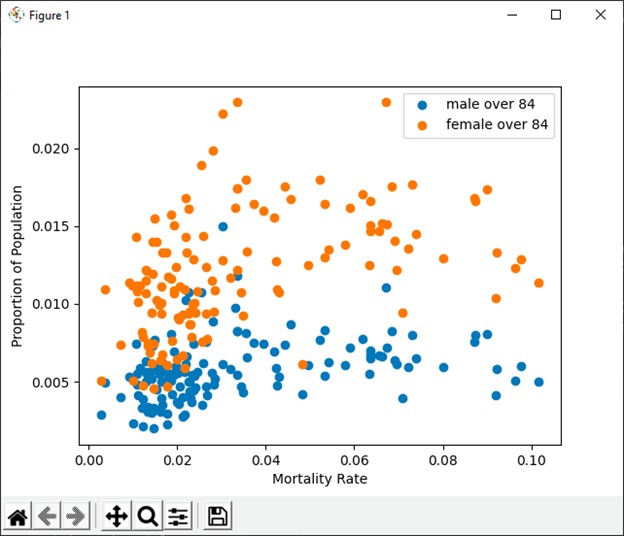
Mortality rate of males and females over 84 and Proportion of the Population
-
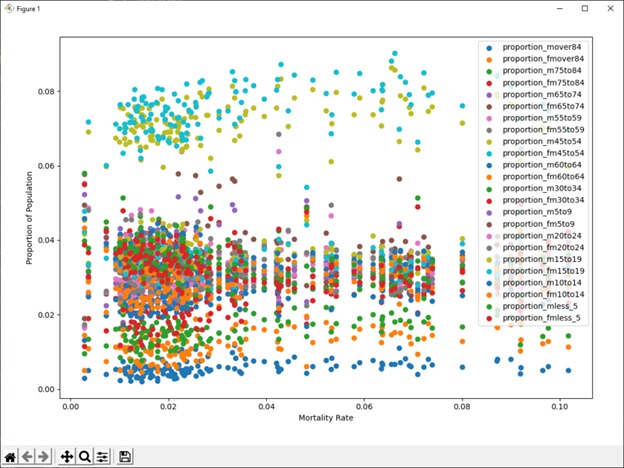
Scatterplot of population group distribution by mortality rate, created with matplotlib in Python.
-
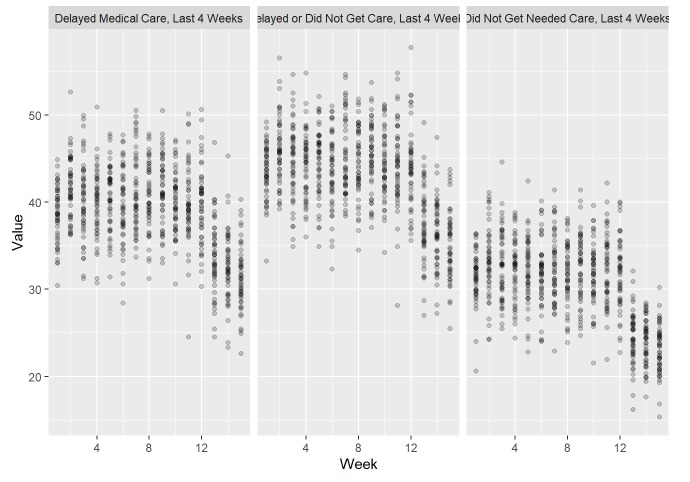
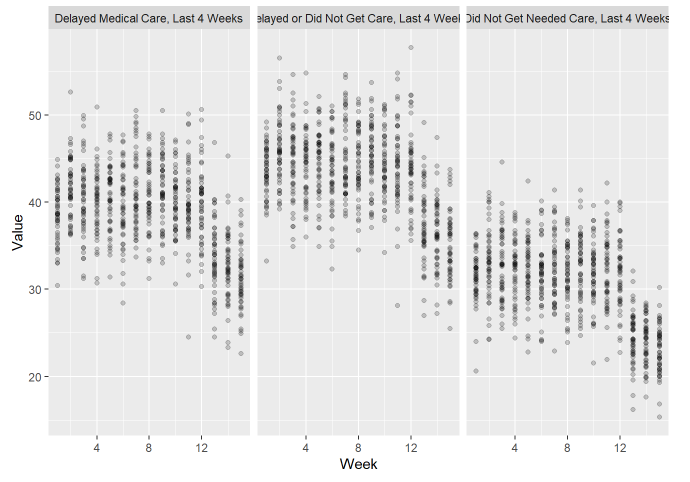
Scatterplot of Survey Responses of Reduced Access to Healthcare Indicators from April 23rd to September 28
-
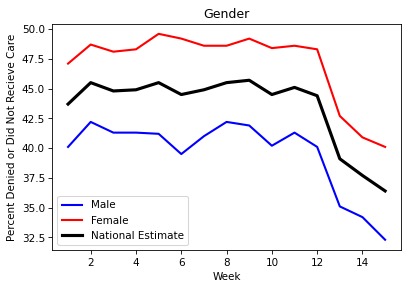
Line graph of Survey Responses of Reduced Access to Healthcare Indicators from April 23rd to September 28


Links to our Project Presentation and Github page are below
Presentation: https://docs.google.com/presentation/d/1s2_quKadB4HLhz5D4pQ50wVeVILXMY8dkPjr56sW_Dw/edit?usp=sharing
Github: https://github.com/trey-capps/BlueprintDatathon
Abstract:
While COVID-19 has infected millions of Americans, there is no doubt that its effects have disproportionately targeted specific groups. Using data aggregated from counties and states across the U.S., we look to test a collection of key variables and their relationship with mortality rates: Age, Race, Income/Poverty Rating, and Language. Analysis was conducted in Python with the pandas, matplotlib, and scikit-learn libraries as well as R using packages including ggplot2, dplyr, and moderndive.
We aim to answer the following questions: How have different factors contributed to disparities in outcomes between different groups because of COVID-19? How will these disparities further progress as COVID-19 continues? What factors relate to reduced medical care access?
Methods:
Languages used: Python and R
Analysis Methods: Basic Regression and Multivariate Regression, Visualization Interpretations
Variables Examined in the following contexts:
How do these variables relate to Covid-19 national and county level mortality rate: Race, Language, Income, Poverty, Age, and Gender
How do these variables relate to Reduced Access to Medical Care Across subgroups: Gender, Age, Race, Education level
Conclusions:
Covid-19 Mortality Rate Predictors Nationwide Level: Not many significant predictors of covid-19 mortality rate; and Older age groups were able to predict mortality rate better than younger age groups Statewide Level: Variables, including race and ability to speak English, can predict mortality rate at the state level
Limitations
Use of linear models and hyper-focused analysis in state counties. Larger selection of counties for each state would help improve these models. Some predictors (including age) may show a nonlinear relationship. Lacked ability to analyze nonlinear regression to determine improved models for these predictors. Inconsistencies in number of state counties reported. For instance, California: 16 counties reported; Michigan: 4 counties reported; New York: 9 counties reported.
Built With
- matplot
- pandas
- python
- r
- scikit-learn


Log in or sign up for Devpost to join the conversation.