Inspiration
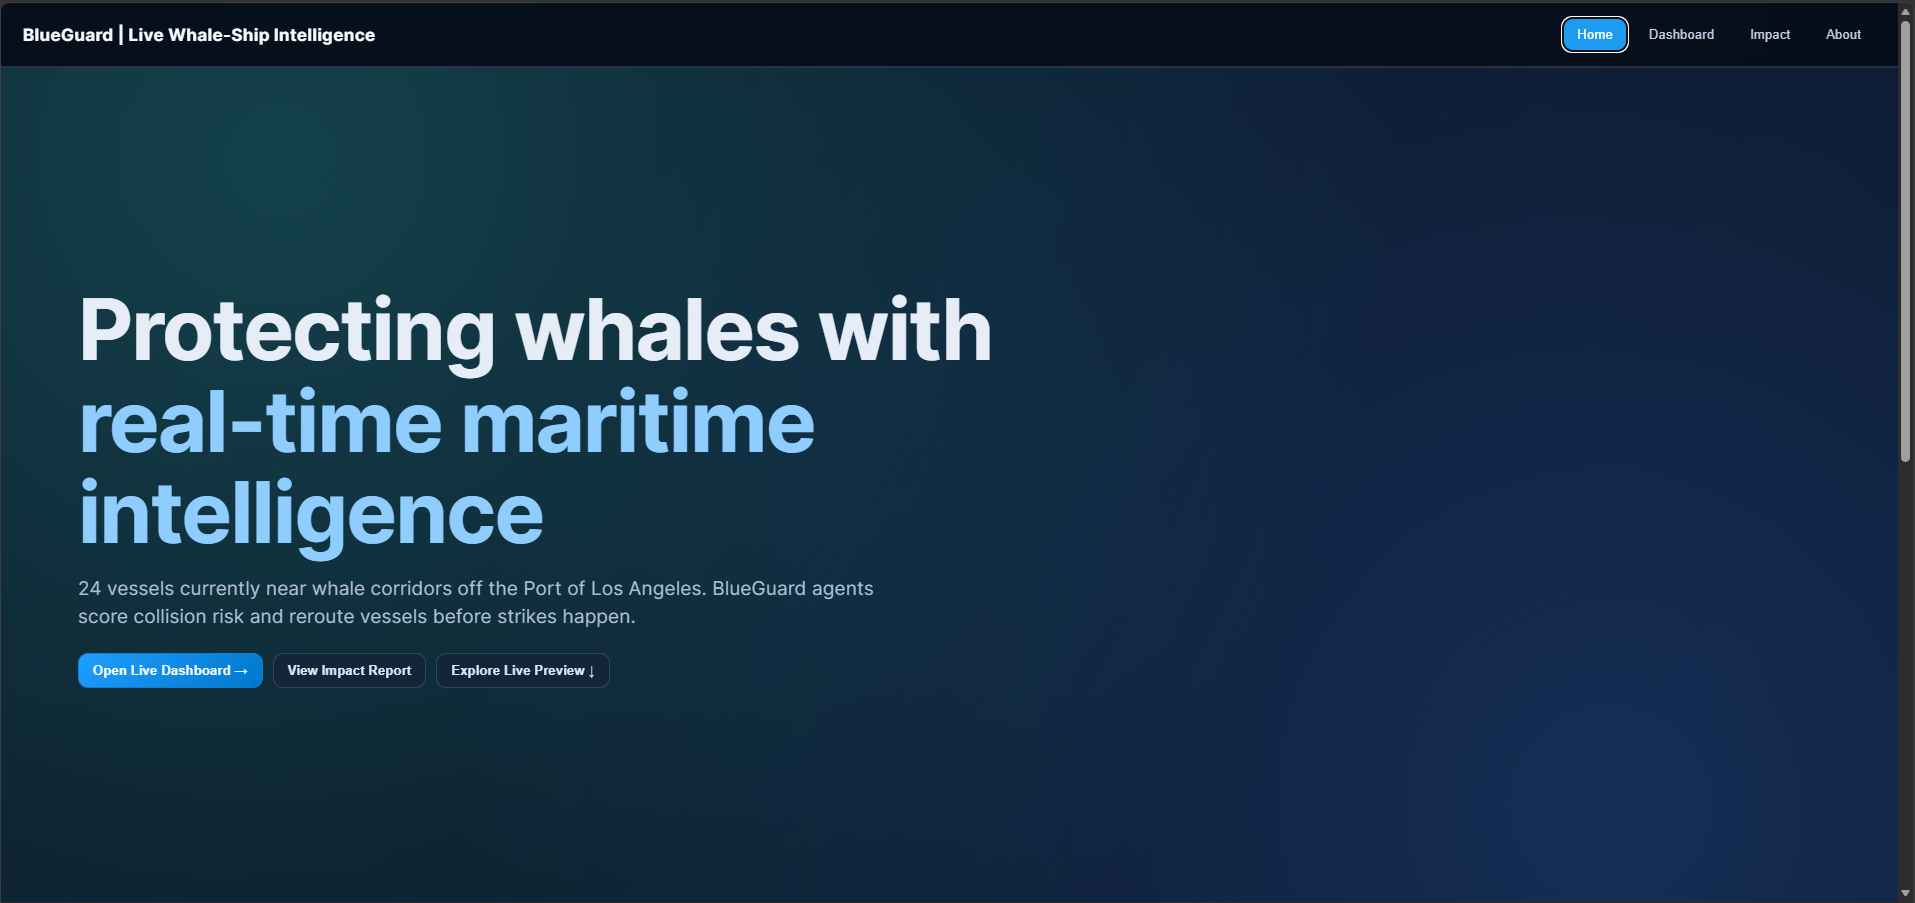
Whale–ship strikes sit at an uncomfortable intersection: endangered animals, billion-ton commerce, and routes drawn for fuel and time—not for biodiversity. Regulators and partners emphasize that slowing, shifting fairways, and better situational awareness can change outcomes. I built BlueGuard as a demo that answers a single operational question in a busy corridor (San Pedro / Port of Los Angeles): where are ships, where are whales, and where does risk concentrate right now?
What it does
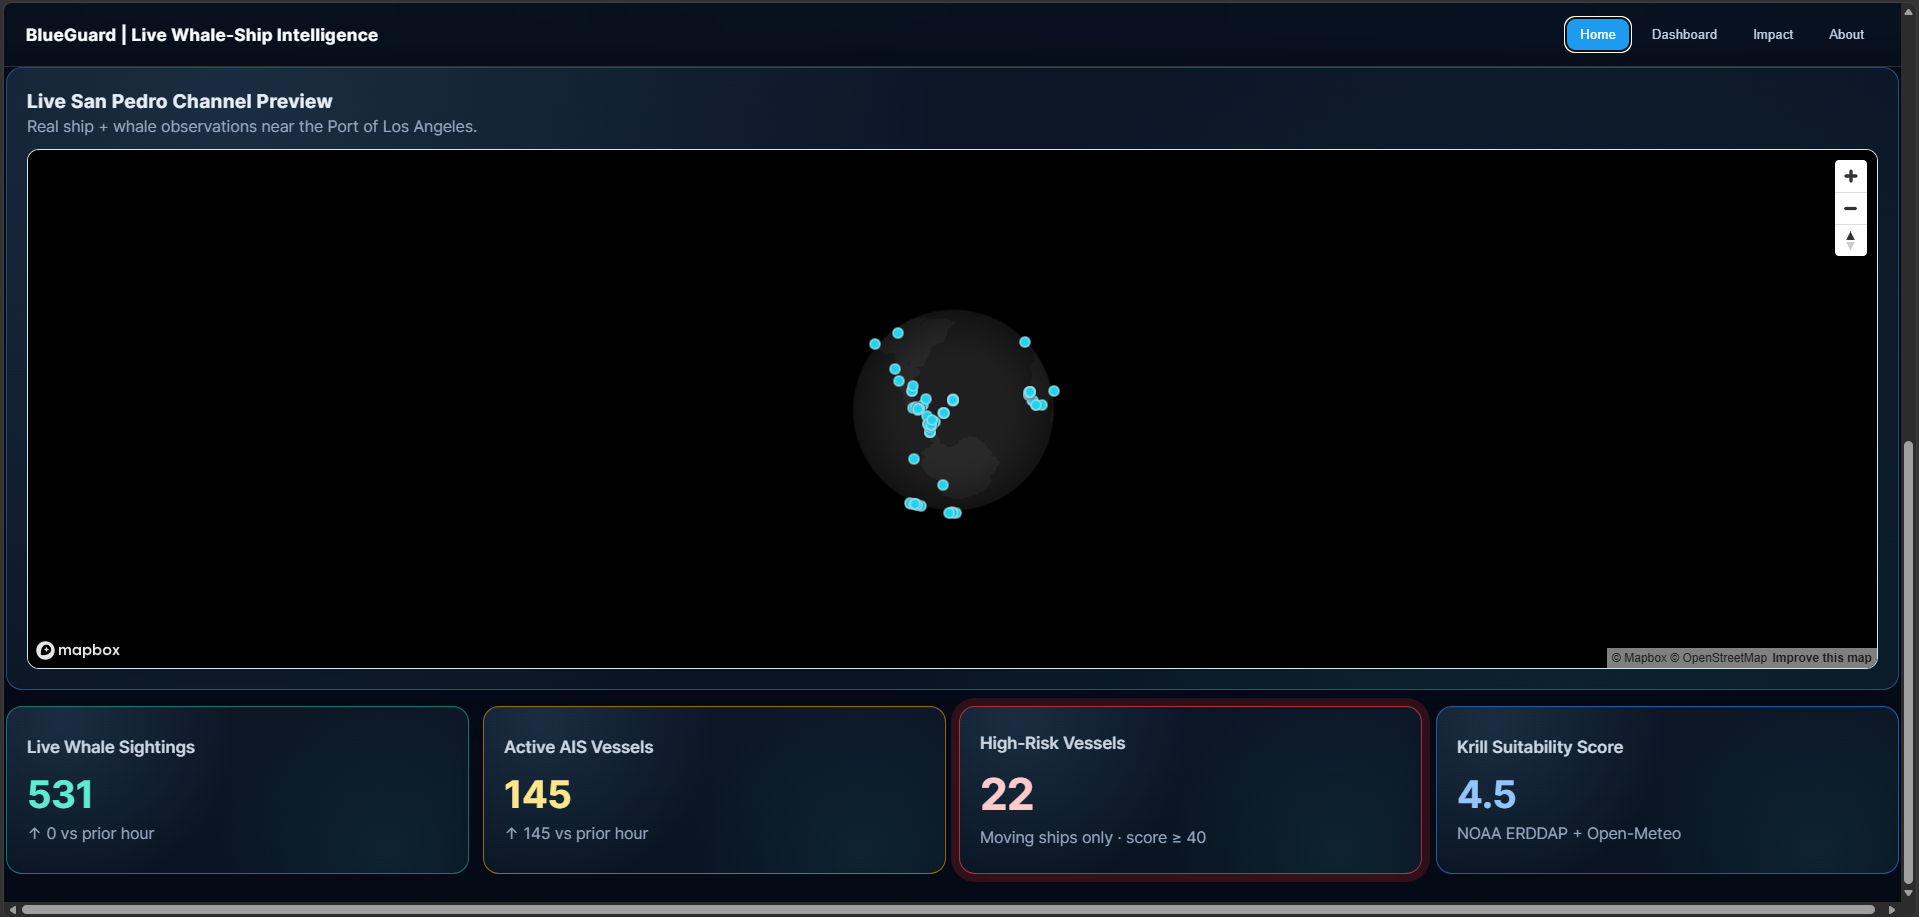
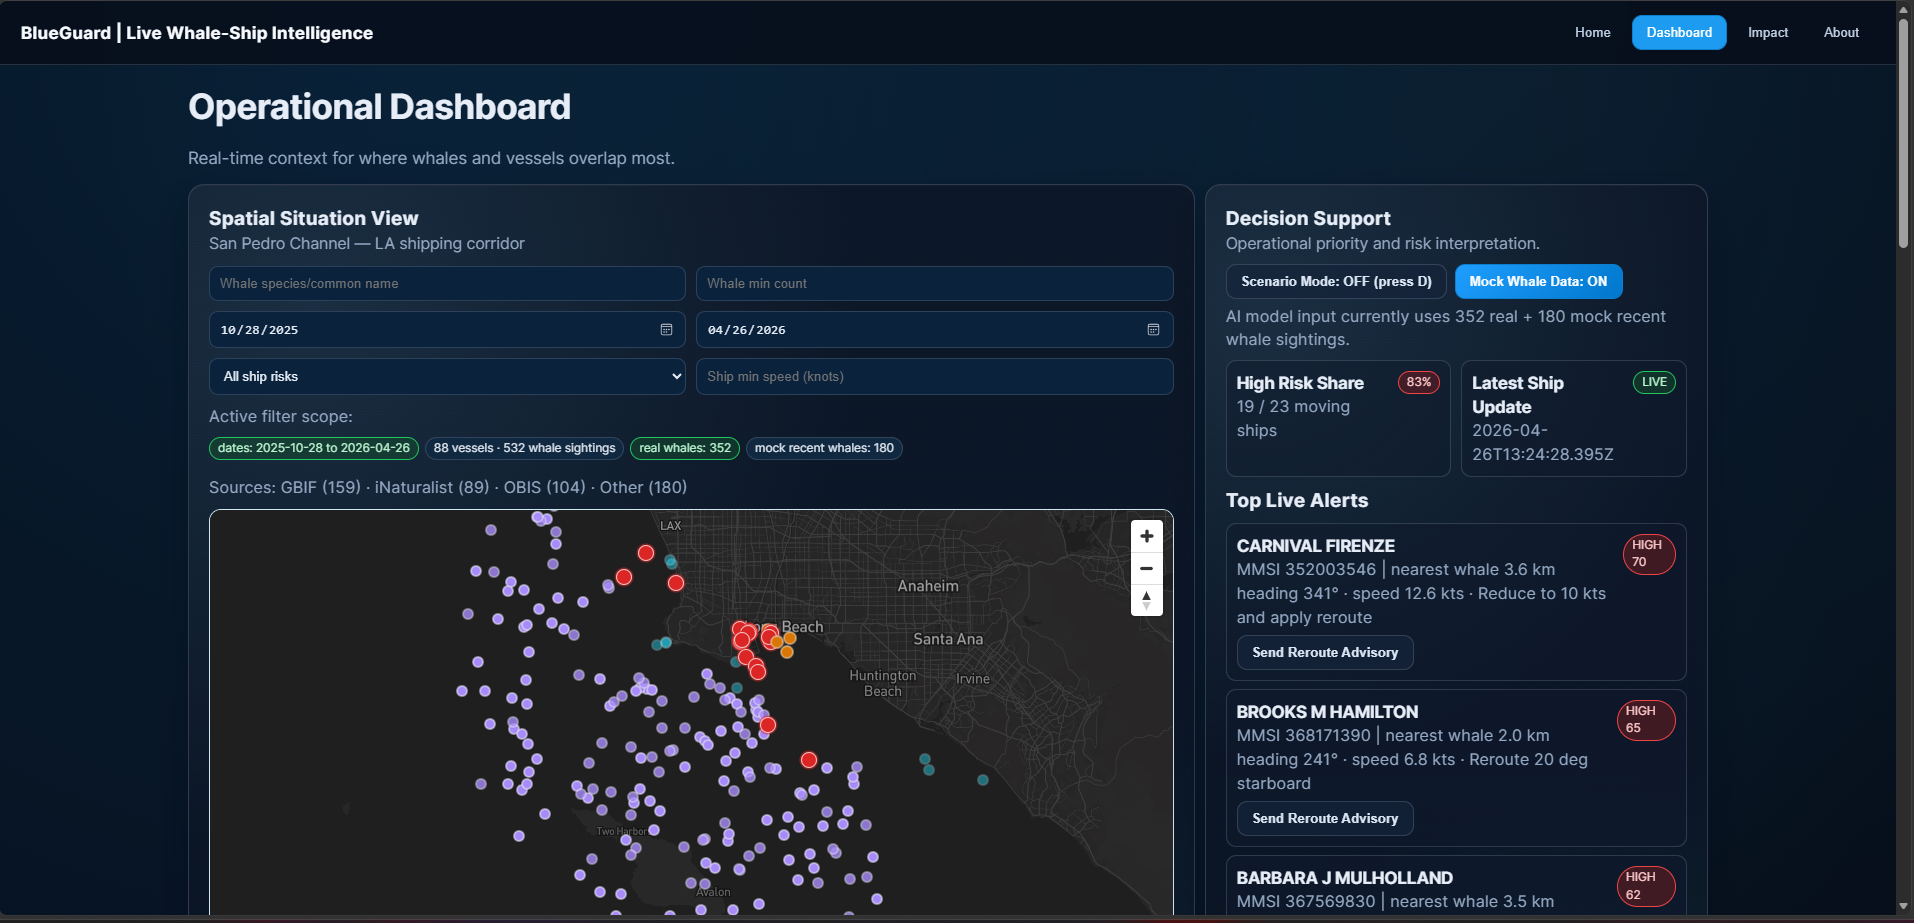
BlueGuard is a live whale–ship intelligence demo for the LA / San Pedro shipping corridor.
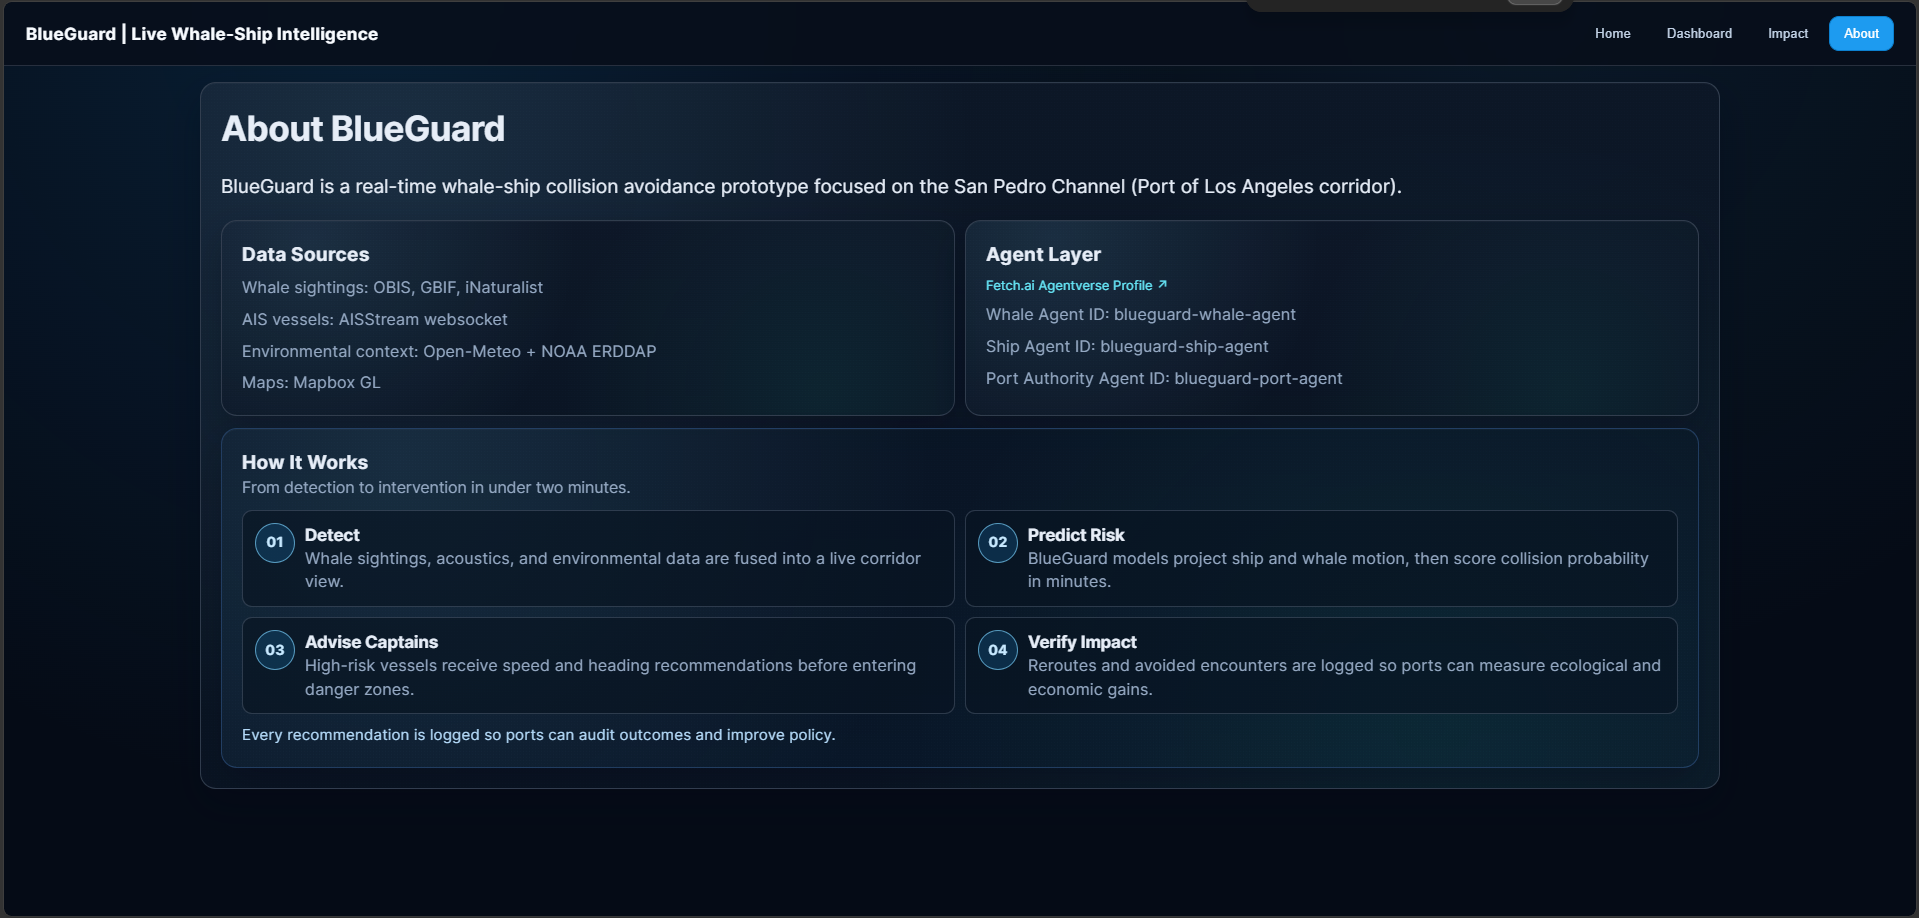
- Live AIS via AISStream on an interactive Mapbox map.
- Whale presence from public APIs (OBIS, GBIF, iNaturalist), with transparent mock “recent” points when real sightings are sparse so the corridor stays legible.
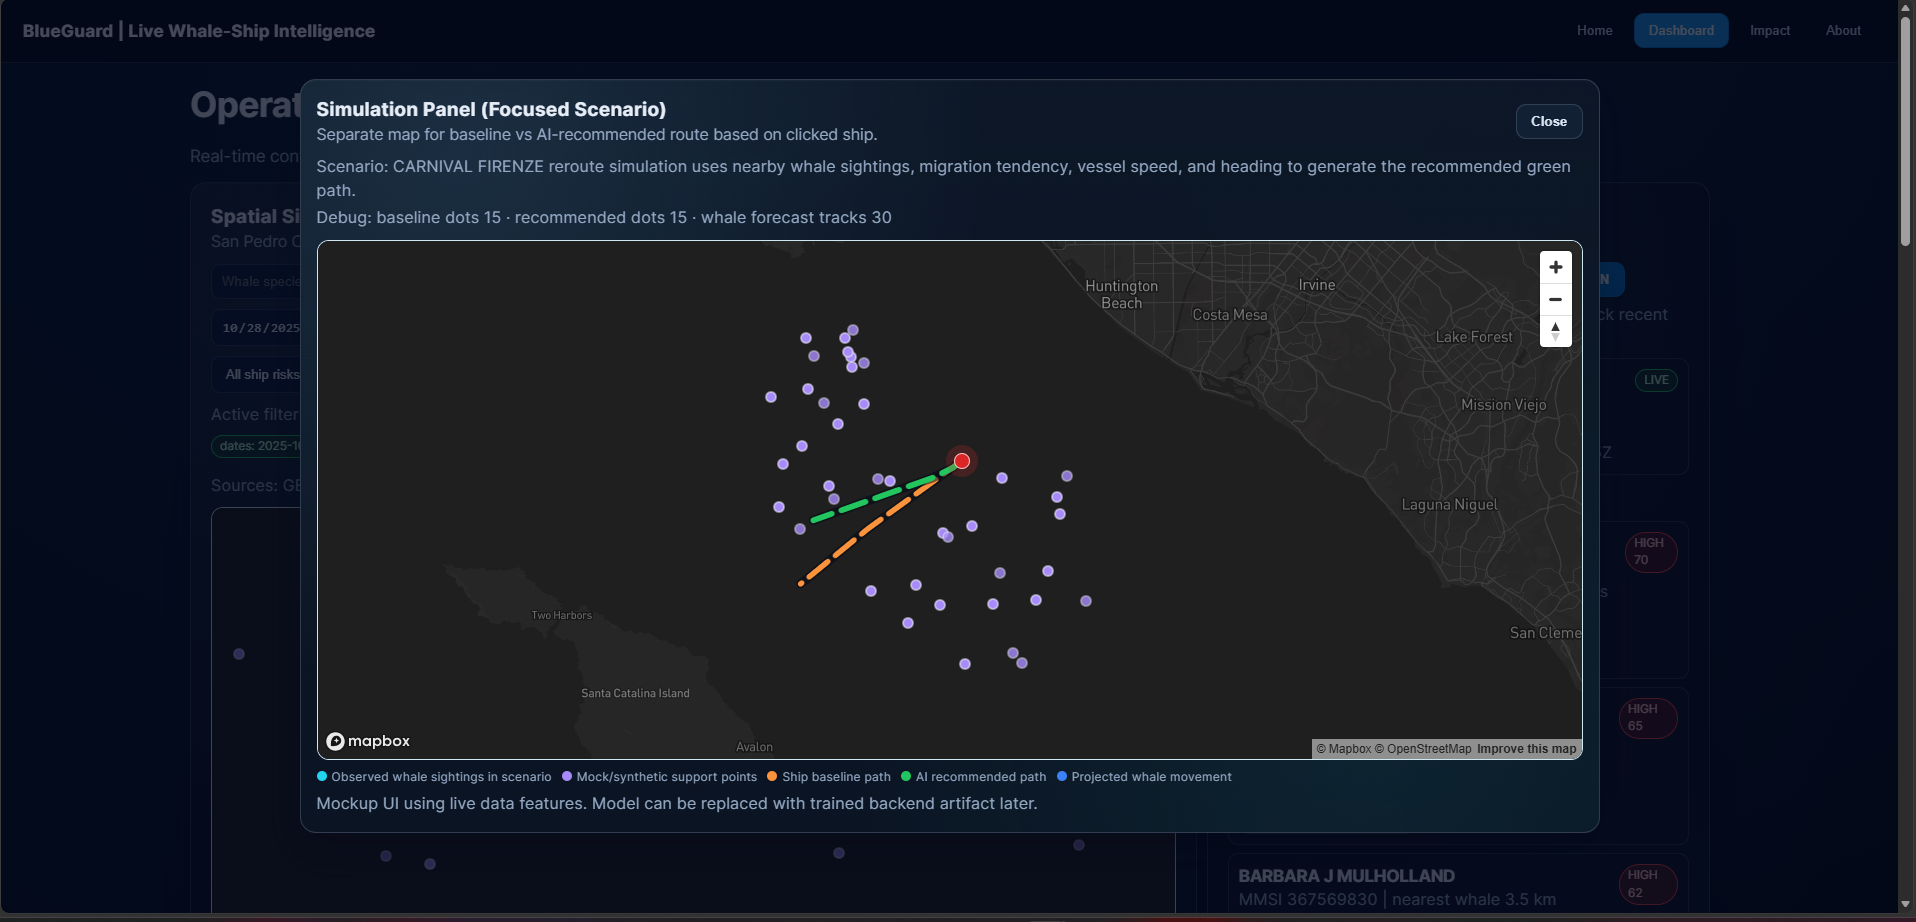
- Risk-style scoring, filters, alerts, and what-if route simulation on the dashboard (decision-support preview, not live bridge control).
- Environmental context from NOAA ERDDAP and Open-Meteo (e.g. krill suitability–style scoring in the UI narrative).
- Python tooling in the repo for reproducible snapshots: whale CSV download, environmental JSON, and combined risk snapshots.
How I built it
| Layer | Stack |
|---|---|
| Frontend | React, Vite, Mapbox GL, Tailwind (frontend-live). |
| Ships | AISStream WebSocket (often fronted by a same-origin /ws/ais proxy). |
| Whales | OBIS / GBIF / iNaturalist via API routes suitable for the browser. |
| Environment | Open-Meteo + NOAA CoastWatch / ERDDAP, with mock fallback if live calls fail. |
| Offline / batch | Python scripts: AIS client, OBIS whale export, environmental context, build_risk_snapshot. |
Core geometry uses great-circle distance on a sphere of radius $R$. With ship $(\varphi_s,\lambda_s)$ and whale $(\varphi_w,\lambda_w)$ (radians), the haversine distance is:
$$ d = 2R \arcsin\left( \sqrt{ \sin^2\frac{\Delta\varphi}{2}
- \cos\varphi_s \cos\varphi_w \sin^2\frac{\Delta\lambda}{2} } \right) $$ I also keep strike physics in view: kinetic energy scales as
$$ K = \tfrac{1}{2} m v^2, $$
so the same encounter geometry is materially different at different speeds—hence speed filters and motion-aware language in the UI.
Challenges I ran into
- Sparse whales, dense AIS — Sightings are episodic; AIS is continuous. I surface real vs mock counts instead of implying uniform whale coverage.
- Keys, CORS, and WebSockets — Browser security pushes you toward proxies and careful handling of AISStream credentials.
- Cross-dataset alignment — Dates, taxonomy, coordinate uncertainty, and API pagination across OBIS/GBIF/iNat cost more engineering than the map itself.
- Marketing vs shipped scope — “Reroute” is aspirational; what I ship is scoring + simulation + narrative until there is a certified operational integration.
Accomplishments that we're proud of
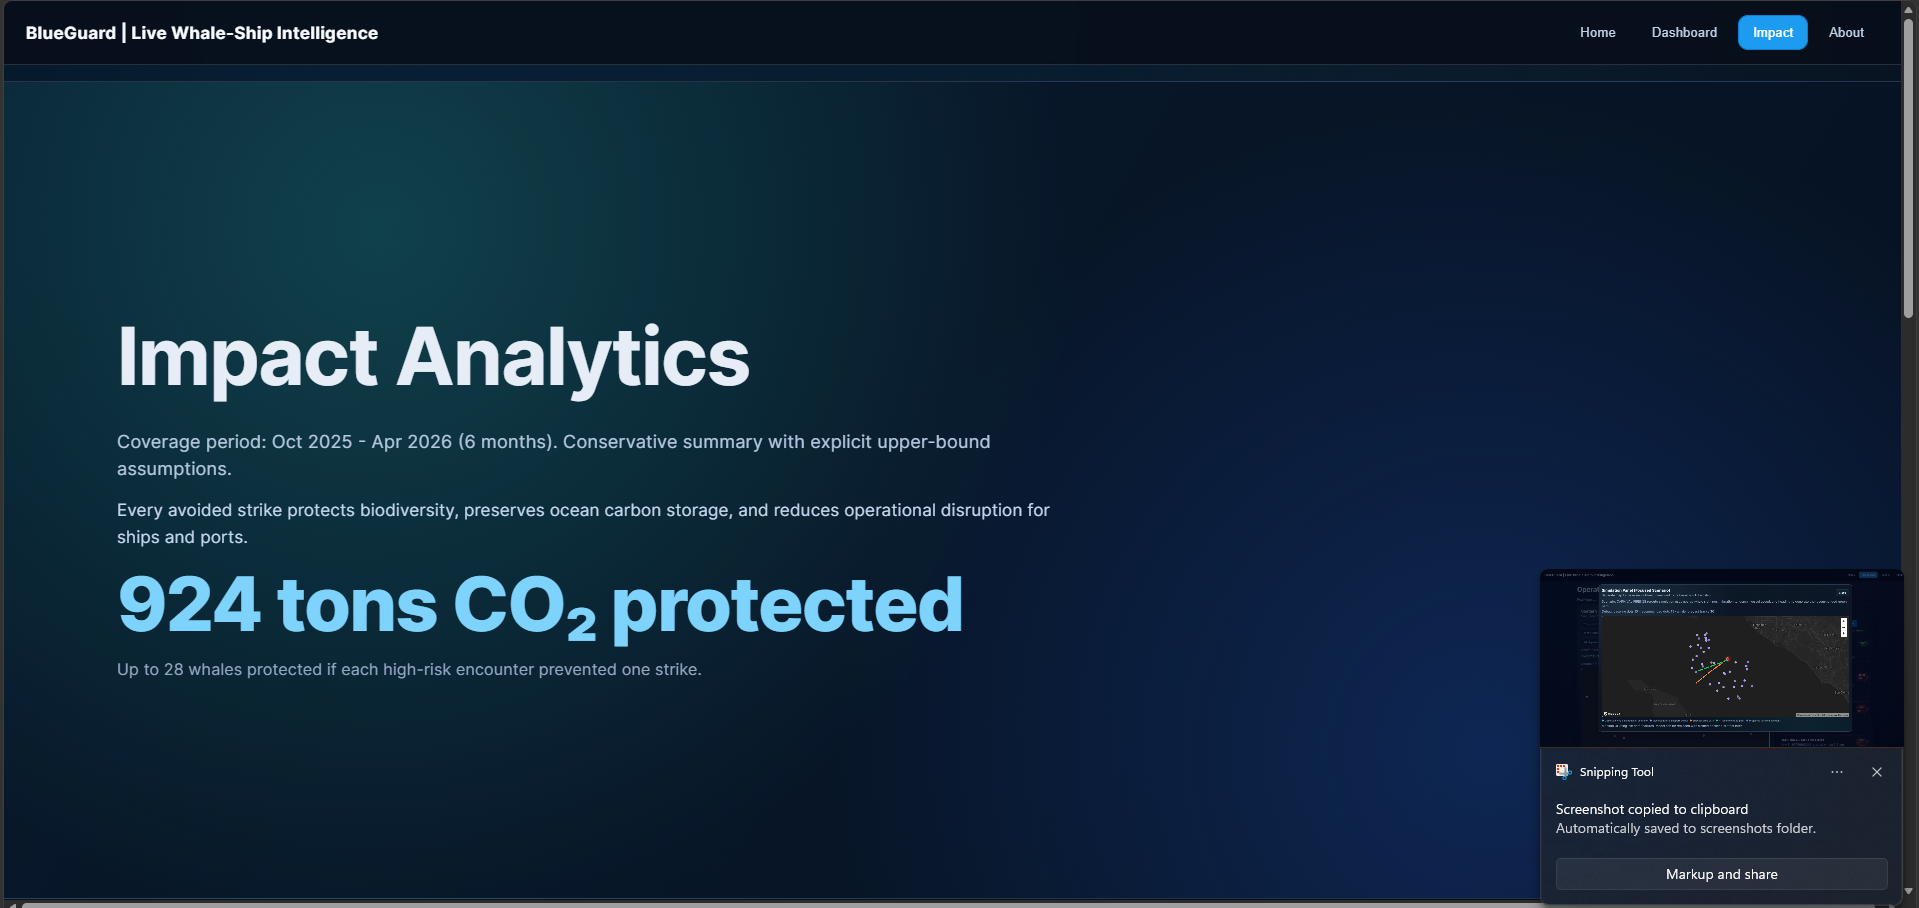
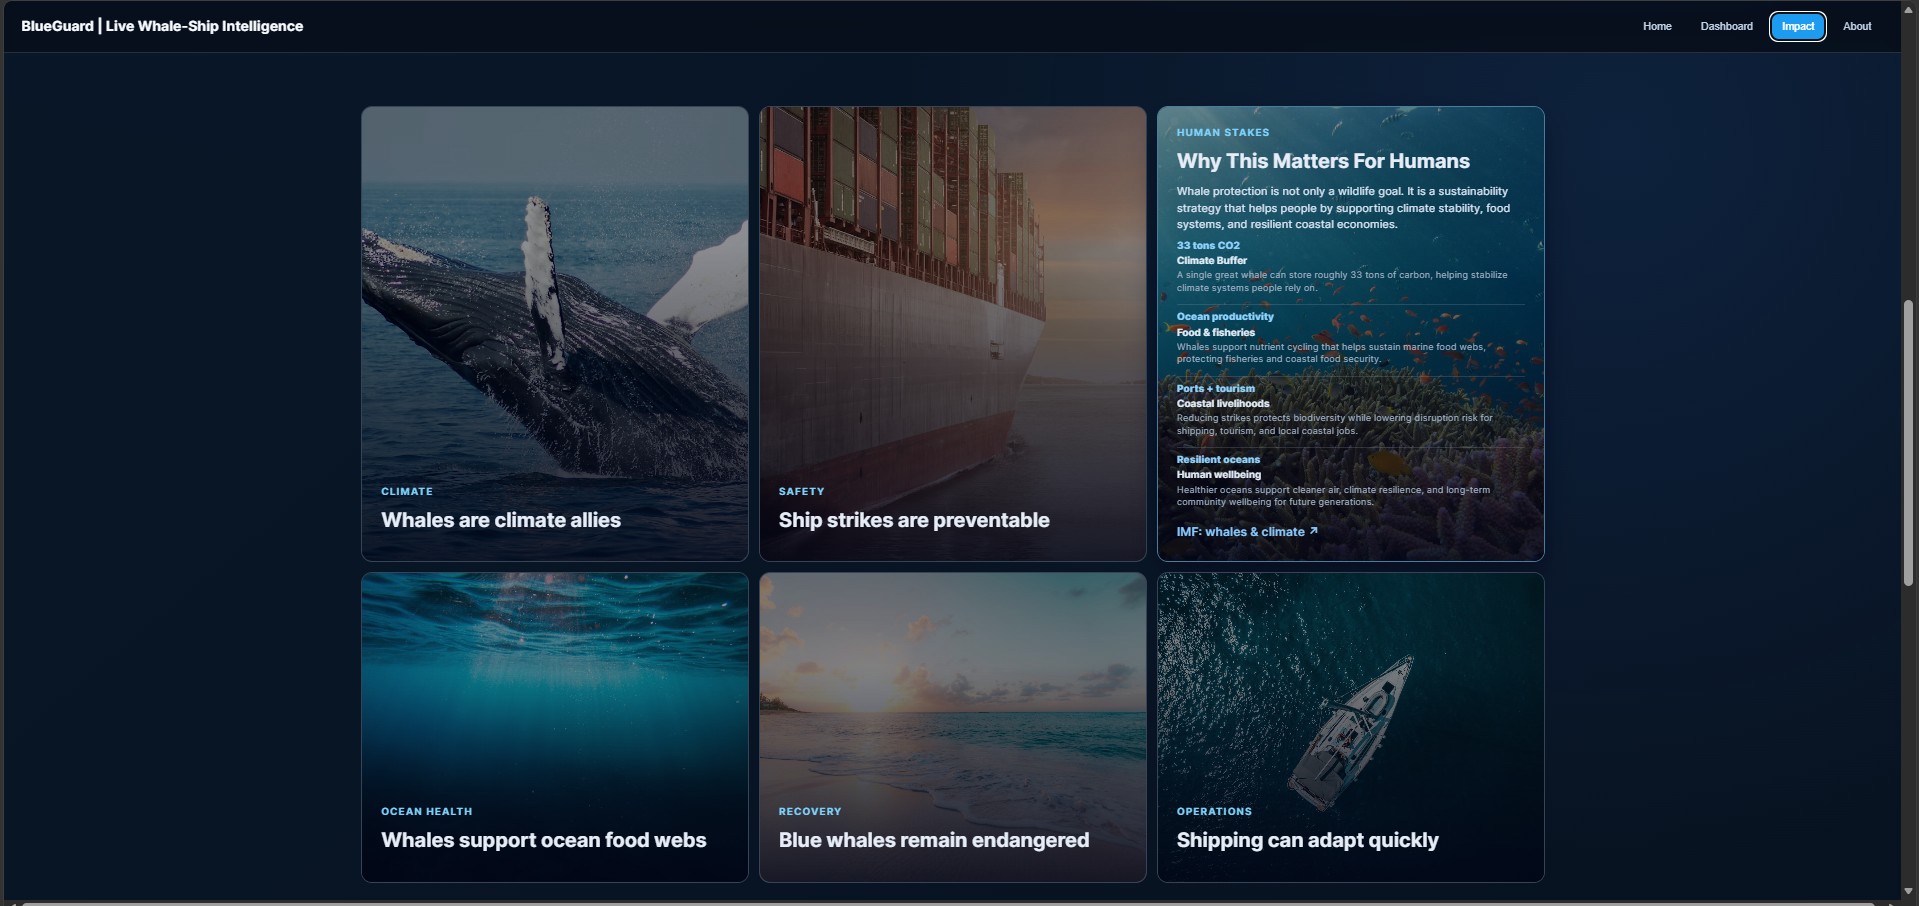
- An end-to-end story: Home preview → Operational Dashboard → Impact → About, all tied to one named corridor.
- Multi-source whale fusion with visible provenance (real + mock badges).
- Dashboard affordances that feel operational: high-risk share, top alerts, consolidated tracker, simulated paths.
- Web + Python telling the same conceptual story: fuse ships + whales + environment → risk.
What I learned
Open biodiversity APIs are a superpower for hackathons, but honest aggregation (gaps, uncertainty, mock fill) is what makes the demo defensible. Fallbacks are not cheating—they keep the map from going blank when a third party blips. Calibrating “high risk” without a labeled near-miss dataset is the harder long-term problem than drawing circles on a chart.
What's next for BlueGuard
- Retire mock layers: phase out generated “recent” whale fill and drive the map from verified sightings, partner feeds, and (where available) licensed acoustic or aerial cues so density reflects reality, not demo padding.
- Real trajectories, not toy paths: replace illustrative route overlays with motion models (AIS history, COLREGs-aware hypotheses, corridor constraints) and grounded encounter labels where I can get them (management zones, seasonality, published strike-reduction studies).
- Train the risk model: move from hand-tuned scores to a supervised or hybrid model—features such as relative bearing, closing speed, separation trends, species/season priors, and environmental context—calibrated and backtested on held-out periods and geographies.
- Continuous learning loop: ship a evaluation pipeline (offline replay + live shadow mode) so every deployment tightens thresholds instead of drifting.
- Operational hooks: when the model is stable, add pilot alerting (port dashboards, digests) with strict human-in-the-loop governance—recommendations and urgency, not silent autonomy on the bridge.
- Agents: use agents only for ingestion, enrichment, and audit logs; keep collision judgments on a versioned, reviewable model card so “AI” stays traceable.
Built With
- aisstream
- coastwatch
- css
- dom
- erddap
- gbif
- gl
- inaturalist
- javascript
- mapbox
- marine
- noaa
- obis
- open-meteo
- python
- react
- tailwind
- vite

Log in or sign up for Devpost to join the conversation.