-

View live station data
Inspiration
Boston’s Bluebikes network is everywhere — but anyone who rides often knows the frustration of arriving at a station with no bikes or no docks. We wanted to build a tool that could predict availability before it happens, using real data and live feeds. Our inspiration came from everyday inconvenience and the question: “Can we see the future of bike demand — even just one hour ahead?”
What it does
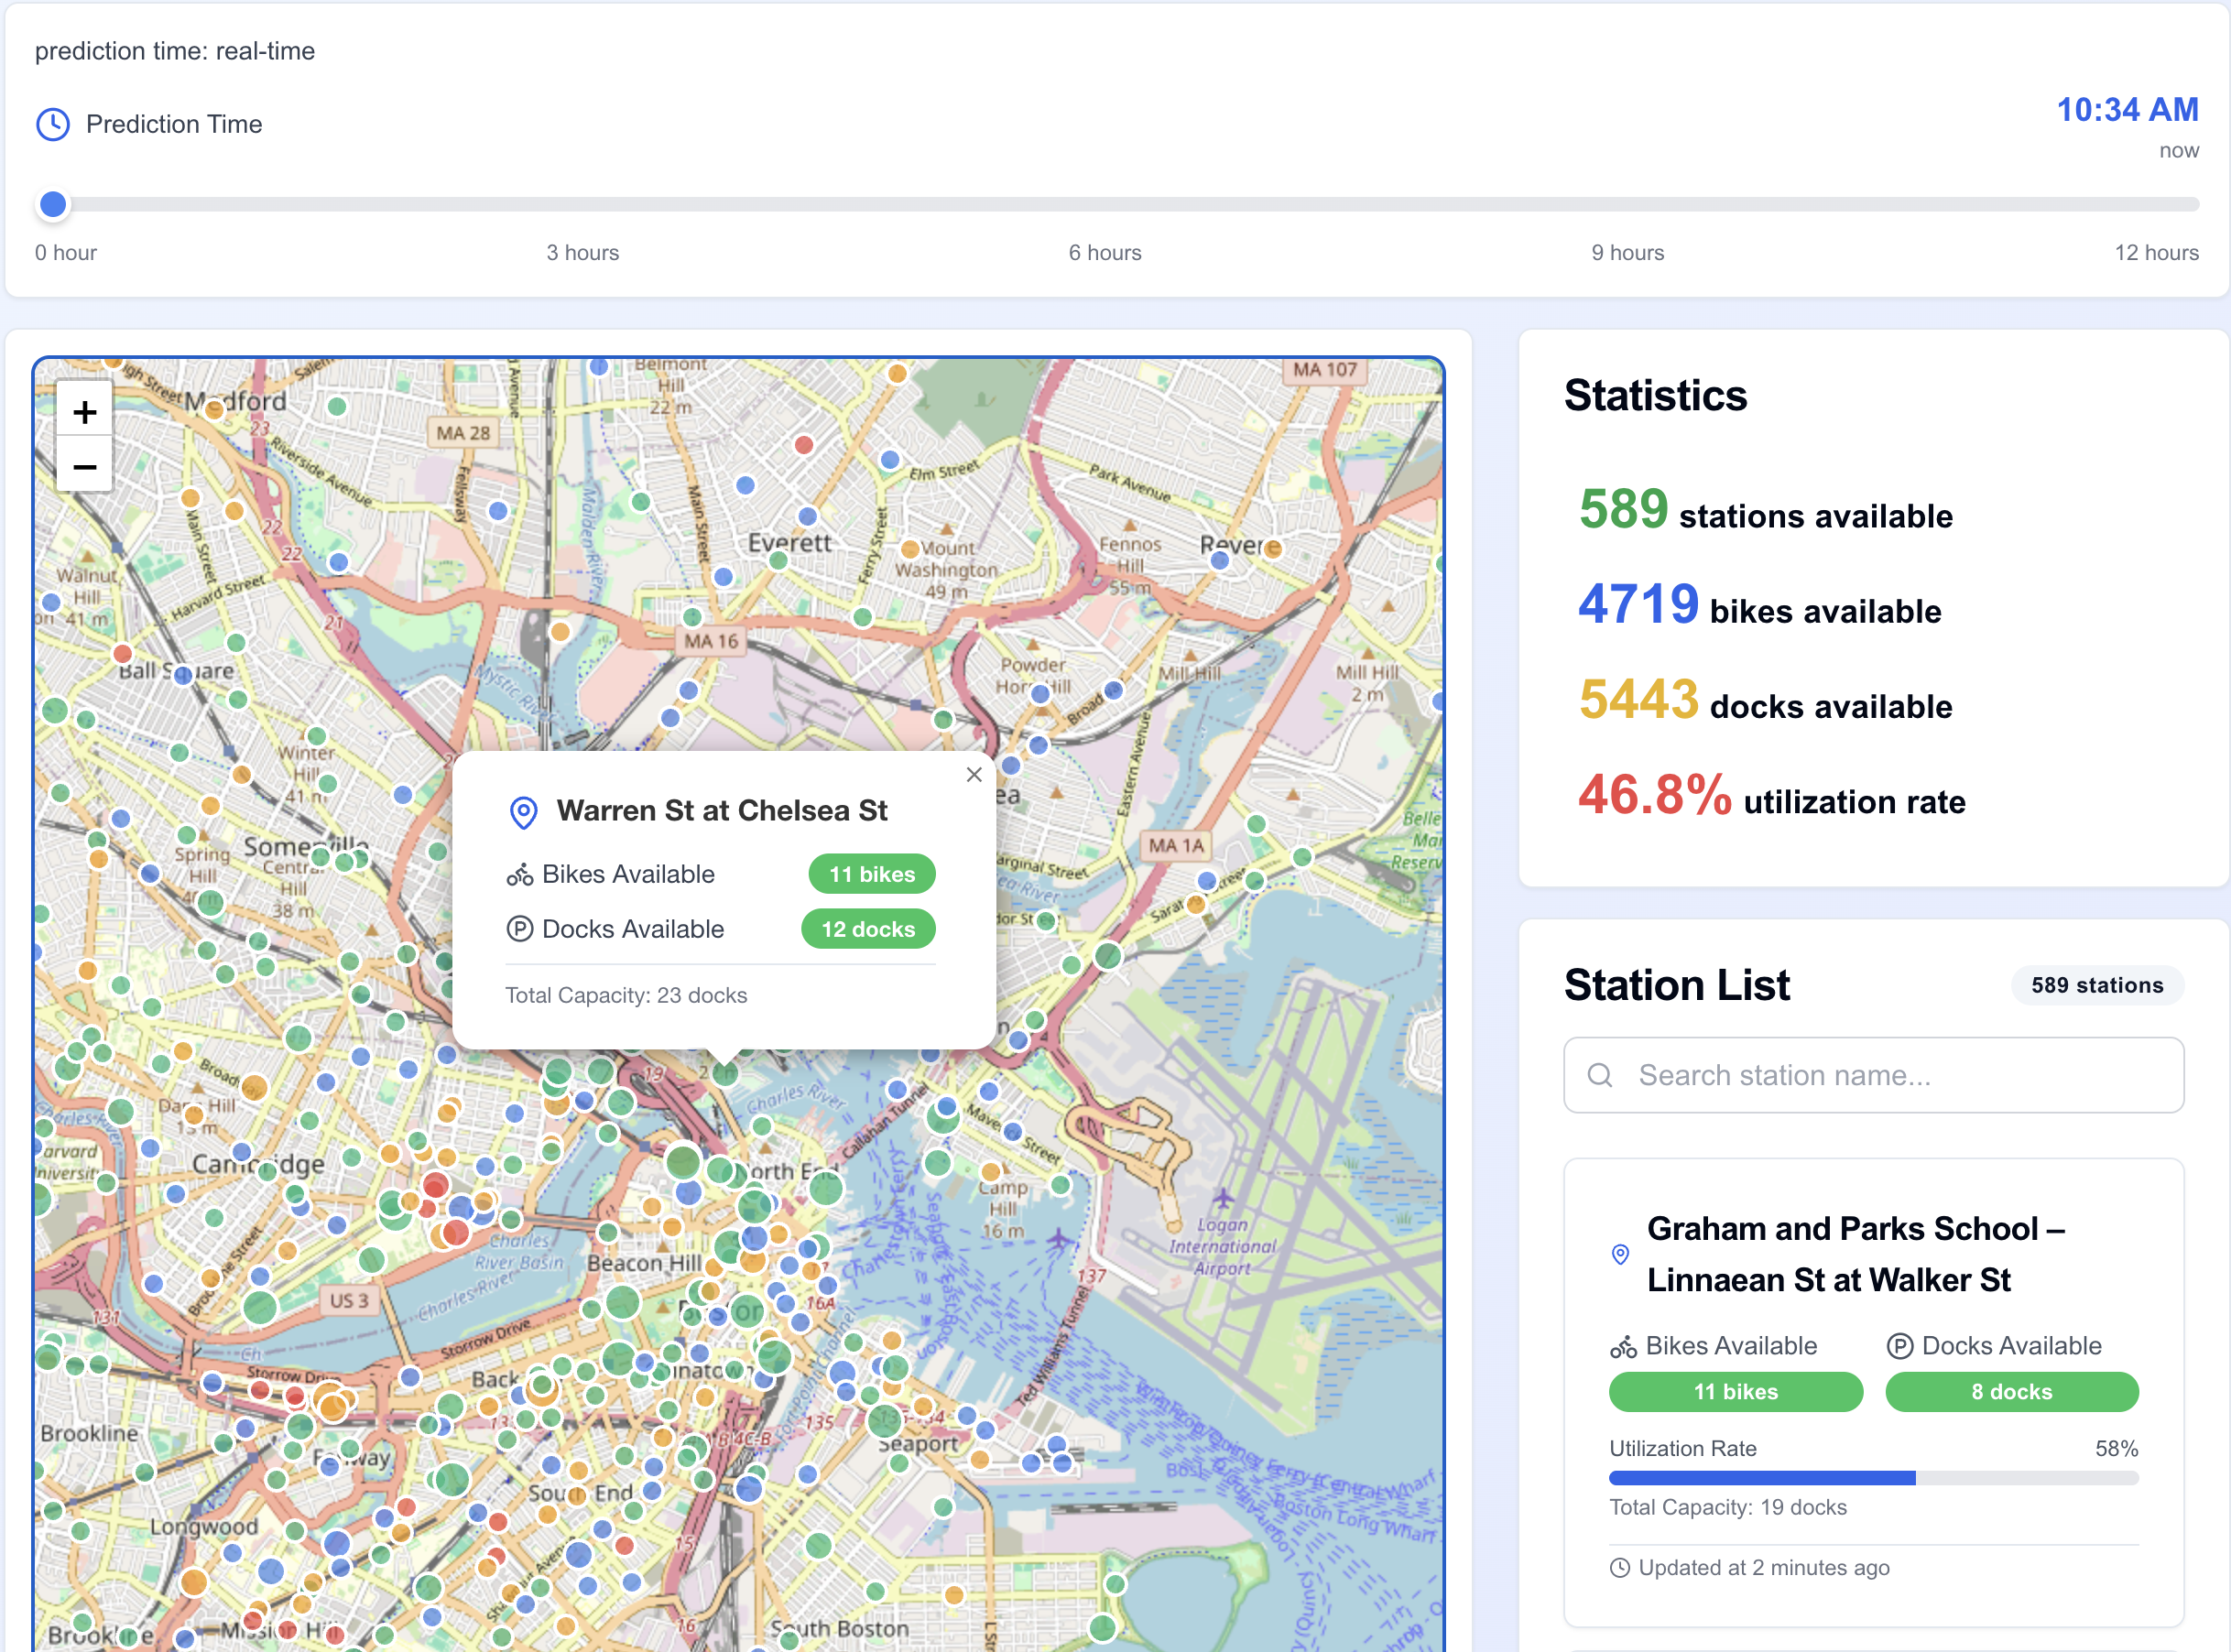
Bluebikes Demand Forecasting is a real-time web app that:
- Pulls live data from Bluebikes’ public GBFS API every few minutes
- Predicts bike and dock availability for the next 60 minutes at each station
- Visualizes it all on an interactive map, color-coded by predicted shortage or surplus
It helps riders plan smarter and lets planners instantly spot high-demand zones.
How we built it
We split the project into three quick but powerful parts:
- Data Ingestion: Collected live station data from the GBFS API and historical trip data to compute short-term patterns.
- Modeling: Built a lightweight regression-based predictor (linear/XGBoost) to forecast the number of available bikes at each station in one hour. $$\hat{y}{t+60} = f(\text{bikes}{t}, \text{docks}_{t}, \text{hour}, \text{weekday})$$
- Frontend: Developed a Next.js + Leaflet interactive map with real-time updates, connected to a Flask backend serving predictions. We deployed both locally using Docker for easy integration.
Challenges we ran into
- Combining real-time streaming data with a machine learning model in only 30 hours
- Debugging Leaflet re-rendering issues in React (hello, “Map container already initialized”)
- Coordinating between Python (Flask) and TypeScript (Next.js) under tight time pressure
- Managing API rate limits and caching live station snapshots
Accomplishments that we're proud of
- Built a fully functional end-to-end system in just 30 hours
- Integrated real-time data + prediction + visualization seamlessly
- Achieved smooth live updates and clear visual indicators for risk levels
- Learned how to deploy and connect cross-language services efficiently
What we learned
- How to design a data pipeline under extreme time constraints
- The importance of lightweight, interpretable models in real-time systems
- How to bridge machine learning with live web technologies (Python ↔ Node ↔ React)
- That even a small forecast window (60 min) can make city mobility smarter
What's next for Bluebikes Demand Forecasting
- Integrate weather and event data to improve accuracy
- Deploy a public web dashboard for Boston riders
- Extend to 15-min rolling forecasts and uncertainty intervals
- Eventually help the city with bike rebalancing insights and sustainability planning
Built With
- flask
- leaflet.js
- next.js
- python


Log in or sign up for Devpost to join the conversation.