-

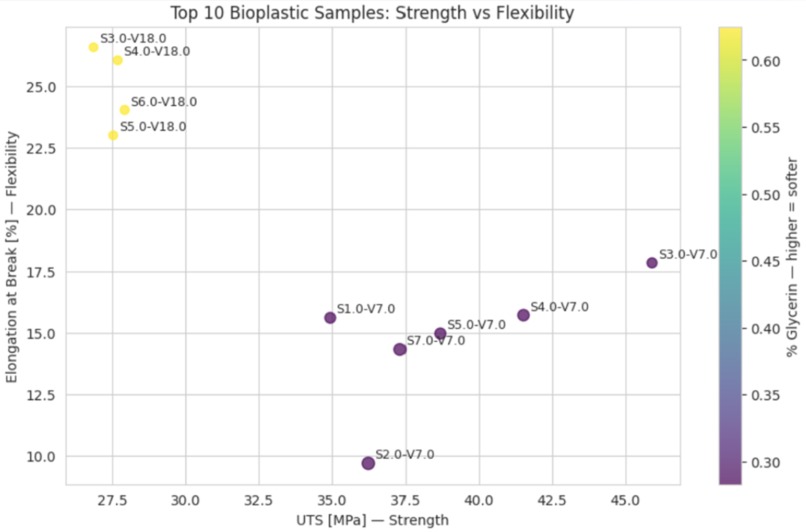
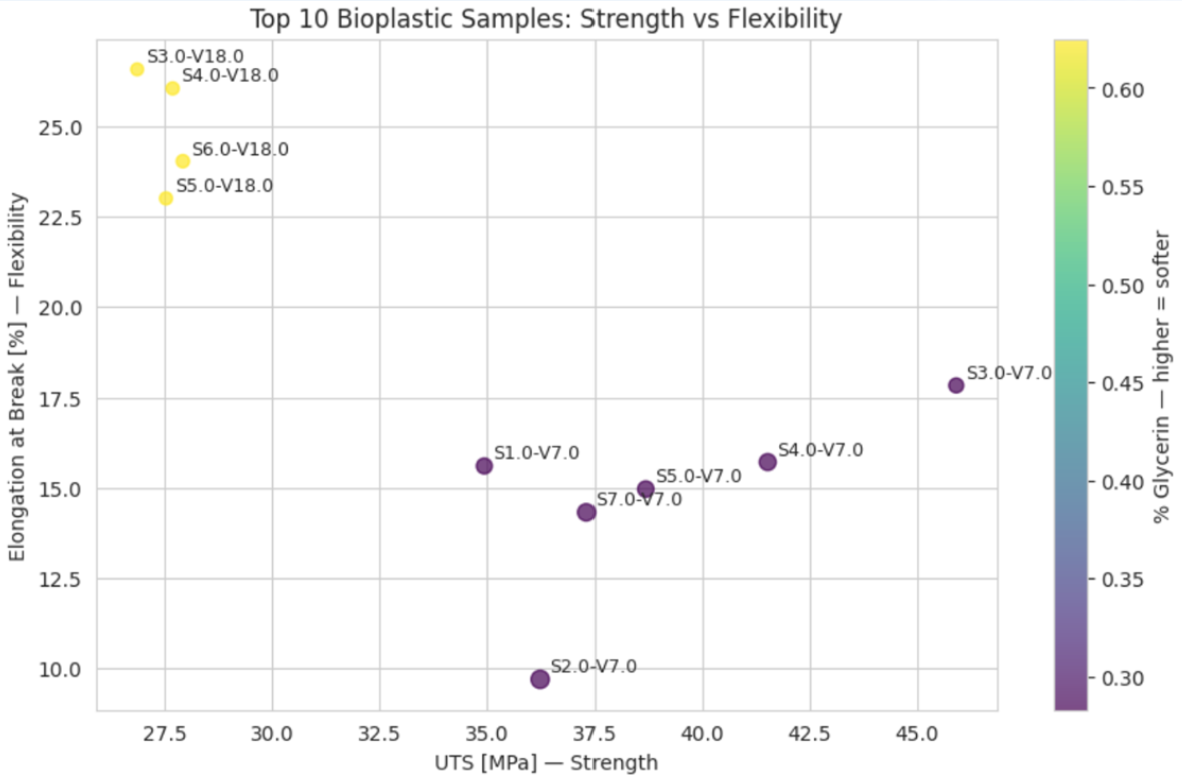
Top biodegradable plastics compared by strength and flexibility, showing the most durable and practical options.
-
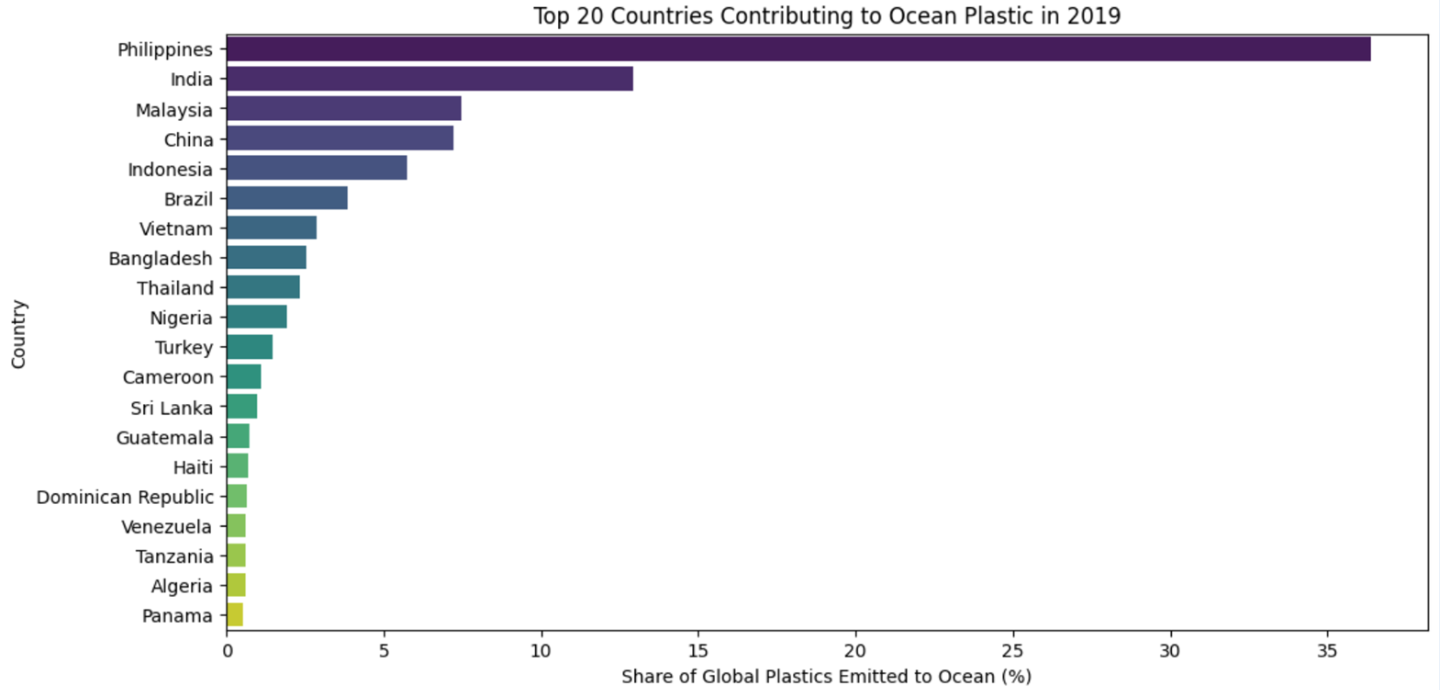
Top 20 countries contributing the most plastic to oceans, highlighting major contributors and the scale of the pollution crisis.
-
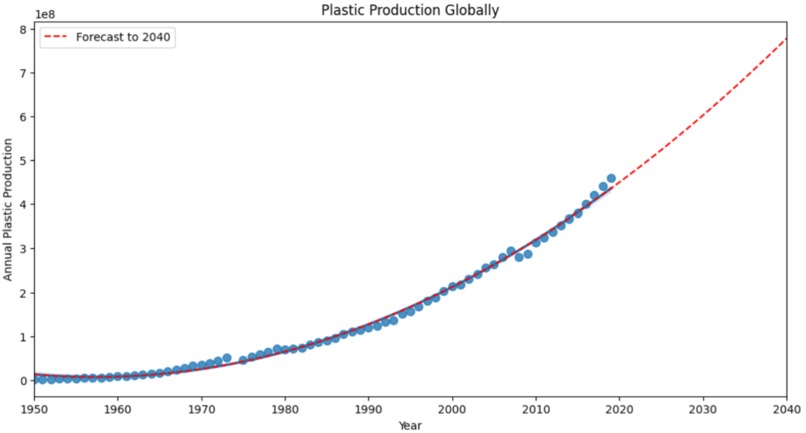
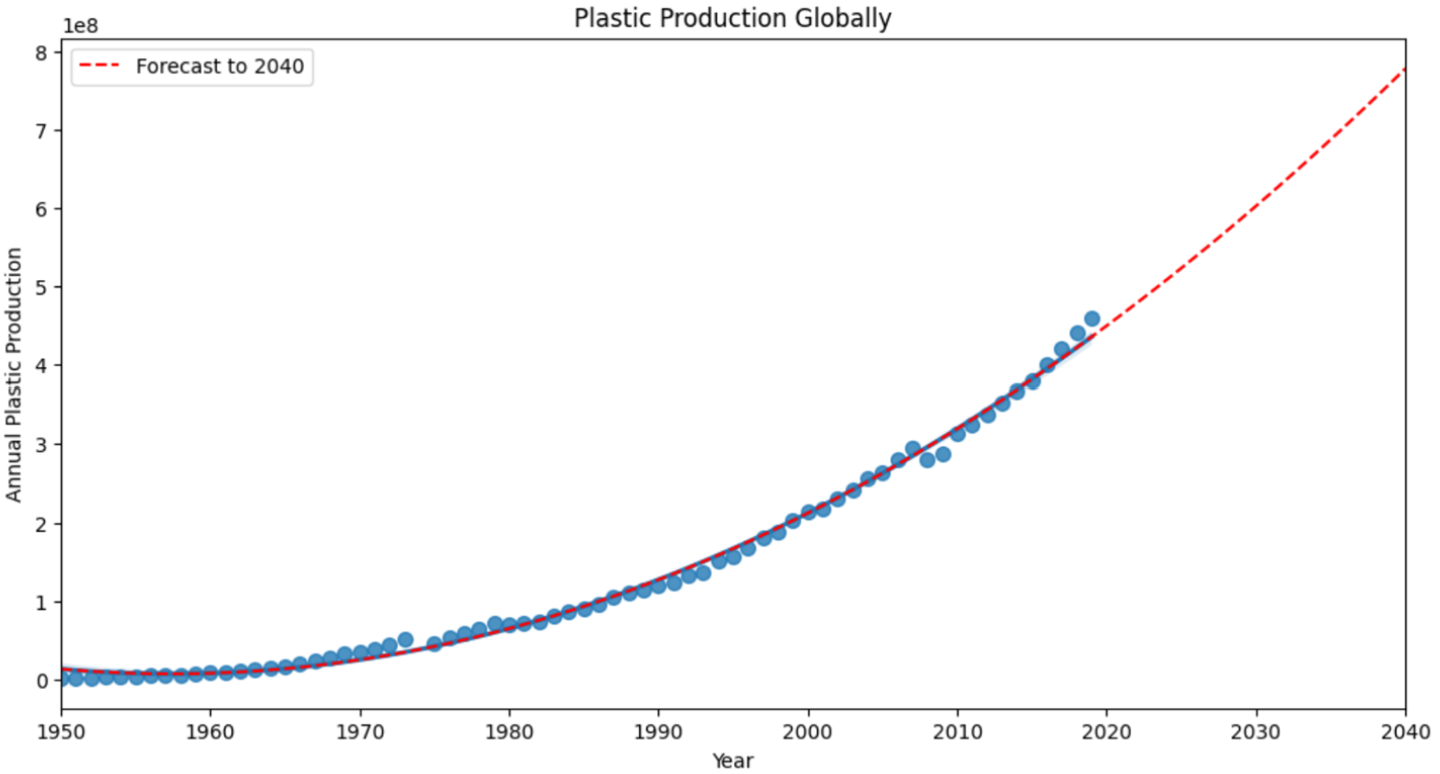
Forecast of ocean plastic from 1960–2040, showing historical trends and projected growth if current waste patterns continue.
-
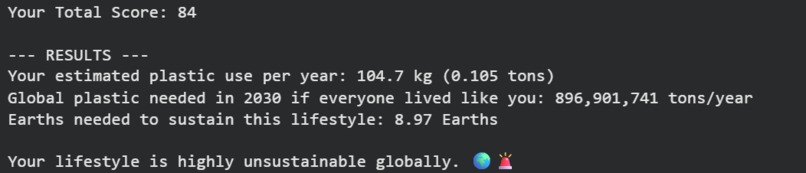
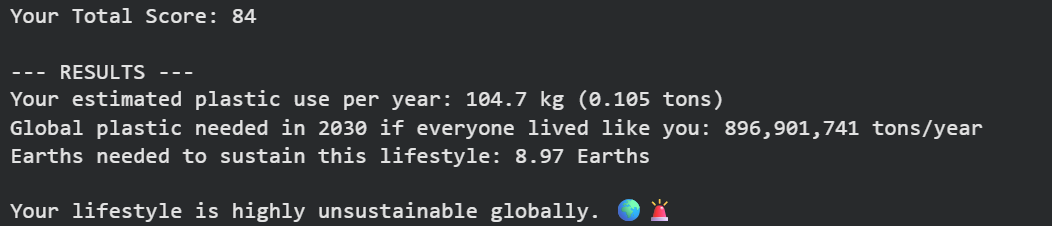
Interactive quiz calculates how many Earths your lifestyle would need, showing your personal ecological footprint and impact.
Inspiration
I was inspired by the growing crisis of plastic pollution and its impact on oceans, wildlife, and climate. I wanted to explore sustainable solutions, like biodegradable plastics, and help people understand their ecological footprint. The goal was to combine science, data, and interactive tools to make this issue actionable.
What it does
The Blue Guard Initiative is an interactive platform that helps users:
Analyze biodegradable plastics, comparing their strength, flexibility, and composition.
Track top countries contributing to ocean plastic pollution.
Explore trends in global plastic emissions.
Take a quiz to calculate your ecological footprint, showing how many Earths would be needed to sustain your lifestyle.
All results are presented in clear, human-friendly language and visualized with charts and graphs for easy understanding.
How I built it
Collected datasets on biodegradable plastics, ocean plastic pollution, and human ecological footprints.
Cleaned and processed the data using Python and pandas, fixing formatting issues, missing values, and encoding errors.
Analyzed and ranked bioplastics by strength, flexibility, and composition.
Created visualizations: scatterplots, bar charts, and trendlines showing important patterns.
Built an interactive website on Google Sites, embedding charts, trend predictions, and quizzes.
We also used LaTeX to display calculations, like ecological footprint:
Challenges I ran into
Data quality issues: Some datasets were messy with inconsistent formatting, extra semicolons, and non-standard encodings.
Integrating different data types: Combining plastic performance, country pollution, and human consumption data required normalization and careful alignment.
Visualization complexity: Showing multiple factors—strength, flexibility, glycerin content—in one graph required trial and error with scatterplots, colors, and marker sizes.
Balancing technical detail and readability: Translating raw numbers into human-friendly insights for a public audience was challenging.
Platform limitations: Embedding dynamic elements like charts and quizzes in Google Sites required creative workarounds.
Accomplishments that I am proud of
Successfully cleaned and analyzed real-world datasets on bioplastics and global plastic pollution.
Developed visualizations that clearly communicate complex relationships like strength vs flexibility.
Built an interactive quiz that lets users understand their personal impact on the planet.
Created a comprehensive educational platform that blends science, data, and user engagement.
What I learned
The importance of data cleaning and preparation for reliable analysis.
How to translate technical measurements into human-understandable concepts, like describing plastic strength in plain language.
What's next for Blue Guard
Interactive, Gamified Quiz: Turn the text-based quiz into a playful, interactive experience where users earn “Eco Points” based on their lifestyle choices and get suggestions for improvement.
Virtual Lab for Bioplastics: Let users experiment with different biodegradable material compositions and see predicted strength, flexibility, and decomposition time in real-time.
Plastic Footprint Simulator: A dynamic tool where visitors can adjust daily habits (like water usage, diet, or waste) and watch their Earth Overshoot change visually.
Community Showcase: Feature user-submitted experiments, art, or sustainable solutions inspired by the platform, turning the site into a collaborative learning hub.
Built With
- bioplastic-samples-dataset
- chardet
- global-ocean-pollution-dataset
- google-colab
- google-sites
- matplotlib
- numpy
- ocean-pollution-by-country-dataset
- pandas
- python
- seaborn

Log in or sign up for Devpost to join the conversation.